Quality of a machine learning model must be assessed not only during model development phase but also after a model is deployed in production. During development, a model developer must keep in mind the impact of the results produced by the model and use appropriate scoring metrics that will expose underlying issues. For example, in cases where a model is used to detect a disease like Cancer, False Negative and False Positive have severe consequences and use of appropriate scoring metric becomes critical. Once a model is deployed in production, the model quality must be measured frequently as model may produce suboptimal results over time due to factors such as changes in trends, poor outlier handling and class imbalance in the original training dataset. To expose the issues underlying model degradation of a deployed model, user needs to select appropriate scoring metrics.
MySQL HeatWave ML supports a range of scoring metrics to compute the model quality. The supported scoring metrics can be used for specific purposes as described in this blog. In case if the model score is not optimal, user can use Explanability features in MySQL HeatWave ML to understand the impact of each feature and based on that construct new features from the context. New model can be retrained fast and accurately, enabling user to create the model iteratively. Most importantly user does not have to move data or model out of the database as MySQL HeatWave ML offers true in-database machine learning.
Scoring Metrics
MySQL HeatWave ML supports various scoring metrics as shown in the Table 1. User needs to keep in mind the characteristics of these metrics, to use them effectively.
| ML Task |
Scoring Metric |
| Binary Classification |
precision, recall, f1 |
| Binary and Multi Class Classification |
accuracy, balanced_accuracy, f1_micro, f1_macro, f1_macro, recall_micro, recall_macro, precision_micro, precision_macro |
| Regression |
neg_mean_squared_error, neg_mean_absolute_error, r2, neg_mean_squared_log_error, neg_median_absolute_error |
Table 1 : Supported metrics for the corresponding ML Task
The scoring metrics ‘accuracy’ and ‘balanced_accuracy’ are applicable to both binary and multiclass classification. In binary classification, exactly one of two classes is predicted. In multi-class classification exactly one of more than two classes is predicted. The scoring metrics ‘f1’, ‘precision’, ‘recall’ can only be used for binary classification. However, these metrics are extended to support multi-class classification by treating the problem as collection of binary classification problems, one for each class.
There are several ways to average binary metric calculations across the set of classes such as,
- Macro: Calculates the mean of the binary metrics, giving equal weight to each class. Macro-averaging should be used in cases where treating all the classes equally is important.
- Micro: Micro averaging is preferred in multi class classification where majority class needs to be ignored and getting accuracy of minority classes is important.
Dataset
The examples of HeatWave ML scoring metric provided in this document are based on,
- Iris dataset from scikit-learn – This data set consists of 50 samples from each of three species of Iris (Iris setosa, Iris virginica and Iris versicolor). Four features were measured from each sample: the length and the width of the sepals and petals, in centimeters. The ML task is, based on the combination of these four features, develop a ML model to distinguish the species from each other.
- Diamonds dataset – This dataset contains the price and other 10 attributes of almost 54,000 diamonds. The ML task is, based on the features provided in the dataset, develop a ML model to predict diamond price.
User needs to create a HeatWave cluster and use datasets described above to try the Score functionality using scoring metrics provided in this blog.
Classification
Build the regression model based on Iris dataset and load the model.
CALL sys.ML_TRAIN(‘Iris.iris_train’, ‘class’,JSON_OBJECT(‘task’, ‘classification’), @iris_model);
CALL sys.ML_MODEL_LOAD(@iris_model, NULL);
The scoring metrics examples provided below are created using the iris_model.
Confusion Matrix
A Confusion matrix is an N x N matrix used for evaluating the performance of a classification model, where N is the number of target classes. The matrix compares the actual target values with those predicted by the machine learning model. This gives us a holistic view of how well our classification model is performing and what kinds of errors it is making. The classification metrics discussed in this section can be represented using Confusion Matrix.
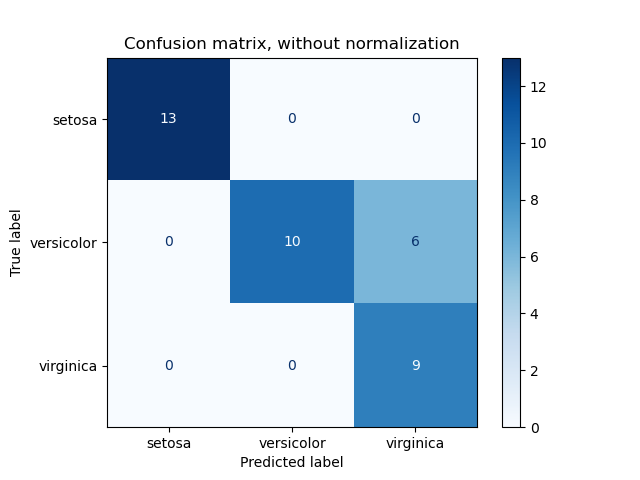
Figure 1: Confusion Matrix for Iris Dataset Source
To explain the confusion matrix given below with an example, let us consider a task to classify whether a person is pregnant or not pregnant. A person who is actually pregnant (positive) and classified as pregnant (positive) is called TRUE POSITIVE (TP). A person who is actually not pregnant (negative) and classified as not pregnant (negative) is called TRUE NEGATIVE (TN). A person who is actually not pregnant (negative) and classified as pregnant (positive) is called FALSE POSITIVE (FP). A person who is actually pregnant (positive) and classified as not pregnant (negative) is called FALSE NEGATIVE (FN).
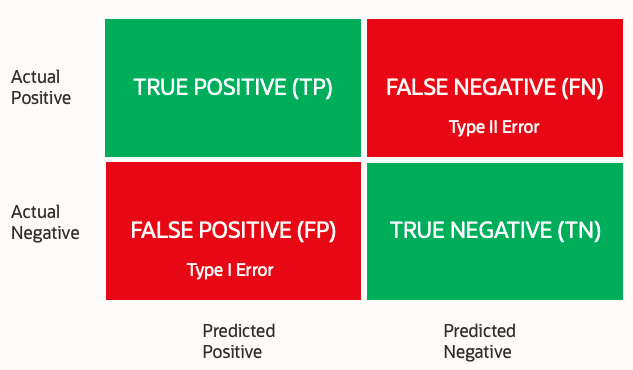
Figure 2 : Confusion Matrix
accuracy
Accuracy score is calculated by dividing number of correct predictions by total number of predictions. Accuracy can be used for binary as well as multi class classification. It is used when the True Positives and True Negatives are more important and when the class distribution is similar.
Example –
CALL sys.ML_SCORE(‘Iris.iris_validate’, ‘class’, @iris_model, ‘accuracy’, @score);
SELECT @score;
@score
0.9666666388511658
precision
Precision is the measure of the correctly identified positive cases from all the predicted positive cases. It is useful when the costs of False Positives are high. Precision can only be used for binary classification however the extended metrics (precision_micro, precision _macro) can be used for multi class classification.
Example –
CALL sys.ML_SCORE(‘Iris.iris_validate’, ‘class’, @iris_model, ‘precision_micro’, @score);
SELECT @score;
@score
0.9666666388511658
CALL sys.ML_SCORE(‘Iris.iris_validate’, ‘class’, @iris_model, ‘precision_macro’, @score);
SELECT @score;
@score
0.9777777791023254
recall
Recall is the measure of the correctly identified positive cases from all the actual positive cases. It is important when the cost of False Negatives is high. It is the measure of how many positive classes, the model was able to predict correctly. Recall metric can only be used for binary classification however the extended metrics ( recall_micro, recall_macro) can be used for multi class classification.
Example –
CALL sys.ML_SCORE(‘Iris.iris_validate’, ‘class’, @iris_model, recall_micro’, @score);
SELECT @score;
@score
0.966666638851
CALL sys.ML_SCORE(‘Iris.iris_validate’, ‘class’, @iris_model, recall_macro’, @score);
SELECT @score;
@score
0.958333313465
balanced_accuracy
Balanced accuracy matric avoids inflated performance estimates on imbalanced datasets. It is used in binary as well as multiclass classification problems. It is defined as the average of recall obtained on each class.
Example –
CALL sys.ML_SCORE(‘Iris.iris_validate’, ‘class’, @iris_model, ‘balanced_accuracy’, @score);
SELECT @score;
@score
0.9583333134651184
f1-score
f1-score is the harmonic mean of Precision and Recall and gives a better measure of the incorrectly classified cases than the accuracy metric. It is used when the False Negatives and False Positives are crucial. For example – In case of testing for life threatening decease, False Negatives and False Positives are crucial. f1-score is a better metric when there are imbalanced classes. f1-score metric can only be used for binary classification however the extended metrics ( f1_micro, f1_macro ) can be used for multi class classification.
Example –
CALL sys.ML_SCORE(‘Iris.iris_validate’, ‘class’, @iris_model, ‘f1_macro’, @score);
SELECT @score;
@score
0.9662835001945496
Regression
Build the regression model based on Diamonds dataset and load the model.
CALL sys.ML_TRAIN(‘Diamonds.diamonds_train’, ‘price’, JSON_OBJECT(‘task’, ‘regression’), @diamonds_model);
CALL sys.ML_MODEL_LOAD(@diamonds_model, NULL);
The scoring metrics examples provided below are created using the diamonds_model.
neg_mean_squared_error
A risk metric corresponding to the value of the squared (quadratic) error or loss.
Example –
CALL sys.ML_SCORE(‘Diamonds.diamonds_test’, ‘price’, @diamonds_model, ‘neg_mean_squared_error’, @score);
SELECT @score;
@score
-0.007937146350741386
neg_mean_absolute_error
A risk metric corresponding to the value of the absolute error loss.
Example –
CALL sys.ML_SCORE(‘Diamonds.diamonds_test’, ‘price’, @diamonds_model, ‘neg_mean_absolute_error’, @score);
SELECT @score;
@score
-0.02085324004292488
r2
r2 score represents the proportion of variance of dependent variable that has been explained by the independent variables in the model. It provides an indication of goodness of fit and therefore a measure of how well unseen samples are likely to be predicted by the model, through the proportion of explained variance.
Example –
CALL sys.ML_SCORE(‘Diamonds.diamonds_test’, ‘price’, @diamonds_model, ‘r2’, @score)
SELECT @score;
@score
0.9831354022026062
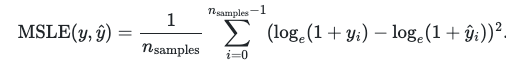
neg_mean_squared_log_error
A risk metric corresponding to the value of the squared logarithmic (quadratic) error or loss. This metric is best to use when target is having exponential growth, such as population counts, average sales of a commodity over a span of years etc.
Example –
CALL sys.ML_SCORE(‘Diamonds.diamonds_test’, ‘price’, @diamonds_model, ‘neg_mean_squared_log_error’, @score);
SELECT @score;
@score
-0.0009180943598039448
neg_median_absolute_error
This metric calculated by taking the median of all absolute differences between the target and the prediction. It is robust to outliers.
Example –
CALL sys.ML_SCORE(‘Diamonds.diamonds_test’, ‘price’, @diamonds_model, ‘neg_median_absolute_error’, @score);
SELECT @score;
@score
-0.011675260029733181
In summary, MySQL HeatWave ML supports various scoring metrics for Classification ( binary and multi-class ) and Regression models to compute the model quality. Accuracy metric should be used when the class distribution is similar. Precision metric is useful when the costs of False Positives is high. Recall should be used when the cost of False Negatives is high. Balanced accuracy matric is useful when dataset is imbalanced. F1-score metric is used when the False Negatives and False Positives are crucial. In case of regression models R2 score represents the proportion of variance of dependent variable that has been explained by the independent variables in the model. User needs to keep in mind when each of these metric should be used for computing model quality.
Appendix:
- Source – https://scikit-learn.org/stable/modules/model_evaluation.html
- Metrics Formulas
- Accuracy = (TP + TN) / (TP + TN + FP + FN )
- Precision = (TP) / ( TP + FP )
- Recall = (TP) / (TP + FN)
- balanced_accuracy = ½ * (TP) / (TP + FP) + (TN ) / ( TN + FP )
- f1-score = 2 x (Precision x Recall) / (Precision + Recall)
- neg_mean_squared_error
- neg_mean_absolute_error
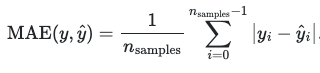
- neg_mean_squared_log_error
- neg_median_absolute_error