Database Management on Oracle Cloud Infrastructure (OCI) continues to evolve, enabling MySQL users to gain deeper visibility and manage their HeatWave and on-premises (External) MySQL DB systems. In our previous blogs, we introduced how Database Management supports monitoring for both HeatWave and External MySQL DB systems.
We’re now expanding its capabilities with a new set of enhanced monitoring features – designed to reduce operational burden on DBAs and developers, strengthen observability, and support high availability across modern MySQL deployments.
Monitoring Models
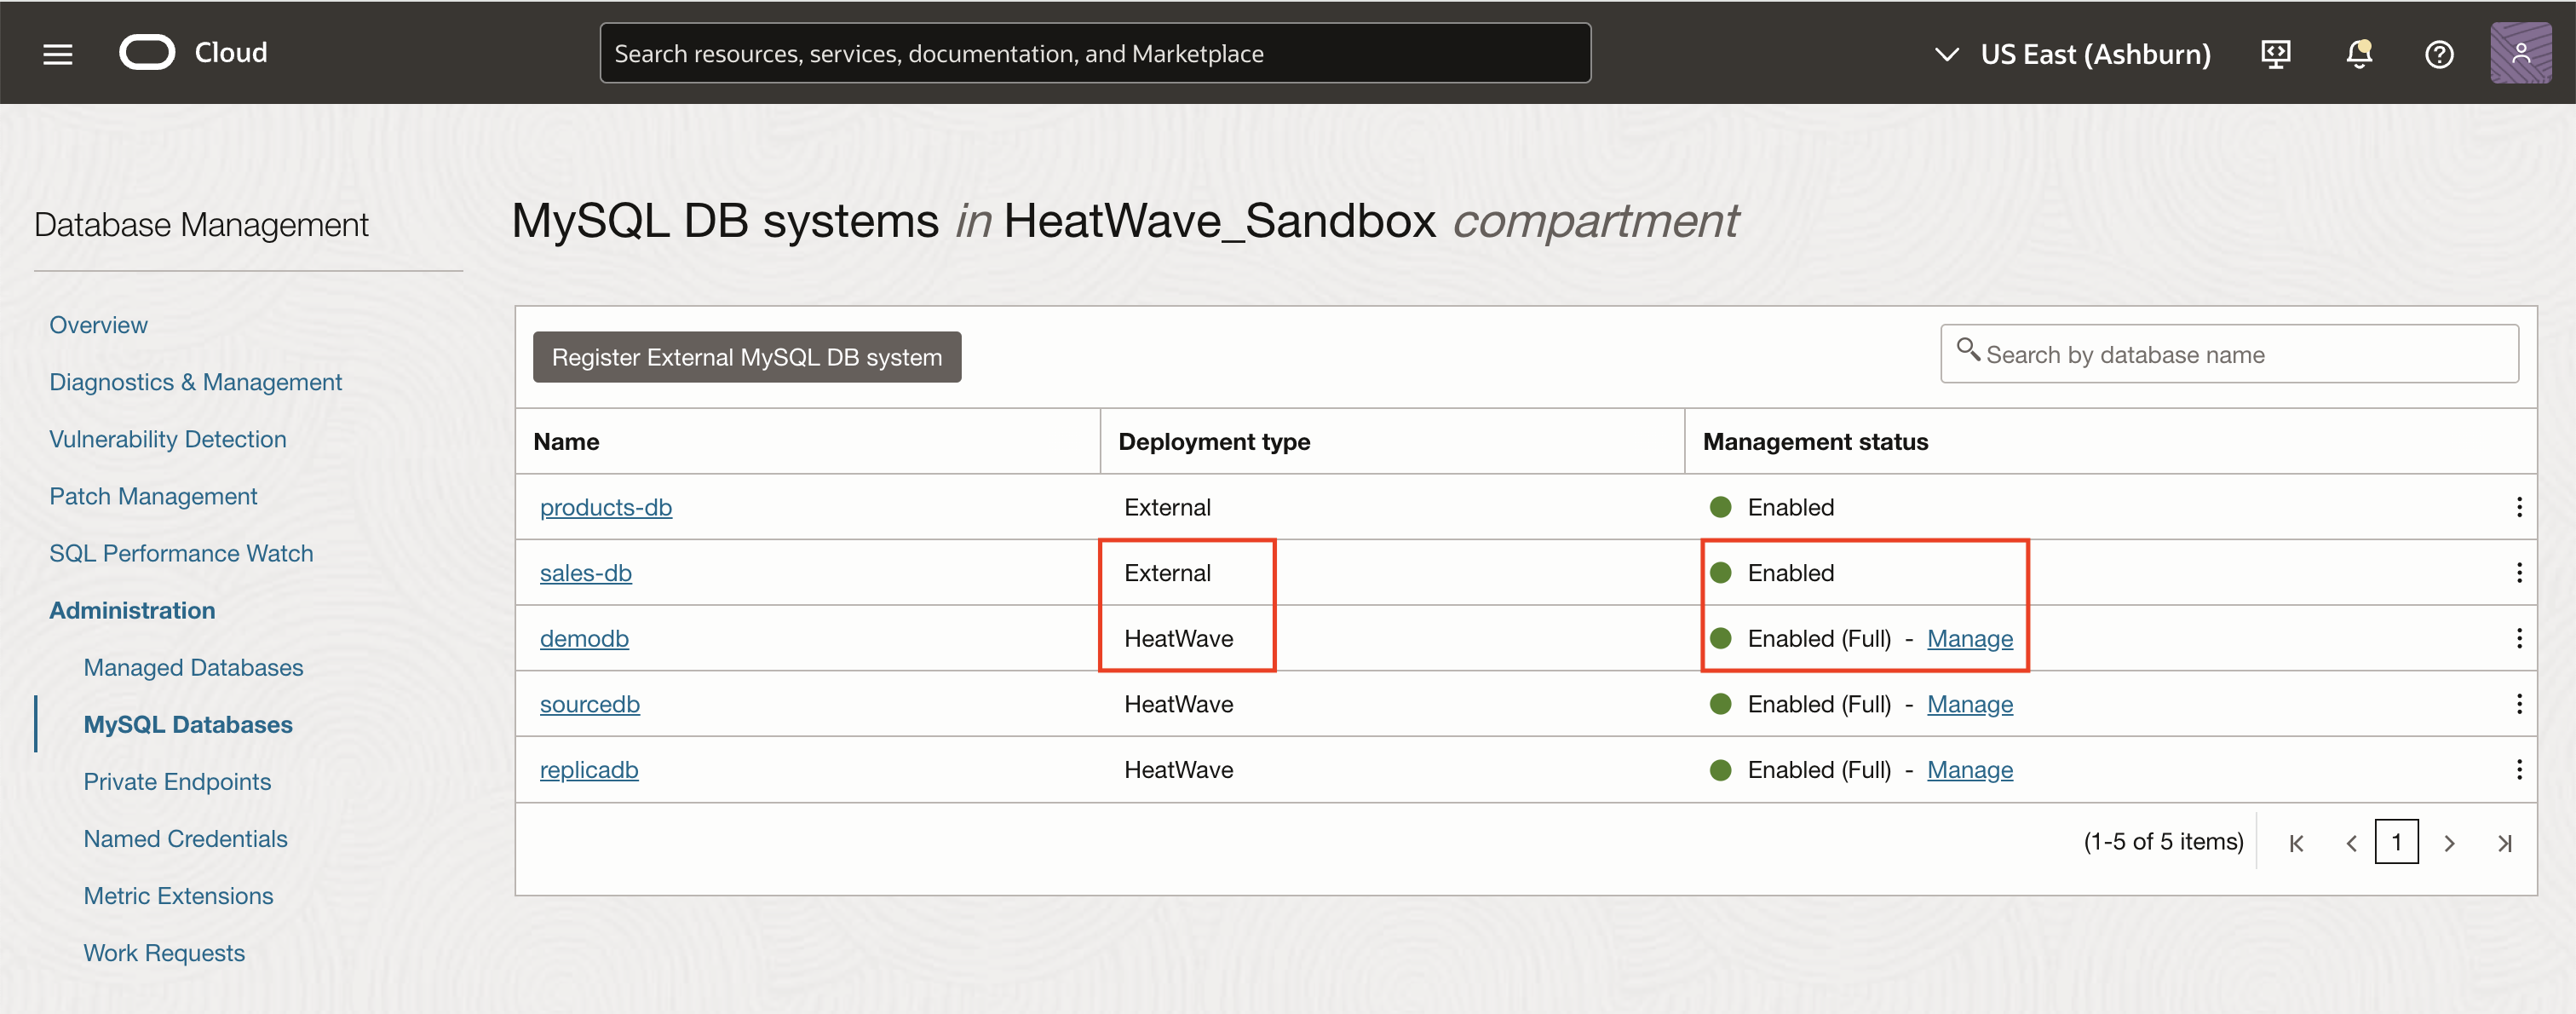
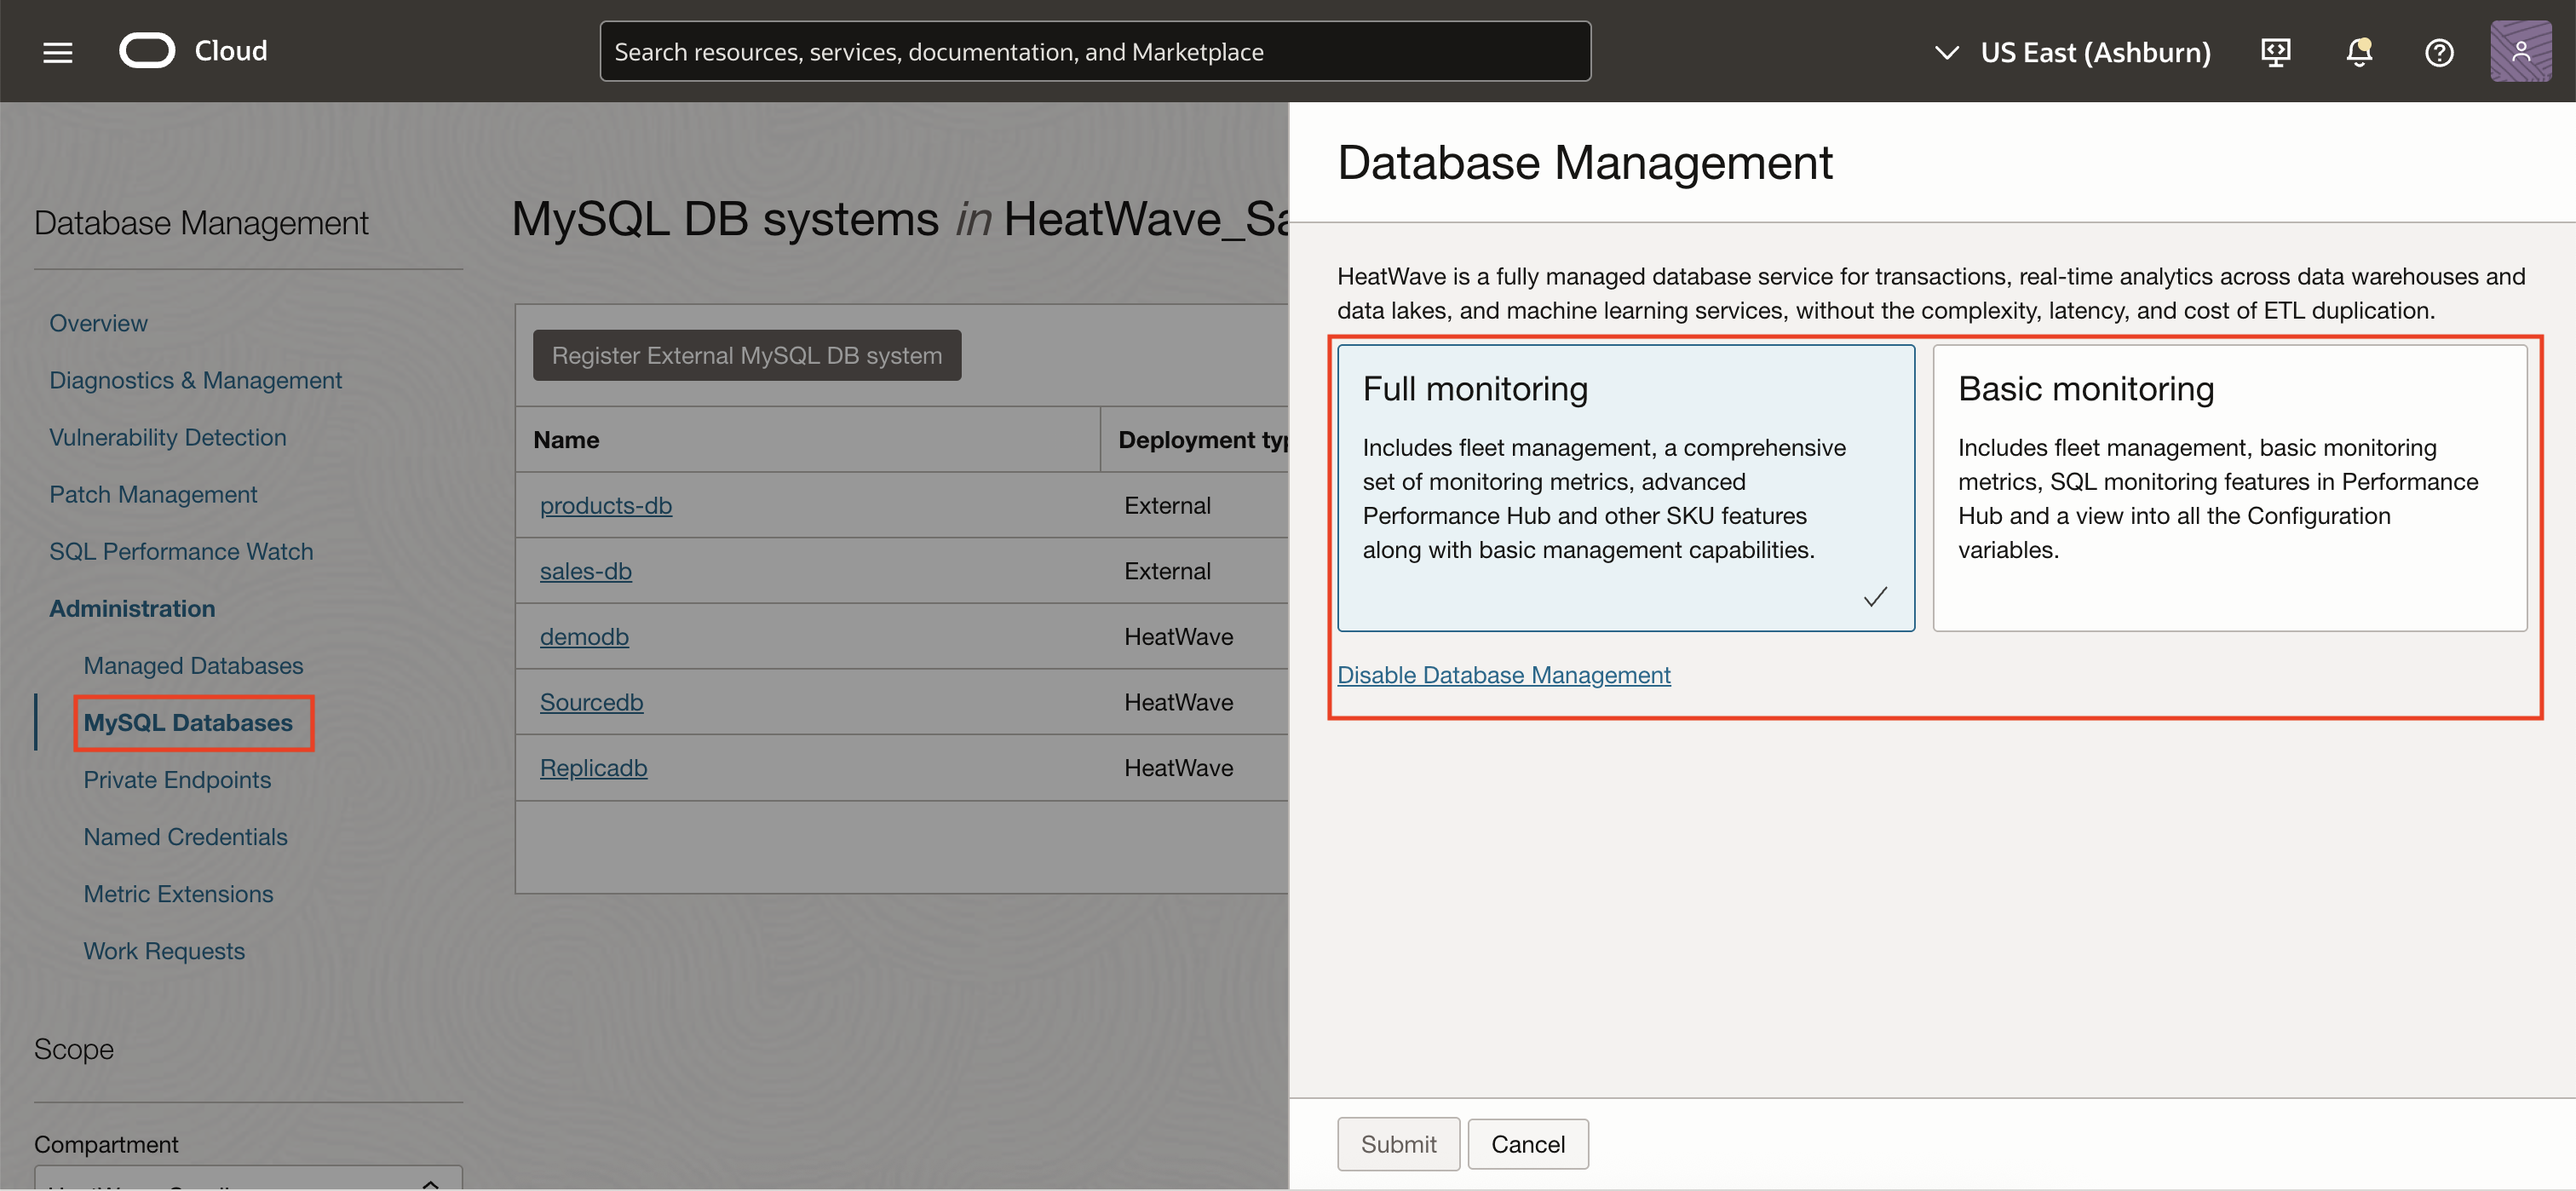
OCI Database Management for MySQL now offers two distinct monitoring models for HeatWave DB systems: Basic Monitoring and Full Monitoring.
When Database Management is enabled for a HeatWave DB system, Basic Monitoring is included by default at no additional cost. It provides a core set of metrics, essential SQL monitoring in Performance Hub, and fleet-level visibility.
Full Monitoring is available at an additional cost for more comprehensive monitoring needs. It enables in-depth SQL diagnostics, replication monitoring, extended system metrics, and comprehensive performance metrics.
For External MySQL DB systems, all Database Management features – both Basic and Full – are included by default through a non-metered subscription.
Note: For HeatWave DB systems configured with High Availability, Database Management monitors only the primary instance and any attached HeatWave cluster. For External MySQL DB systems, metrics are collected only from the specific MySQL DB system registered with Database Management.
MySQL Replication Monitoring
MySQL Replication monitoring plays a crucial role in maintaining data consistency, troubleshooting replication issues, and ensuring seamless failover across environments. Database Management now supports comprehensive replication monitoring for both HeatWave DB systems that are enabled with the Full monitoring option and External MySQL DB systems. Monitoring replication ensures that your topology is functioning correctly, helps in diagnosing delays or failures, and gives control to manage increasingly complex deployments.
Understanding MySQL Replication types:
- Asynchronous Replication: Traditional MySQL replication, which enables data from one MySQL server, which is known as a source, to be copied to one or more MySQL servers known as replicas. Replication is asynchronous by default; replicas need not be connected permanently to receive updates from a source.
- Group Replication: High Availability solution that enables a set of MySQL servers to function as a cohesive group, ensuring data consistency and fault tolerance. Each MySQL server maintains a complete copy of the data, and communicates with other group members through message passing. The communication layer provides a set of guarantees such as atomic message and total order message delivery.
Asynchronous replication can be configured to establish pathways for data transfer in the following ways:
- Inbound Replication: Inbound replication uses a replication channel configured in the MySQL DB system (HeatWave or External) to copy transactions from another MySQL source into the target DB system.
- Outbound Replication: Outbound replication uses a replication channel to copy transactions from a MySQL DB system (HeatWave or External) to another MySQL source.
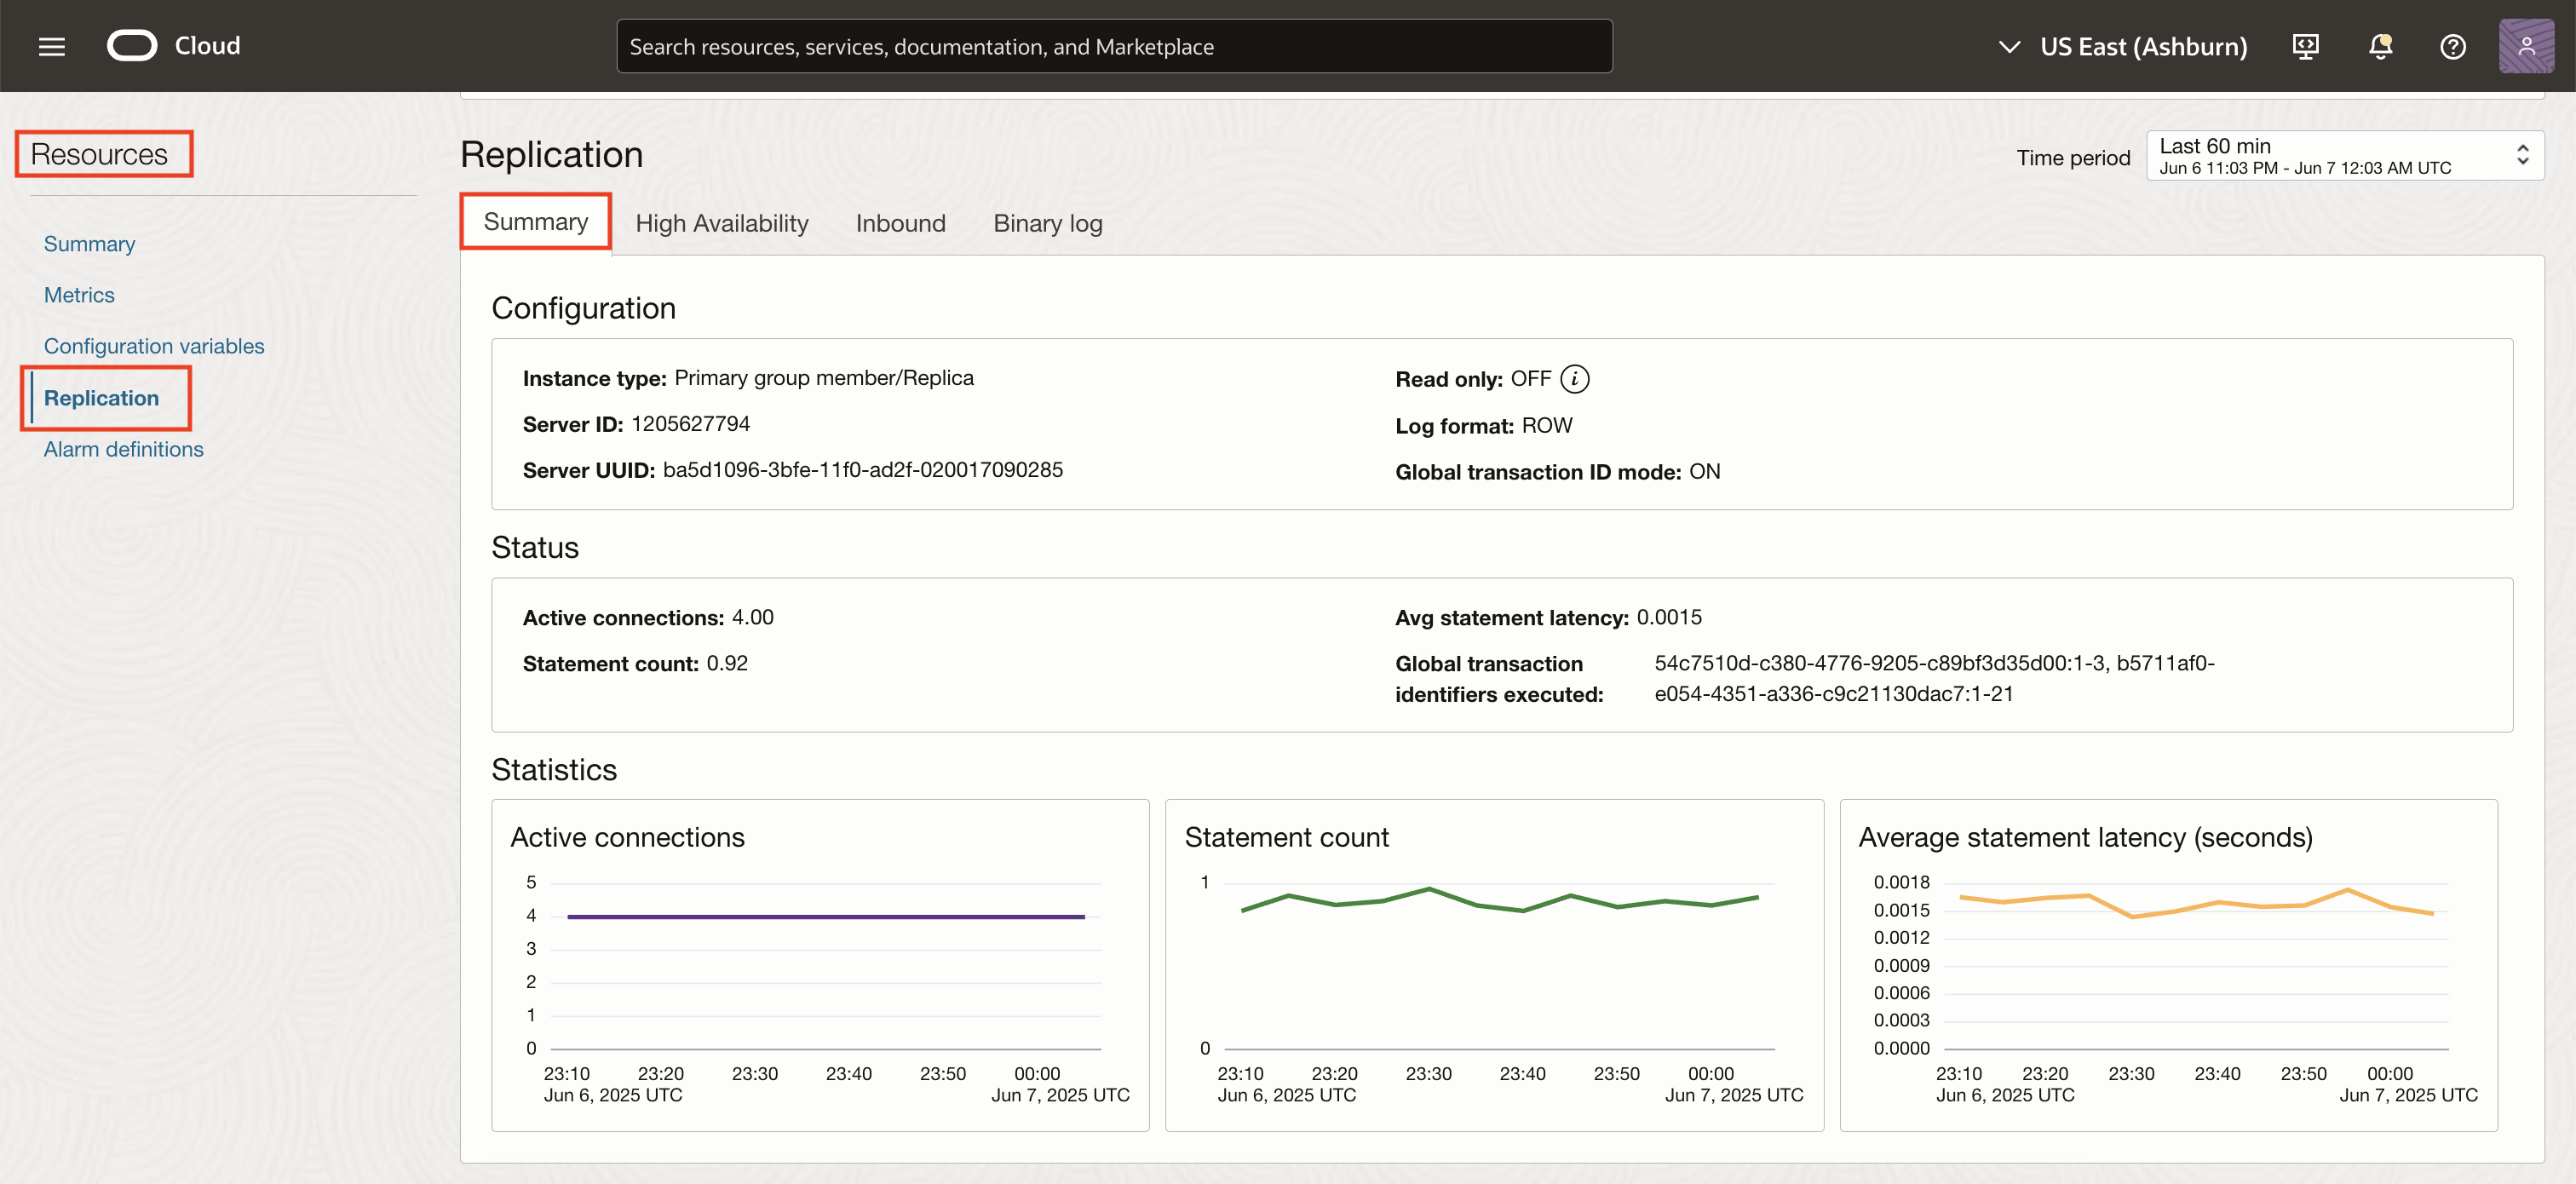
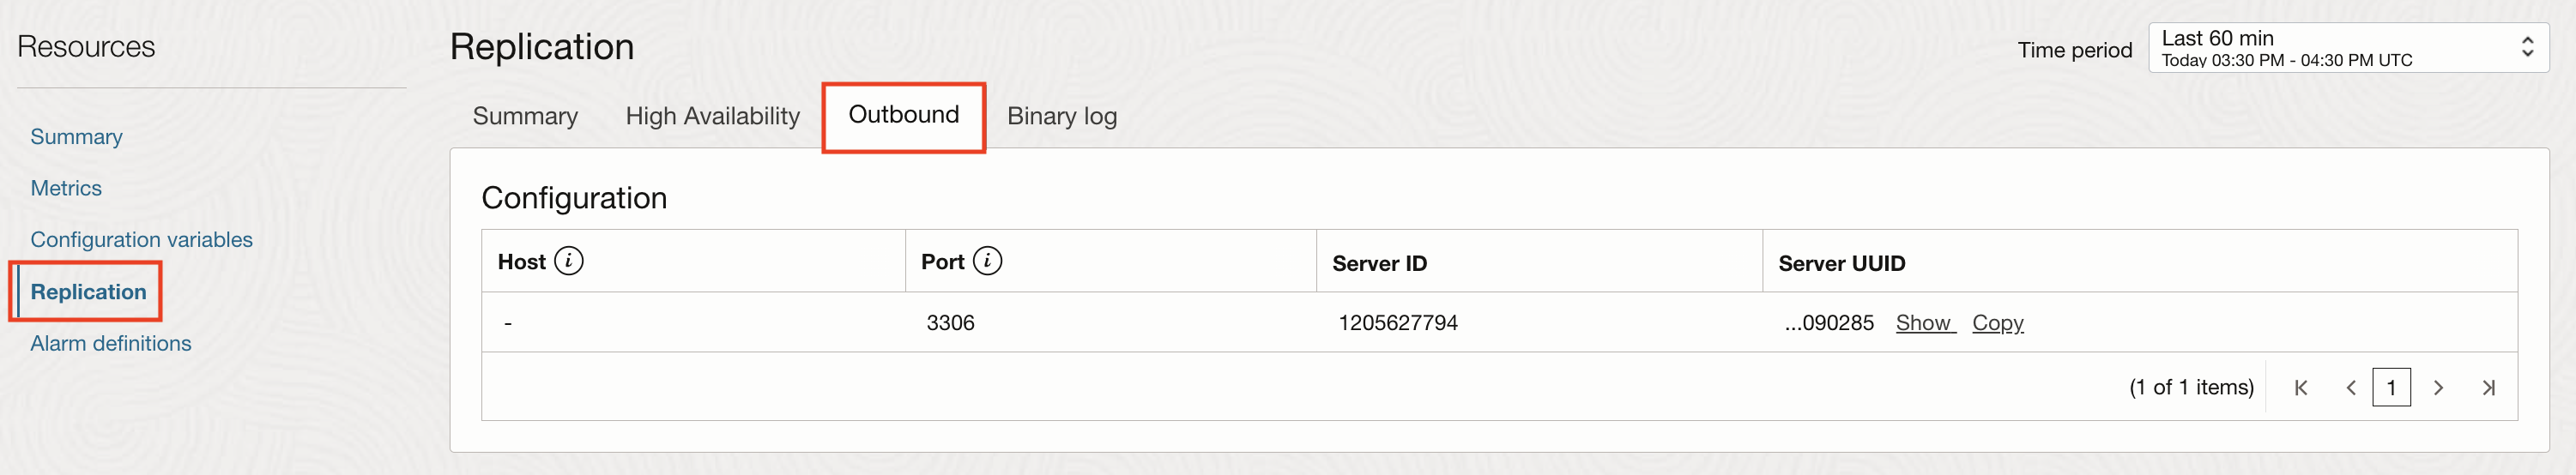
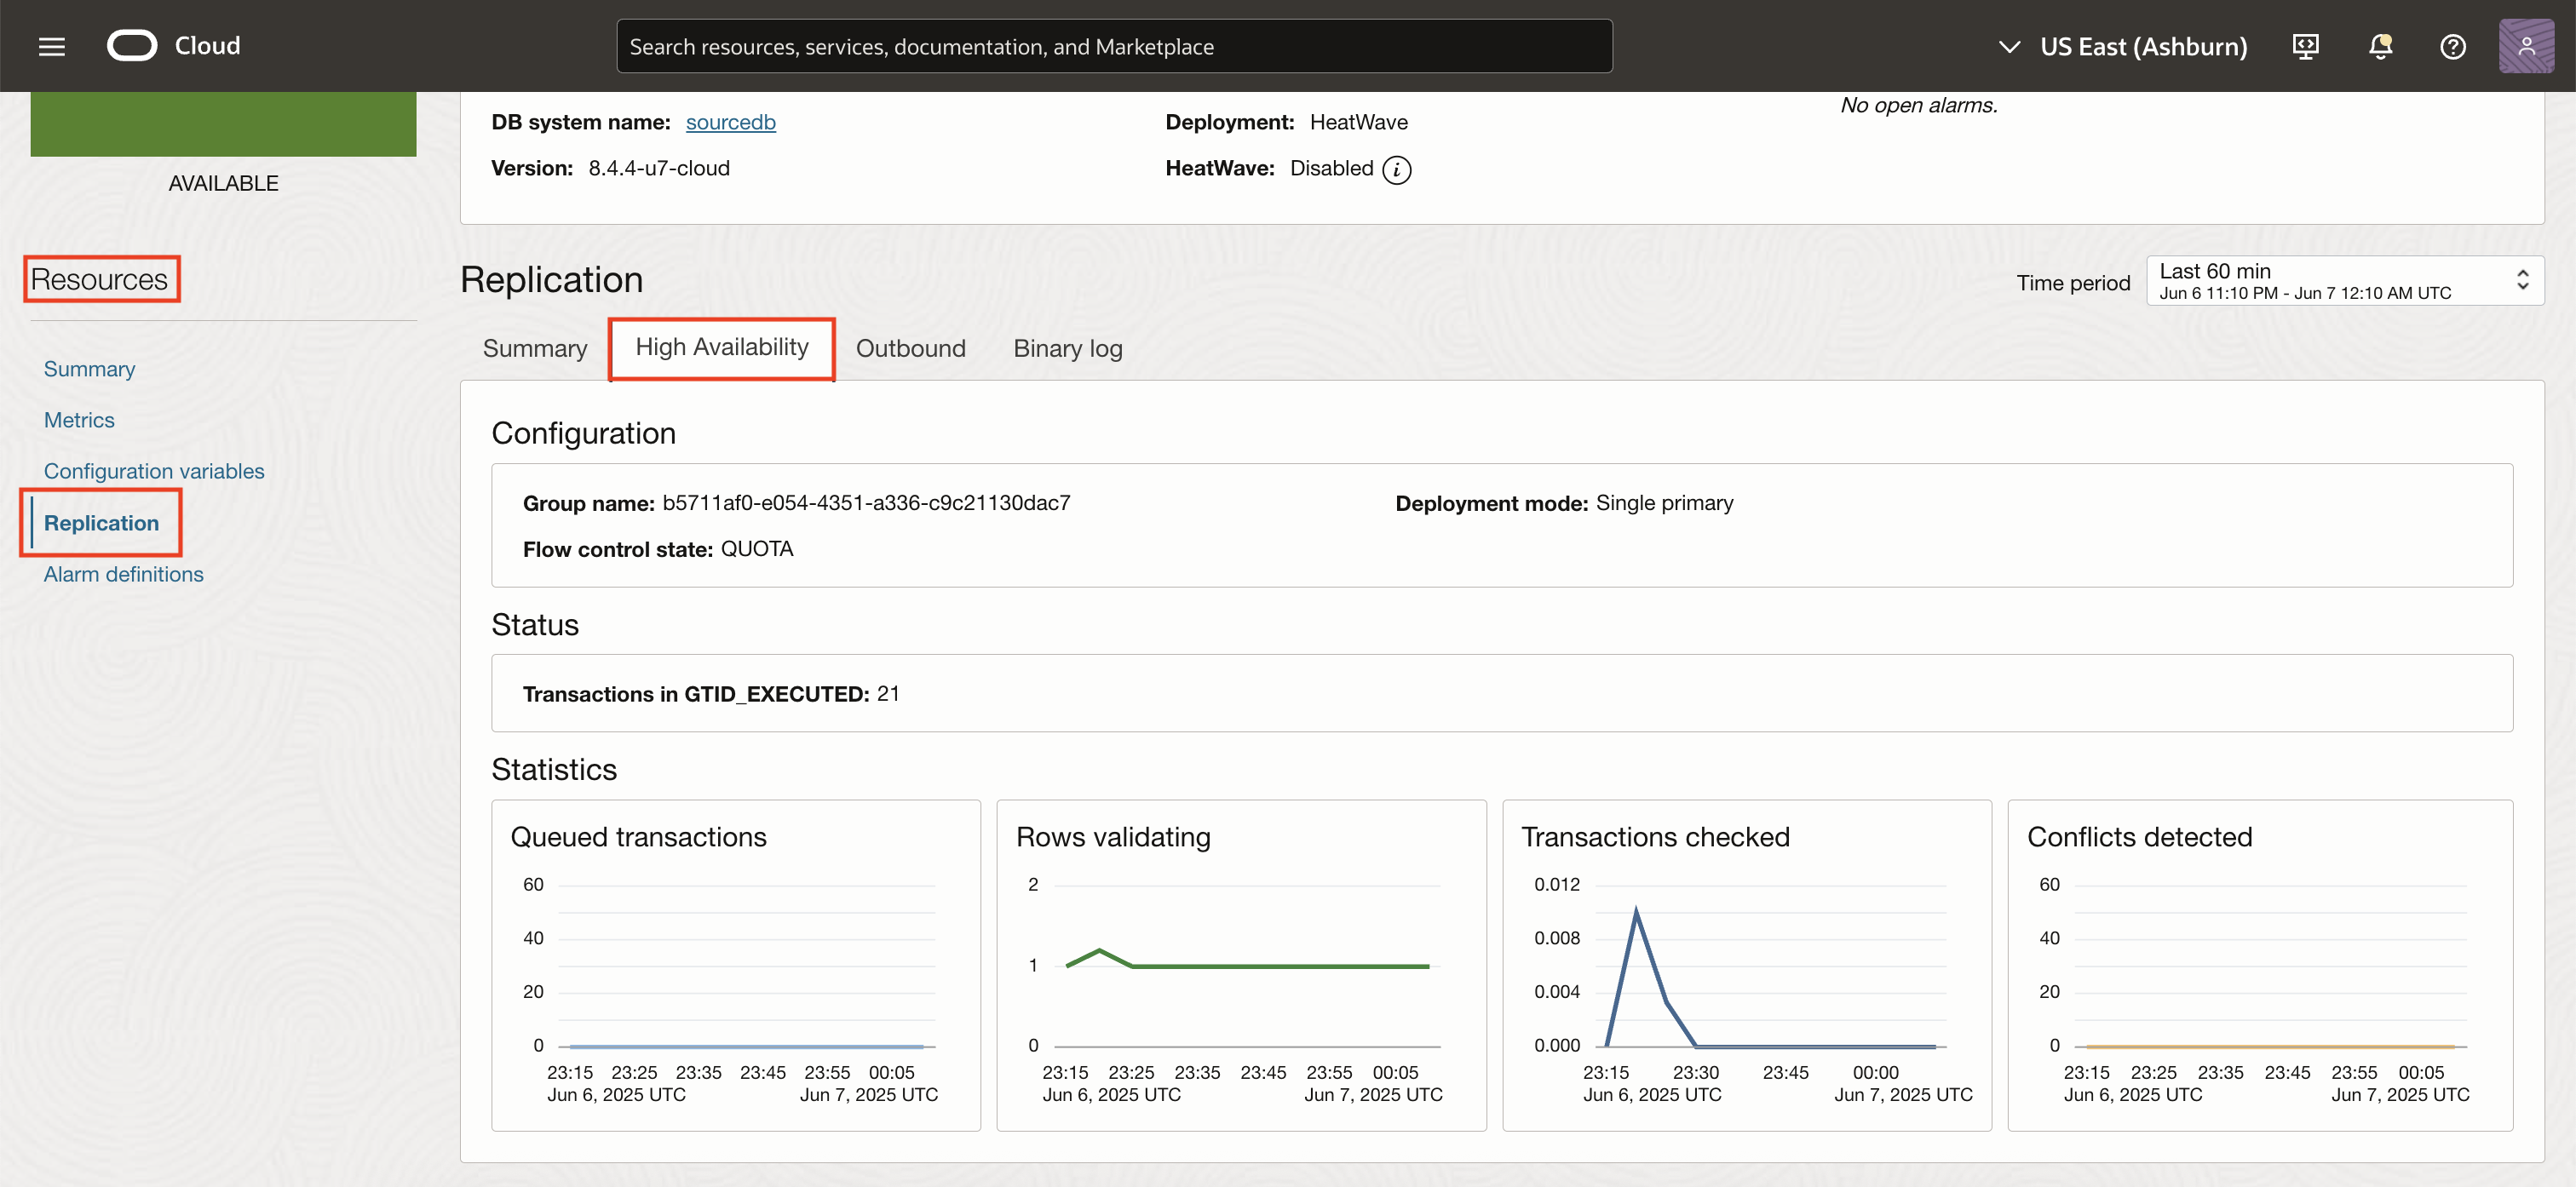
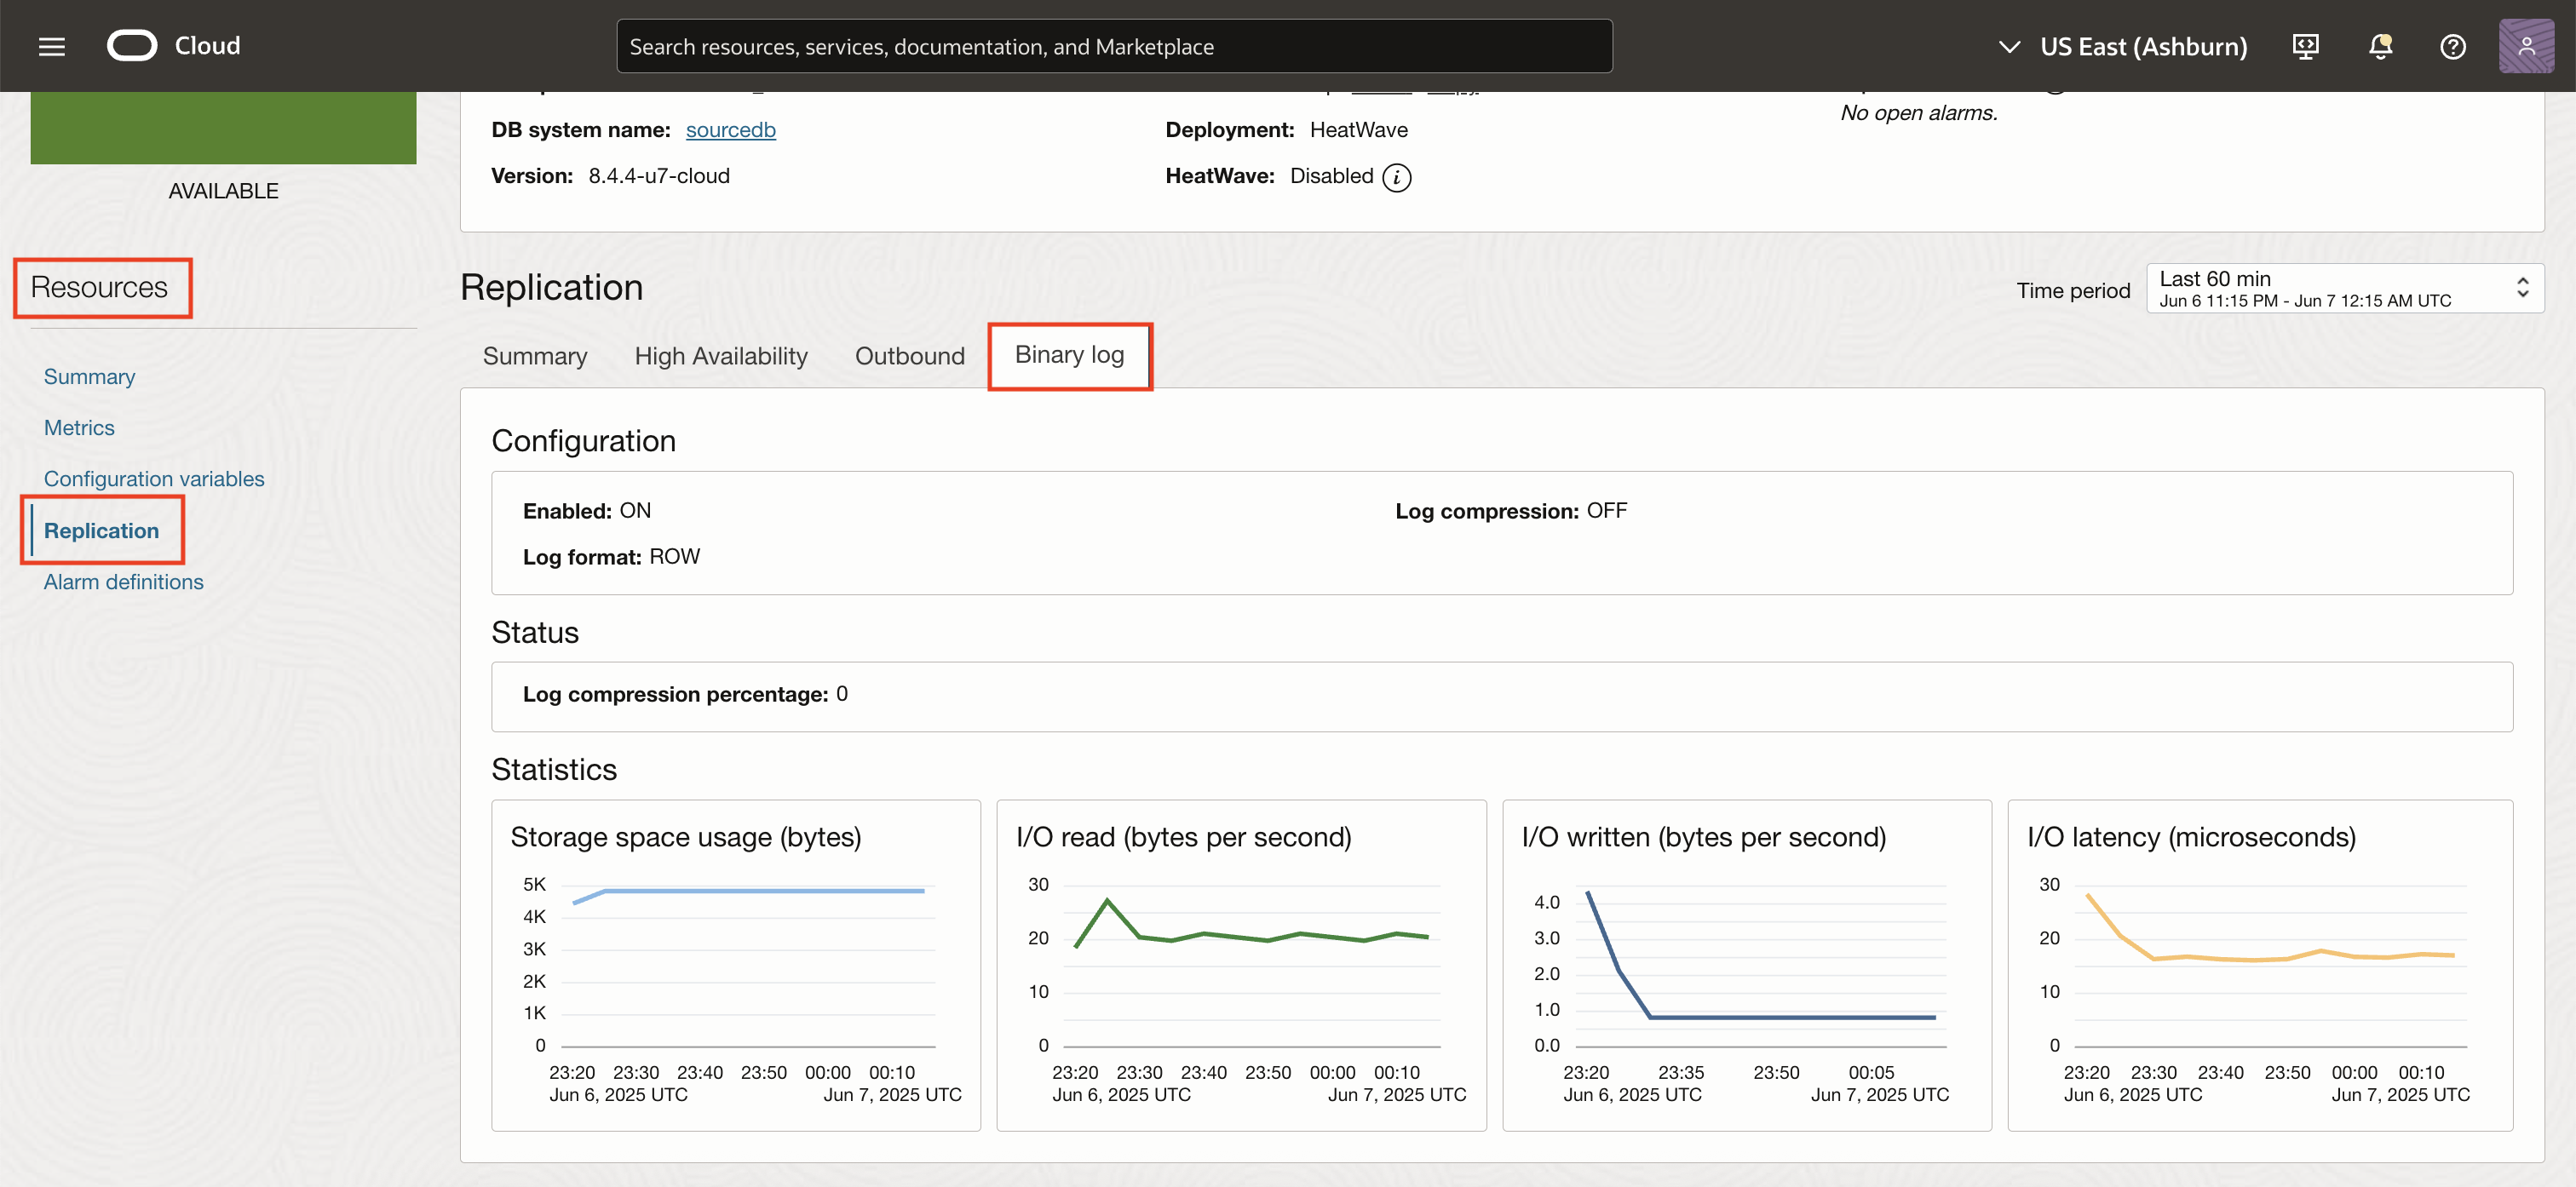
In the Replication section, you can monitor replication configuration information and metrics on the following tabs:
Summary: Displays configuration parameters and key metrics for the MySQL server across the replication topology
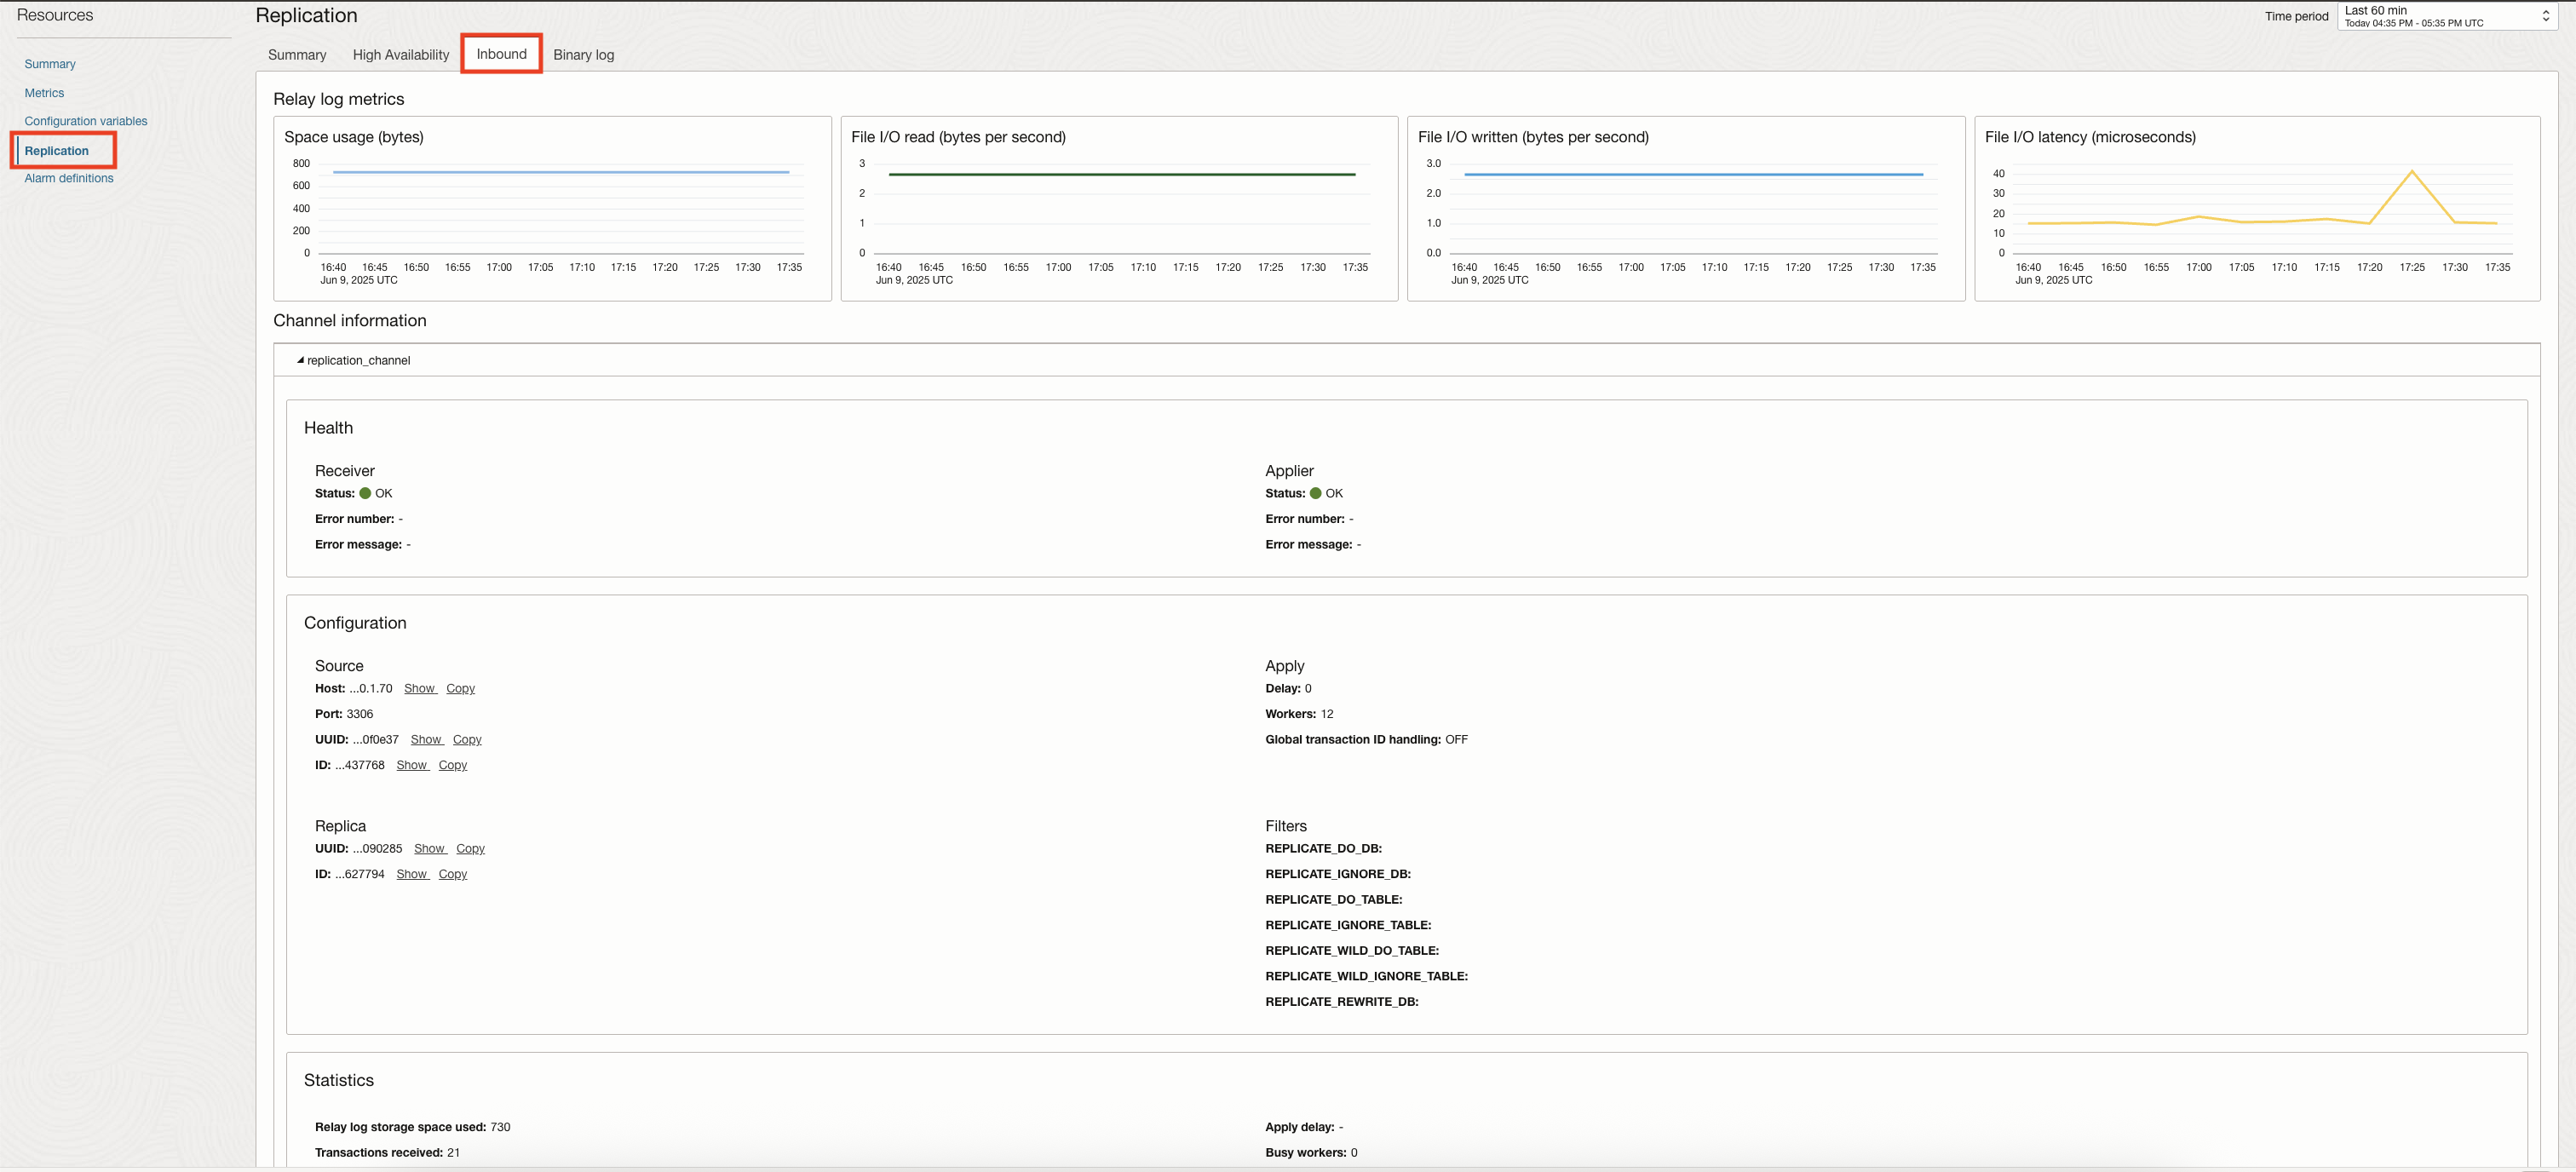
Inbound: Displays inbound replication channel information and metrics if the DB system acts as a replica
Outbound: Displays information pertaining to the replicas if the DB system is configured acts as a source
High Availability: Displays the high availability and disaster recovery configuration parameters, group replication metrics for the MySQL DB system, and group replication members
Binary Log: Displays an overview the binary logging configuration and statistics critical for replication
Note: The Inbound, Outbound, and High availability tabs are visible only when the corresponding replication or high availability configurations are enabled on the DB system.
Performance Hub Enhancements
Performance Hub provides a unified interface to monitor and analyze SQL performance across both HeatWave and External MySQL DB systems, offering deeper visibility into performance issues. It enables you to identify inefficient queries, optimize SQL during development, and continuously monitor and tune queries in production.
Note: The following enhancements are available for HeatWave MySQL DB systems with Full Monitoring enabled and for External MySQL DB systems.
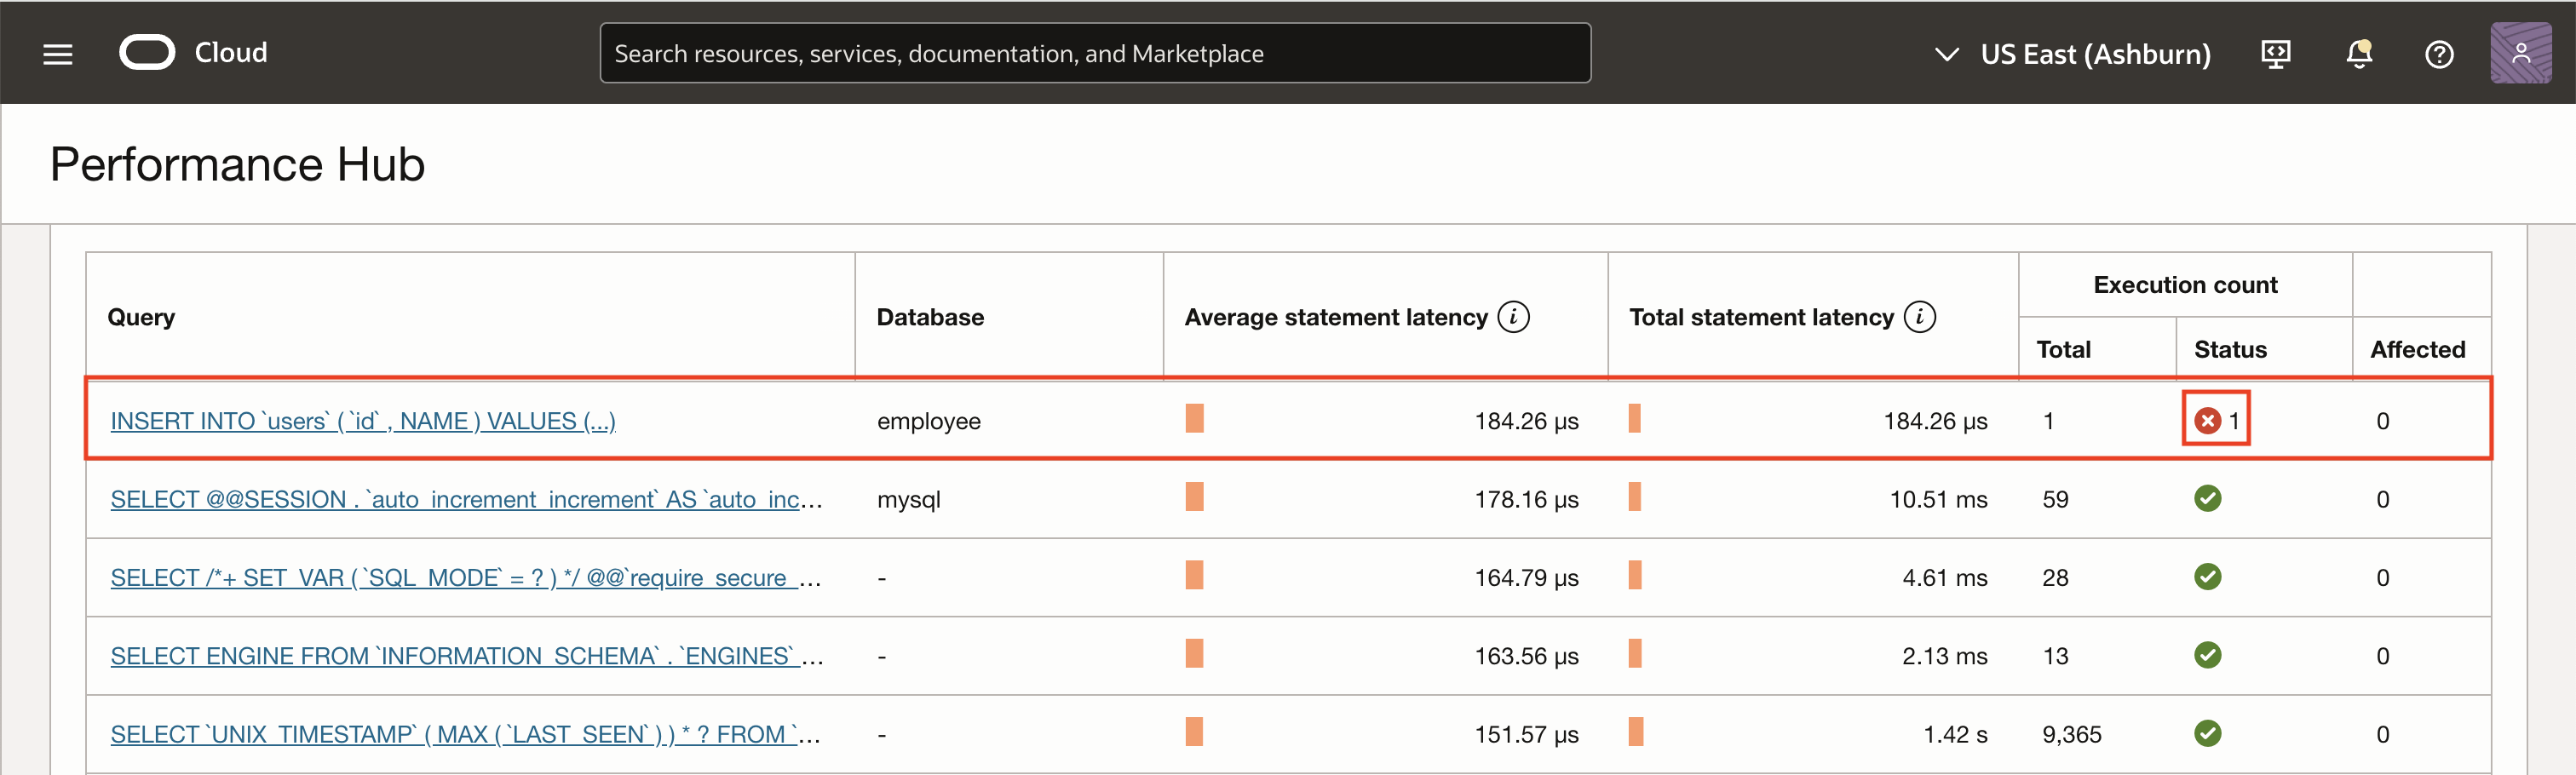
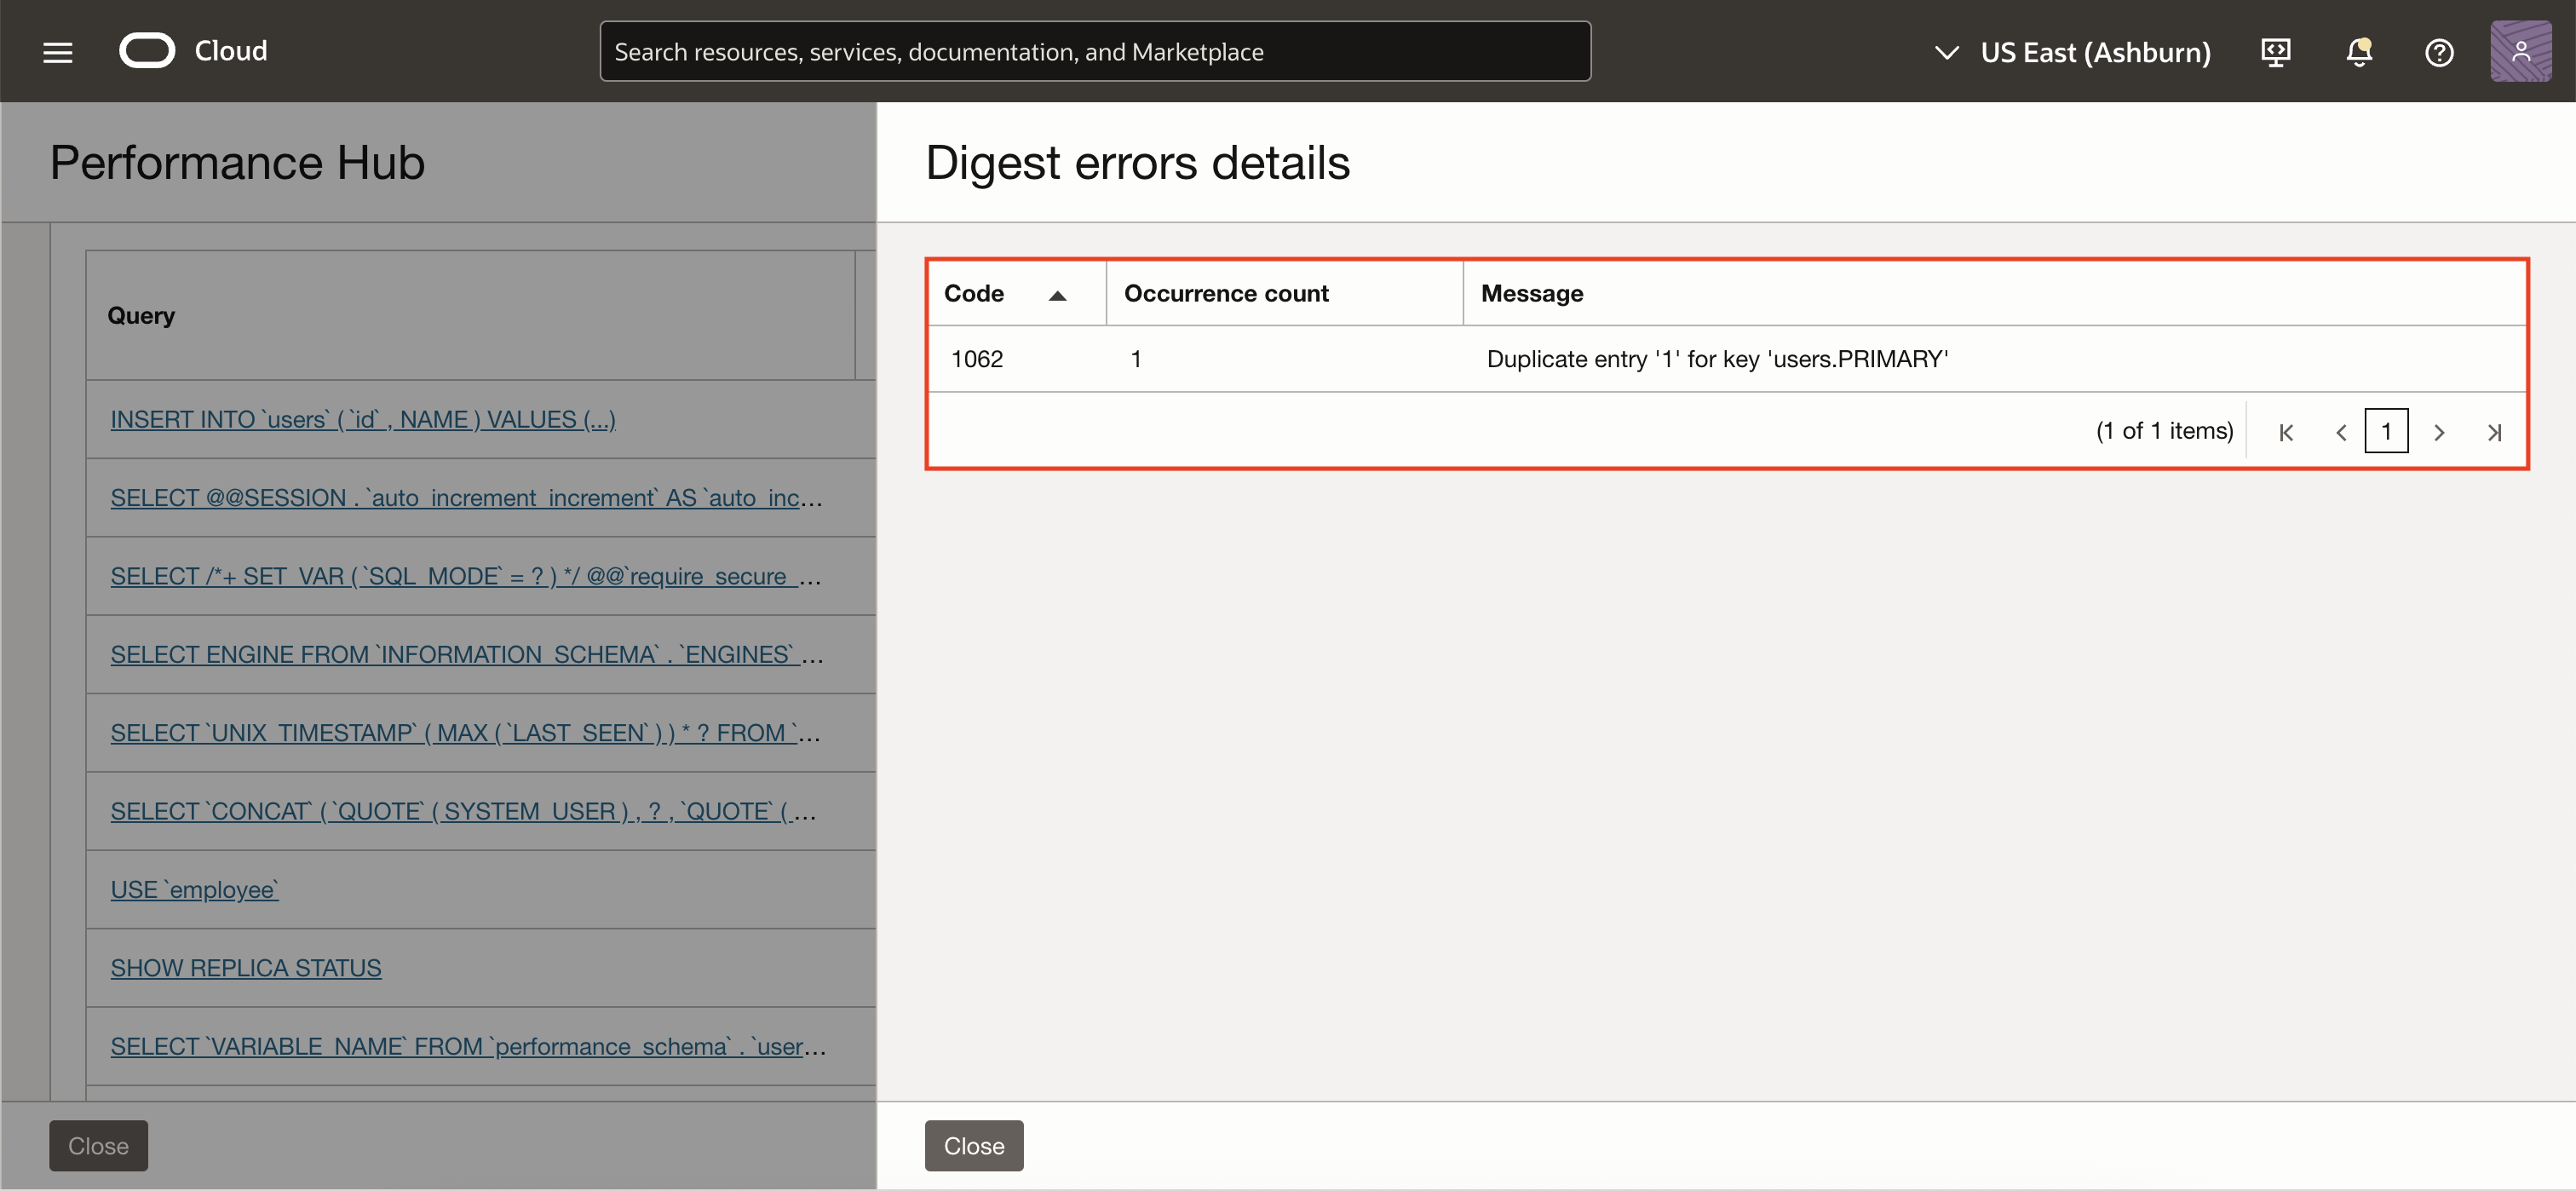
- Each SQL statement includes an execution status along with immediate access to error details, making it easier to identify and troubleshoot problematic statements.
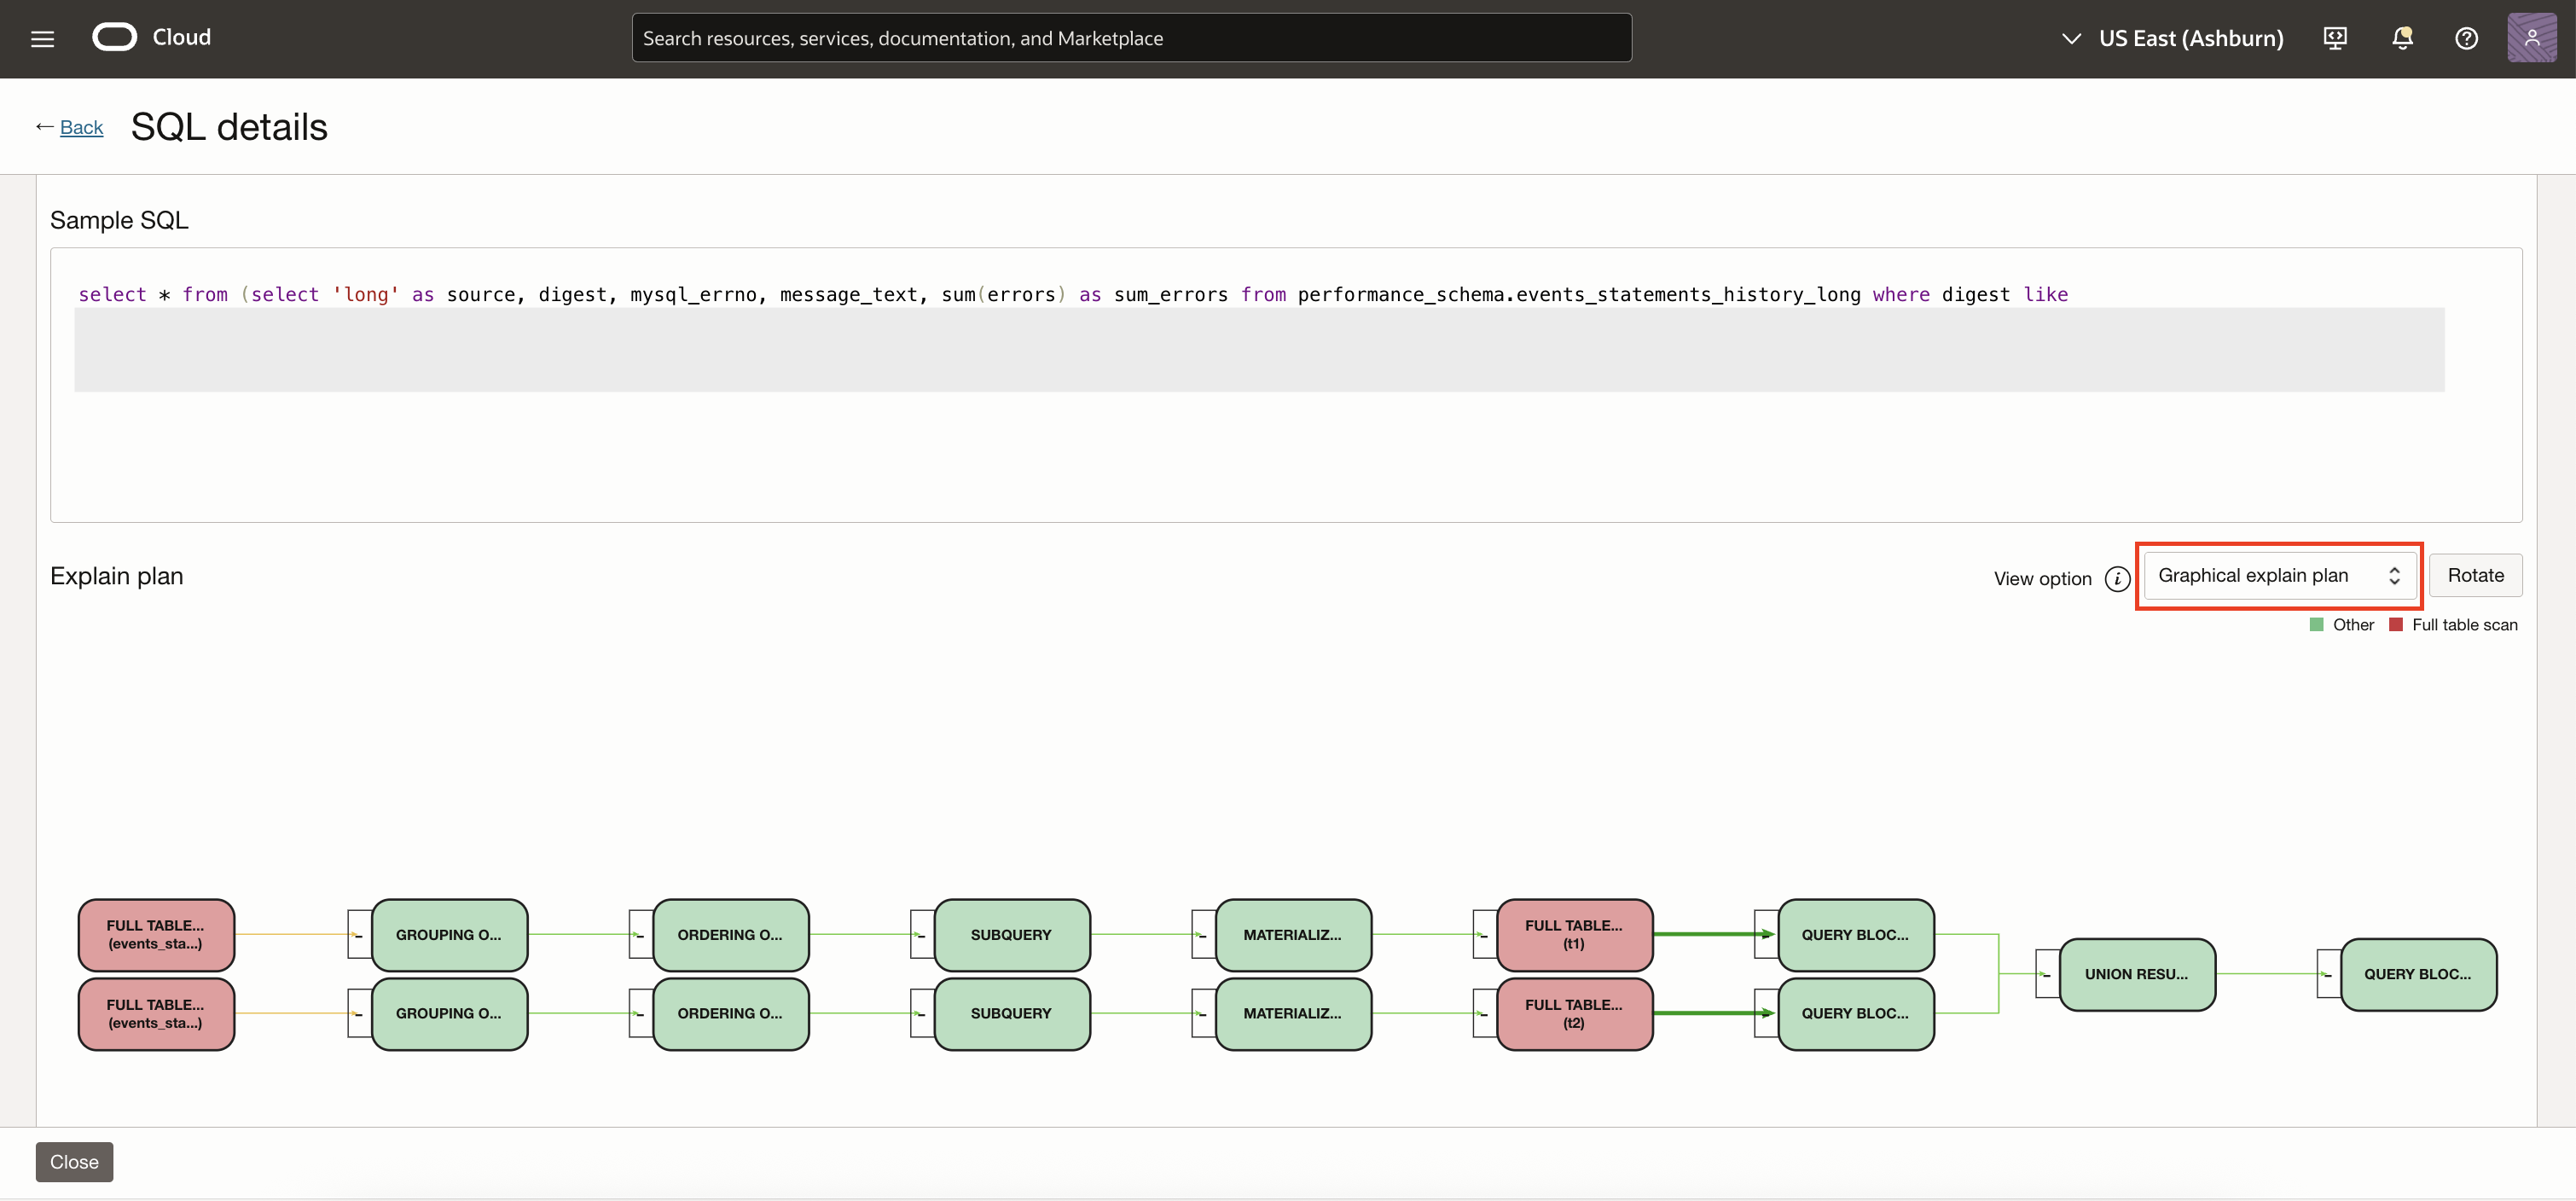
- The built-in Explain Plan outlines the execution path including access methods, join operations, and estimated row counts. For a more intuitive view, the Graphical Explain Plan presents the execution flow as an interactive tree, helping users quickly detect performance bottlenecks such as full table scans or inefficient joins and optimize your queries.
With these enhancements, Performance Hub becomes a critical tool for improving query performance and reducing time spent on diagnostics.
Visualizing Metrics: Basic to Enhanced Monitoring for HeatWave and External MySQL DB Systems
OCI Database Management provides two levels of monitoring for MySQL DB systems – Basic Monitoring and Full Monitoring offering different levels of visibility through metric charts.
Note: For External MySQL DB systems, the metric charts listed under both the sections Basic Monitoring Metrics and Full Monitoring Metrics are available.
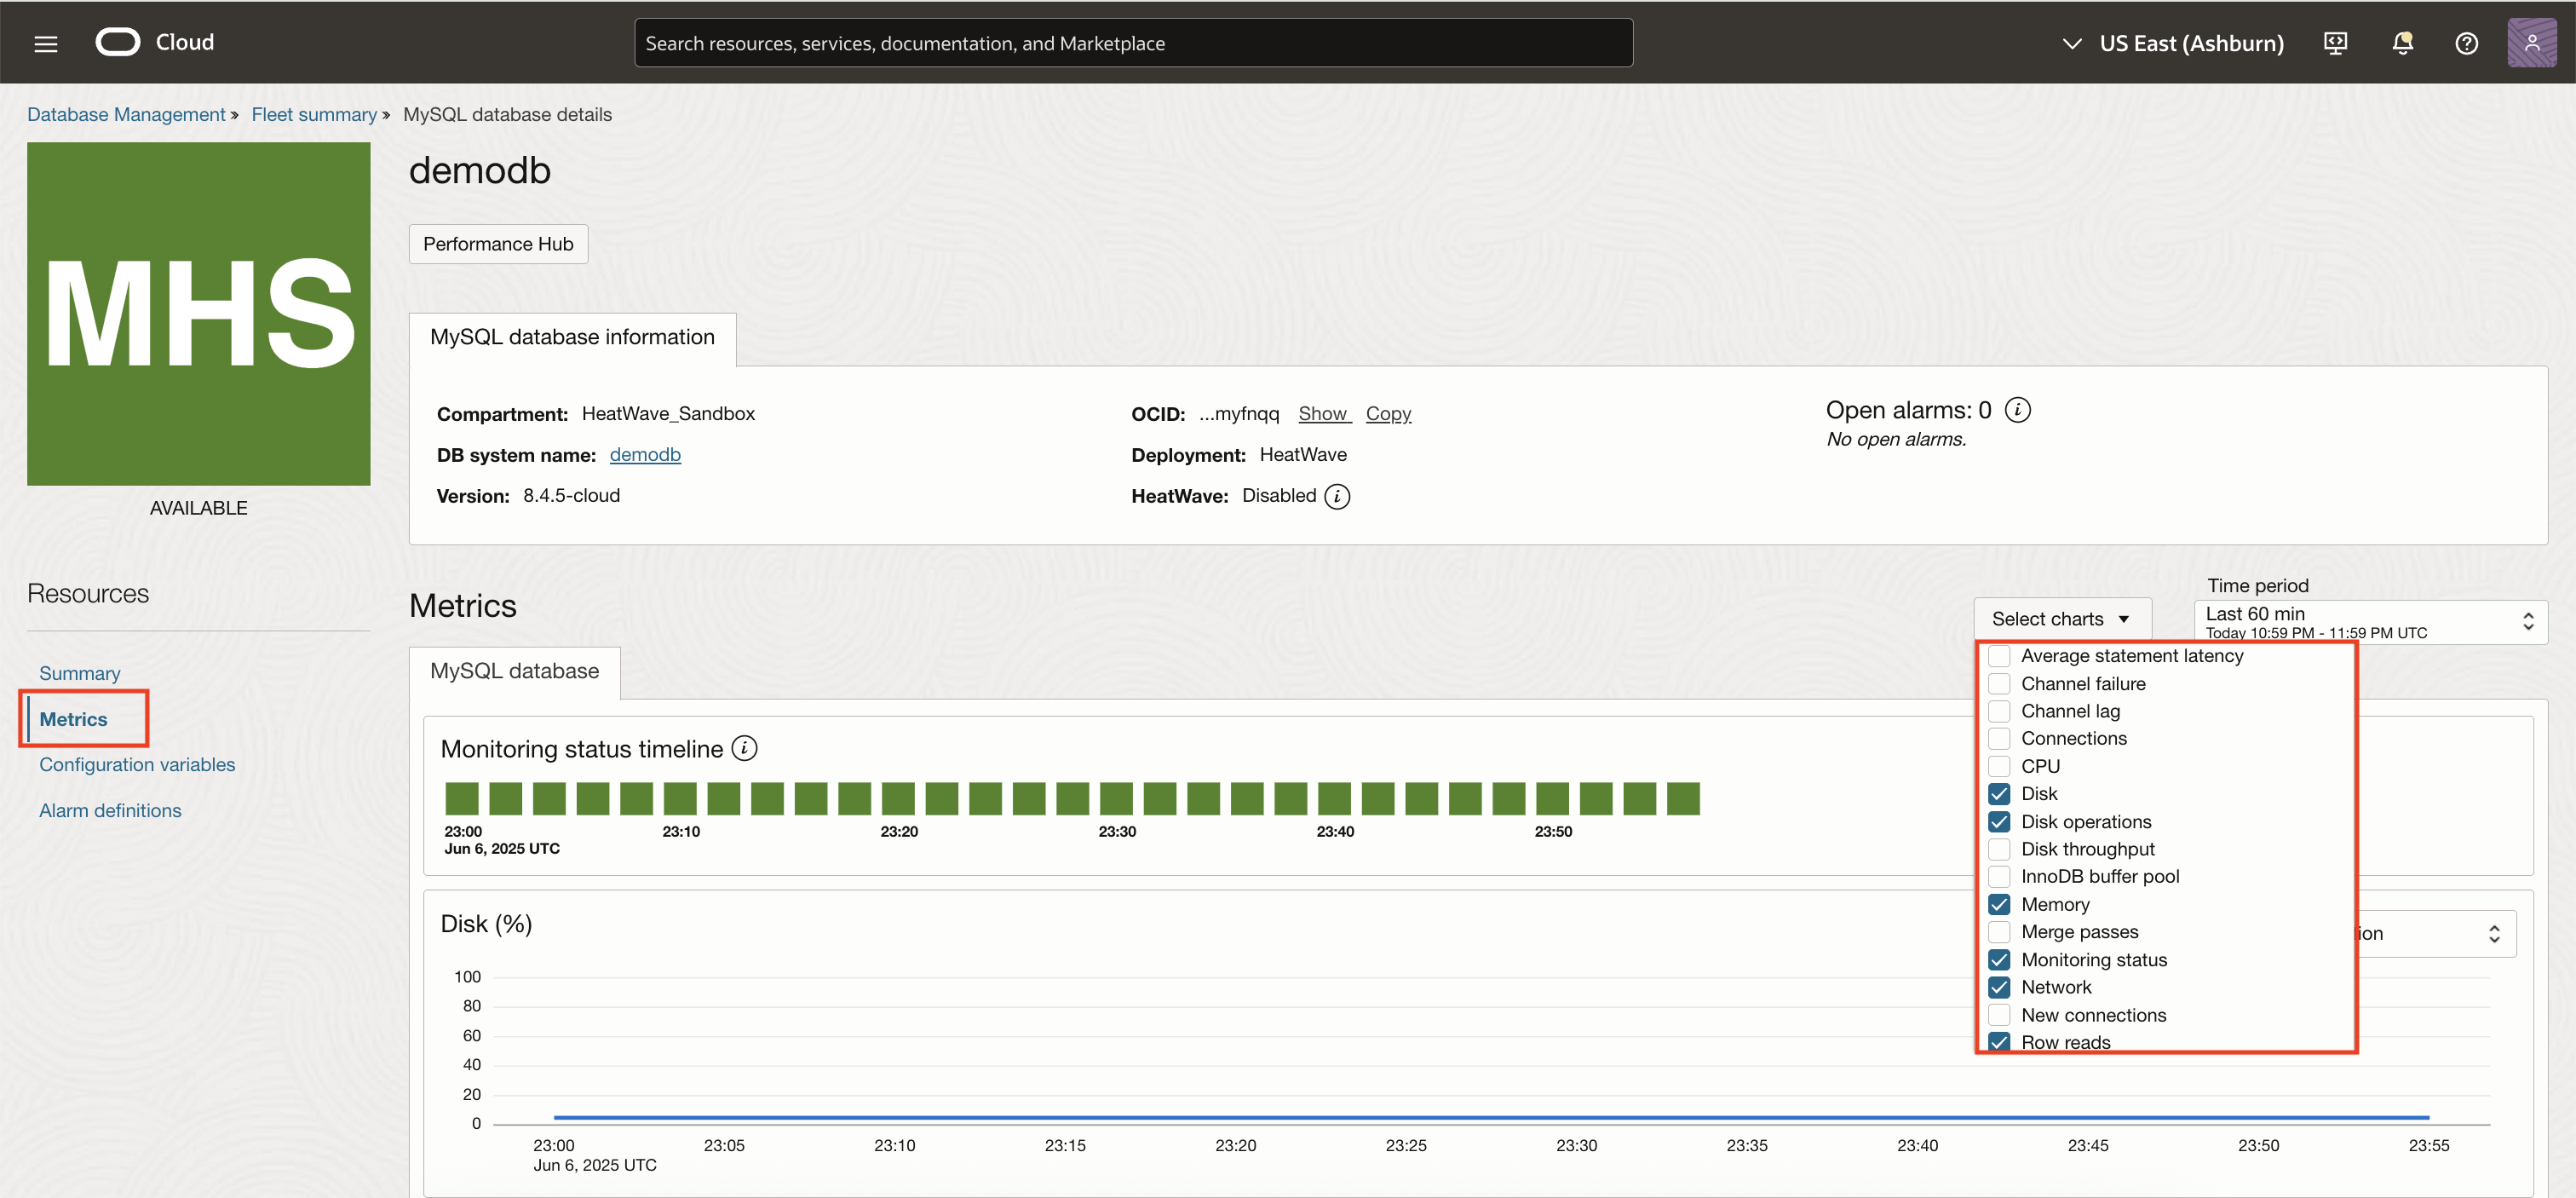
Basic Monitoring Metric Charts (for HeatWave and External DB systems)
- Average statement latency (seconds)
- CPU and memory usage
- Disk space usage and I/O throughput
- InnoDB buffer pool usage
- Connection Statistics
- Row reads and writes and other basic metrics
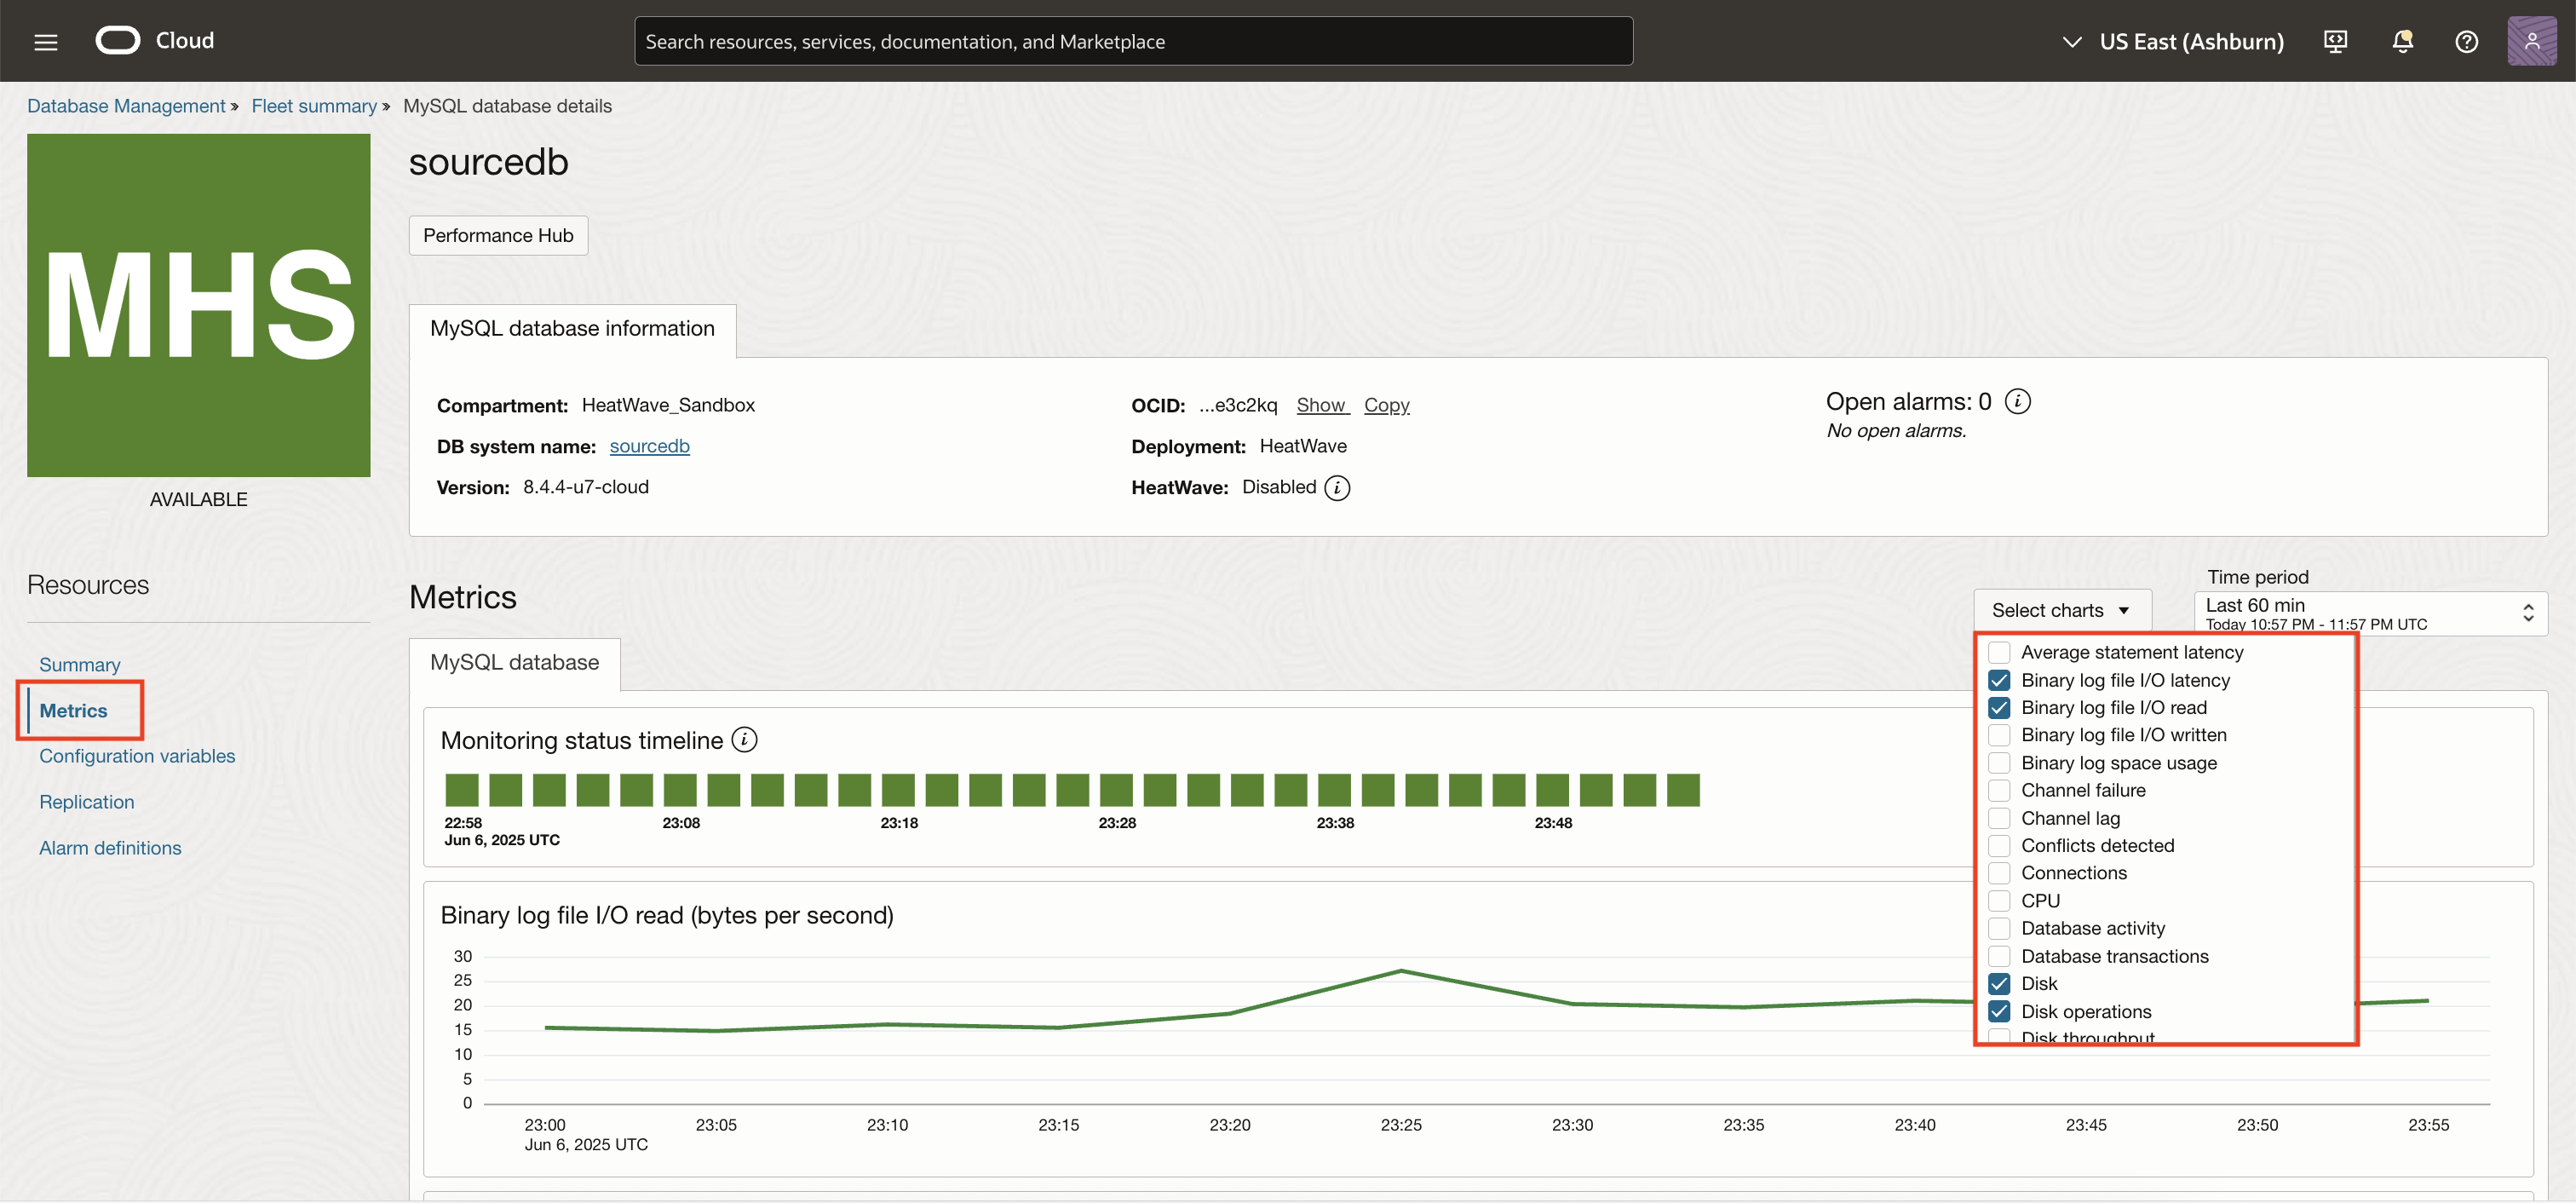
Full Monitoring Metric Charts (for HeatWave DB systems with Database Management enabled with the Full Monitoring option and External MySQL DB systems) provide additional visibility into:
- Binary log file I/O (latency, read/write, space usage)
- Conflicts detection and rows validation
- Replication: lag, GTIDs, queued transactions
- Database activity (statements per second)
- Database transactions (transactions per second)
- Prepared statements (usage and invalidations)
- Transactions checked
These metrics help proactively manage database health, activity, performance, and replication behavior of your MySQL deployments.
For additional information on metrics, see the HeatWave metrics documentation, and the External MySQL DB systems.
Conclusion
With the introduction of Full Monitoring, replication visibility, and Performance Hub enhancements, organizations can now benefit from a cloud-native platform designed to simplify diagnostics, reduce down time, and improve operational efficiency.
Whether managing MySQL on OCI’s HeatWave or external deployments, OCI DBM provides an integrated solution built to simplify operations and accelerate diagnostics backed by Oracle’s enterprise-grade cloud infrastructure. For External MySQL DB systems, Database Management supports version 8.x and later. Currently, only Linux-based External MySQL DB systems are supported.
Get started today!
You can begin exploring these features today in the Database Management under the Observability and Management menu in the Oracle Cloud Infrastructure Console.
To learn more about enabling monitoring for HeatWave and External MySQL DB systems, refer to the official documentation.
Ready to take the next step? Try it out and experience the power of advanced MySQL Monitoring with DBM.
Resources
- Prerequisites for managing on-premises MySQL DB systems in OCI
- Manage External MySQL DB systems in OCI
- Documentation
- Videos