We’re pleased to share the general availability of Oracle Cloud Infrastructure (OCI) Database Management for the MySQL Heatwave service on OCI!
Oracle has been a leader in Database Management for decades, and now these unique capabilities are available in Oracle Cloud. This new MySQL monitoring capability in the Database Management service brings the best of Oracle’s industry-leading capabilities from MySQL Enterprise Monitor (MEM) and Enterprise Manager into Oracle Cloud.
Database Management is designed to help prevent potential outages in your key applications by providing performance diagnostics capabilities that simplify diagnosing performance issues for administrators and ensure quicker resolution of performance bottlenecks. The service also provides advanced performance management capabilities to proactively detect and identify the root cause of SQL performance issues.
Database Management service feature summary
- Unified user interface to monitor multiple databases including MySQL and Oracle Databases deployed and managed within OCI
- Enhanced ability to proactively detect and identify the root cause of performance issues across a fleet of databases
- Overview of the performance alerts for a specific database
- Functionality to proactively detect and identify the root cause of SQL performance issues
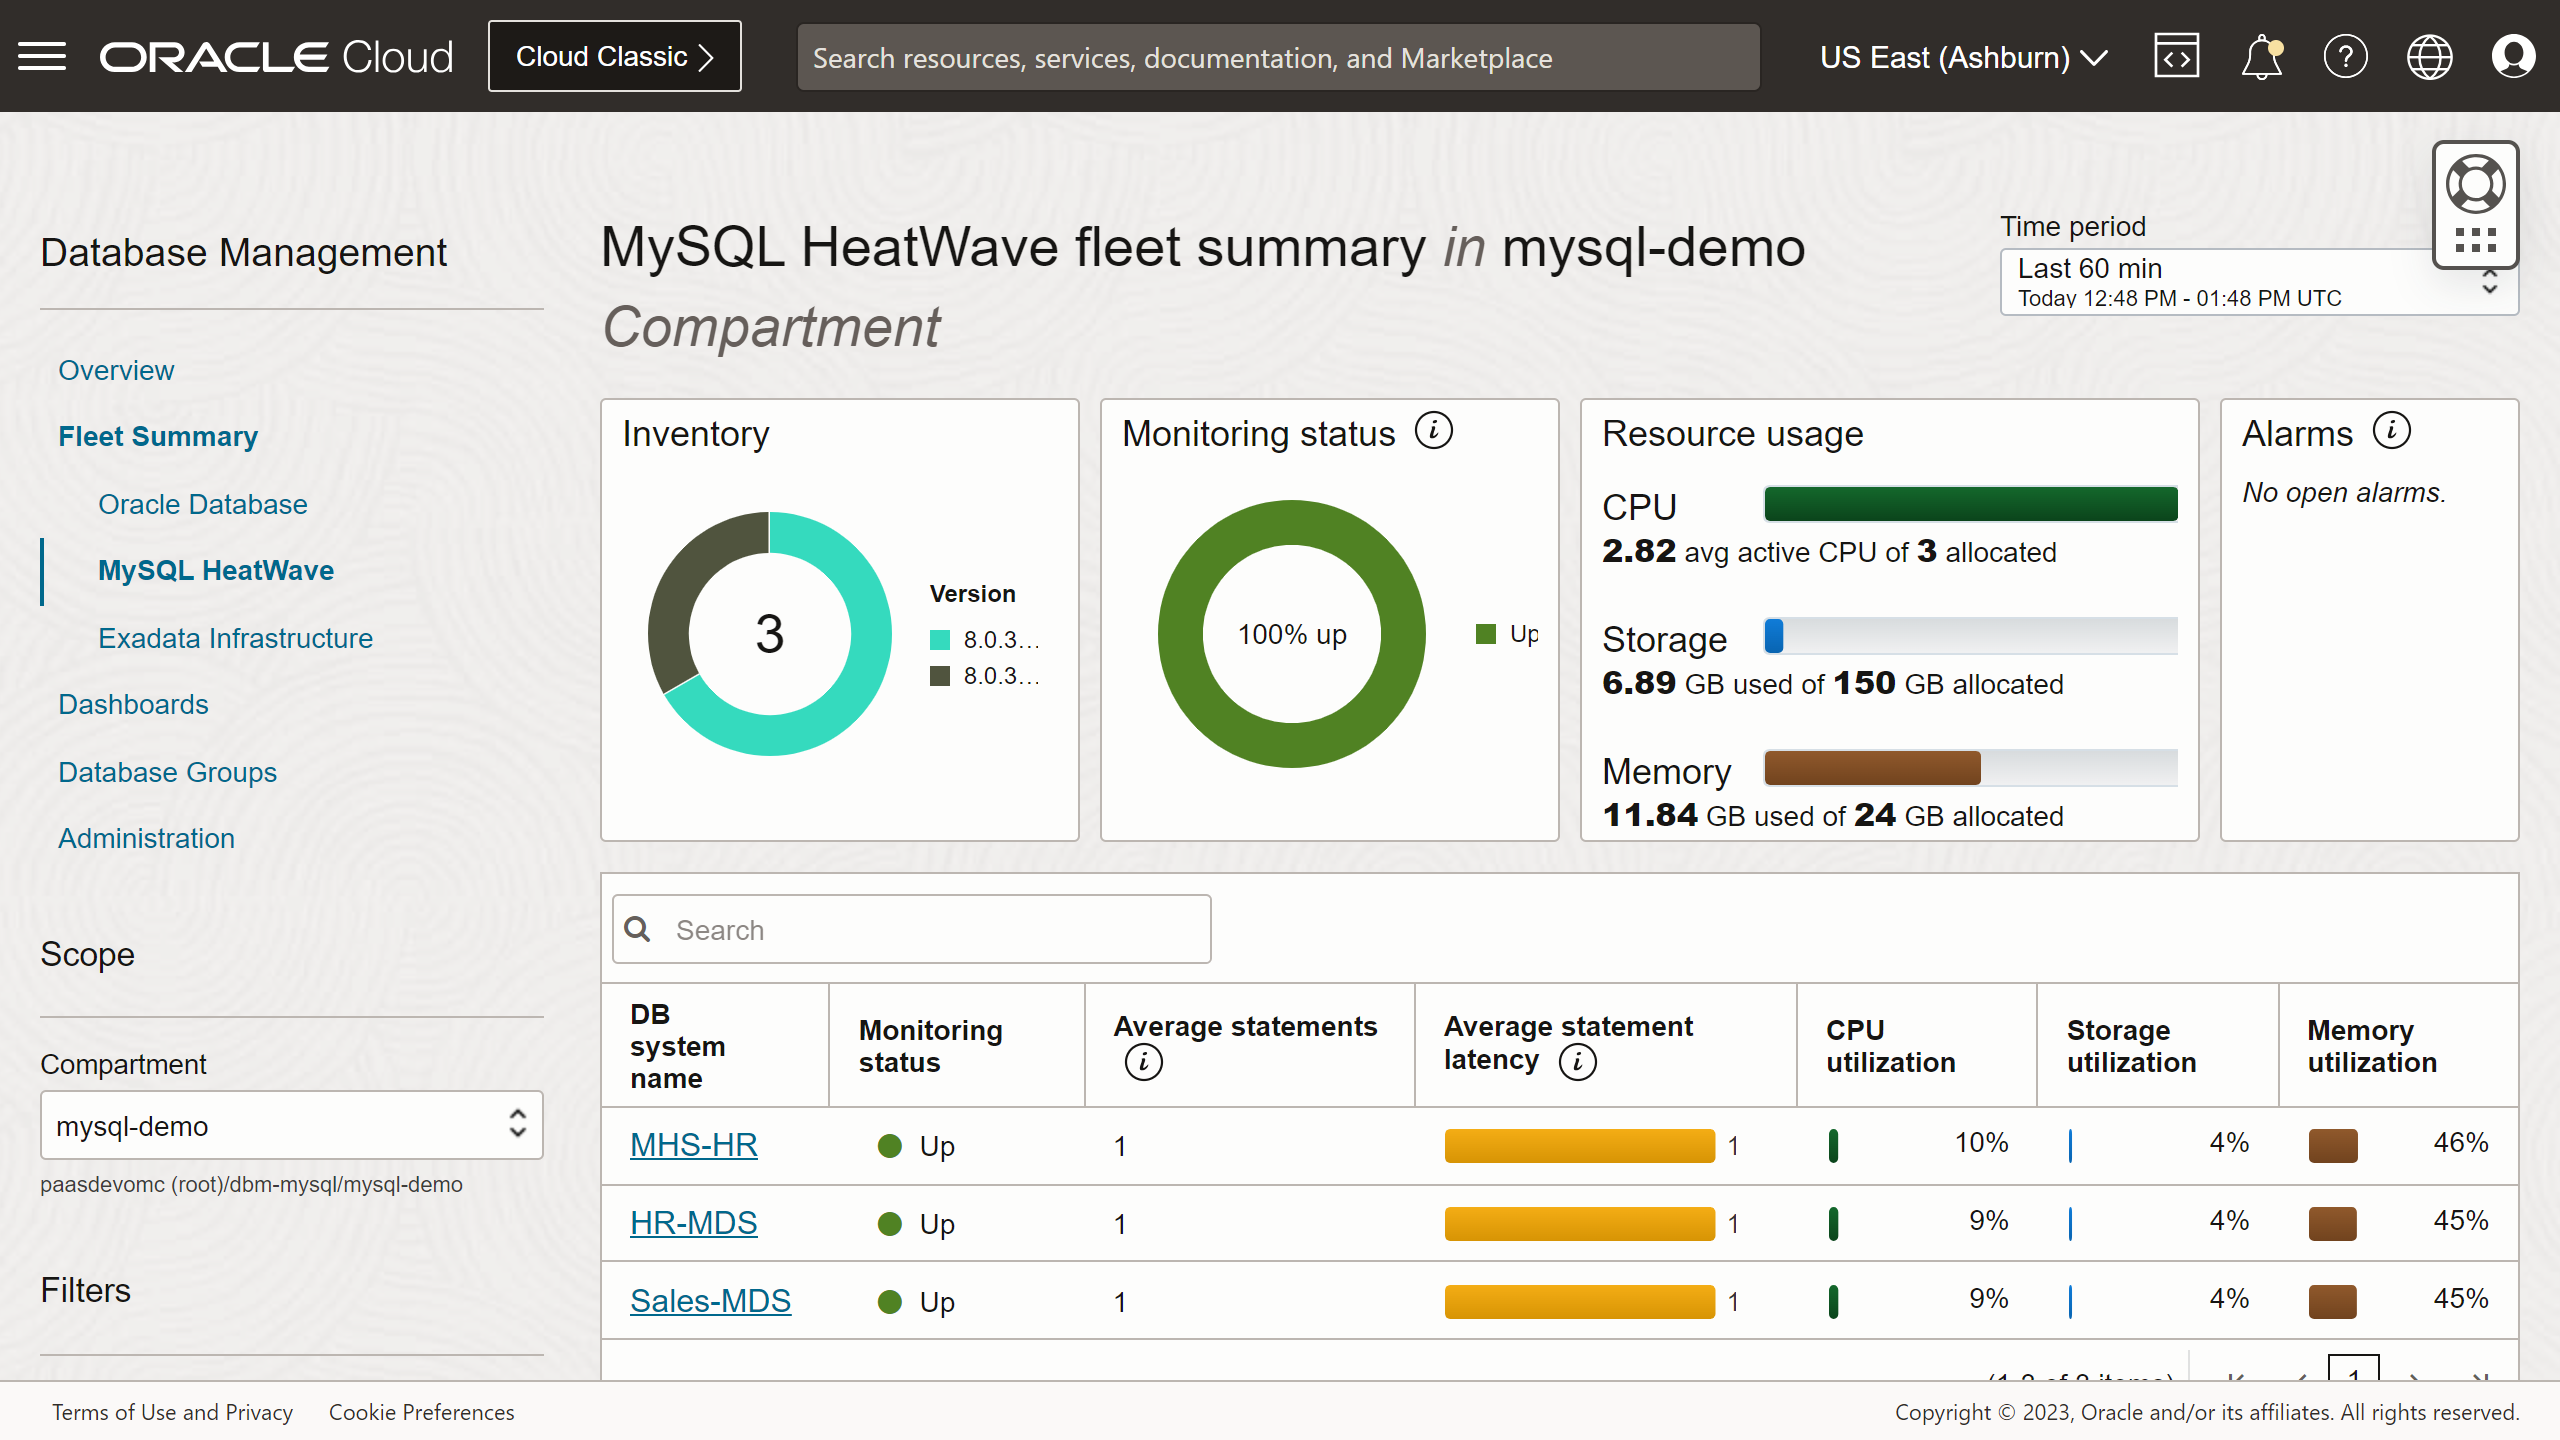
MySQL database fleet monitoring in OCI
Database Management provides the following fleet monitoring features for MySQL DB systems in OCI:
-
Unified user interface to monitor multiple MySQL DB systems in the MySQL HeatWave service
-
Visual summary of the overall CPU, Storage, and Memory allocation and utilization for all the MySQL DB systems in the fleet
-
Total number of alarms by severity for the fleet
-
List of databases in the fleet by monitoring status, top consumers by CPU, Storage, and Memory with details about the average SQL statement latency to further drill down to a specific database for further analysis
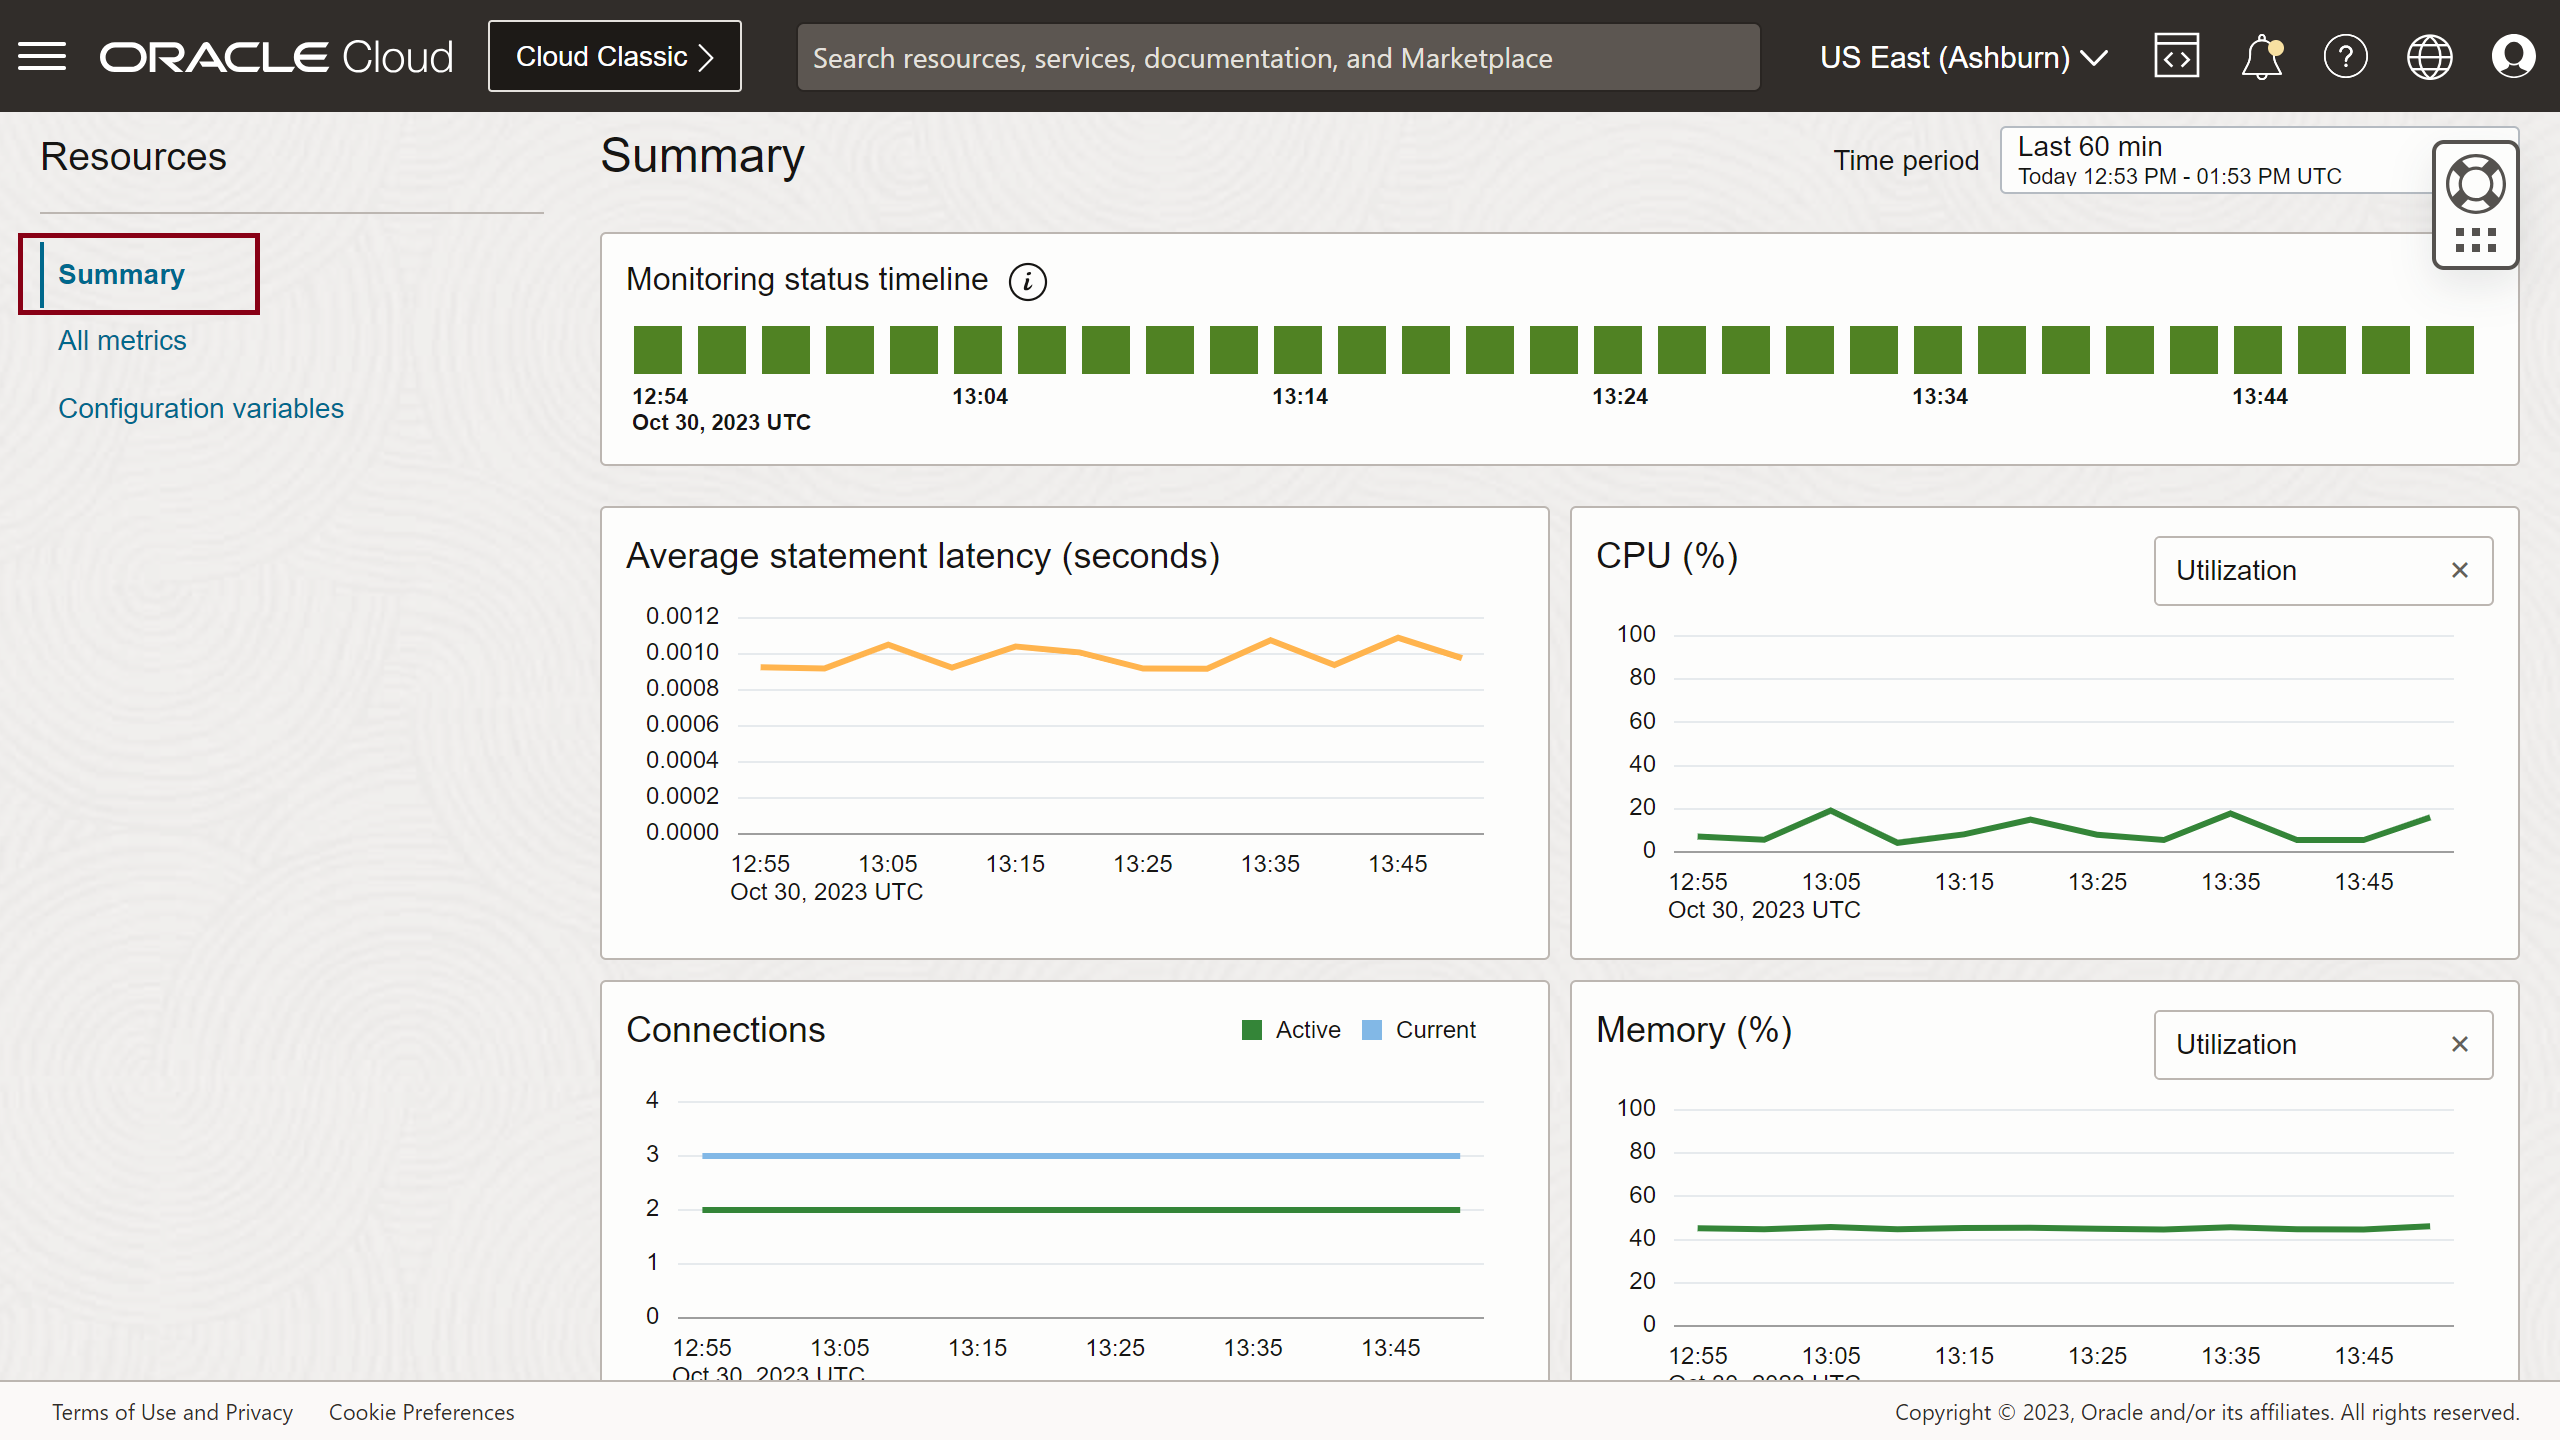
Single MySQL database monitoring
Drill down to the MySQL database details page from the MySQL HeatWave fleet summary page to monitor the following key metrics for a single MySQL database, in the Summary section:
-
Monitoring status of the MySQL database
-
CPU, Memory, and Disk utilization
-
Disk IO Throughput and Bandwidth
-
Database connections
-
SQL statement latency
Monitor the number of open alarms for the MySQL DB systems. This page also has links under Resources on the left pane to explore a variety of interesting metrics and the current configuration variable setting for the MySQL database.
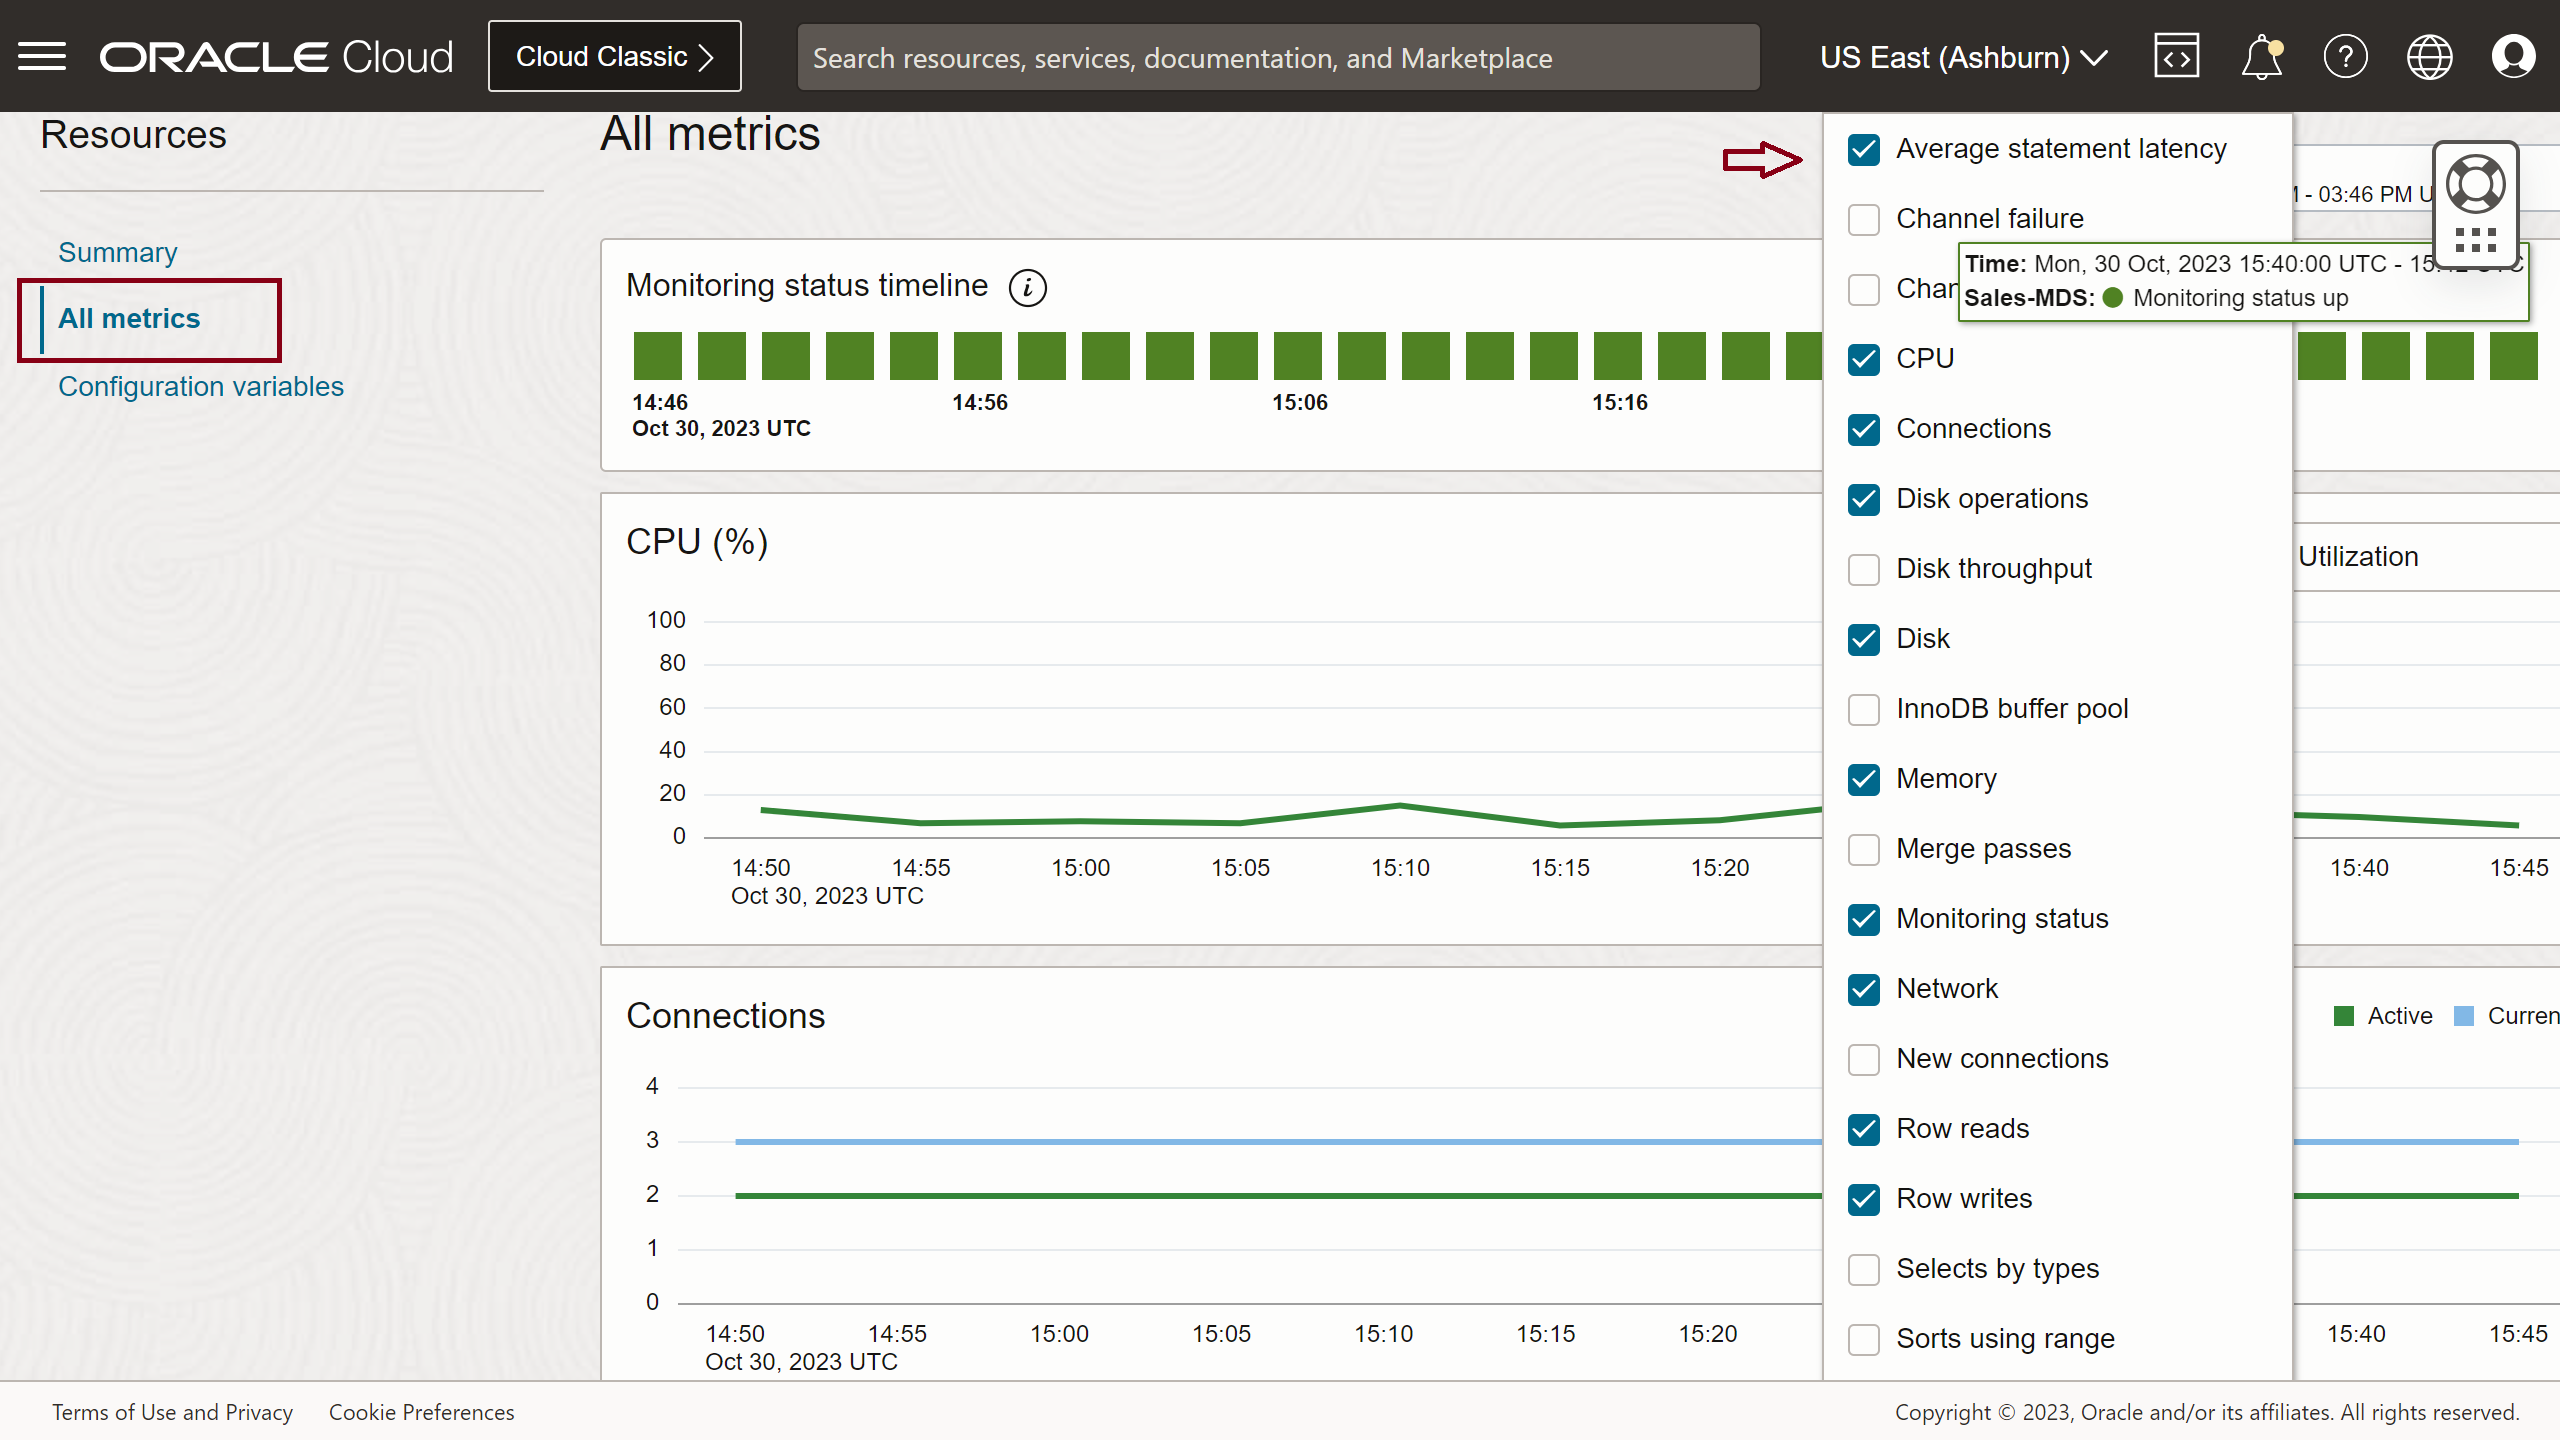
All metrics
In the All metrics section, you can monitor a wide range of key MySQL database metrics across areas to proactively investigate and identify the root cause of performance issues. The charts in this section include those displayed in the Summary section and other metric charts. In addition to the charts displayed in this section, you can select other metric charts from the Select charts drop-down list for an in-depth examination using different indicators.
Here’s an example of how you can use the data displayed in these charts. In the Merge passes chart, should you identify large values for the SortMergePasses metric, you can investigate and check if increasing the value of the sort_buffer_size system variable will mitigate the issue.
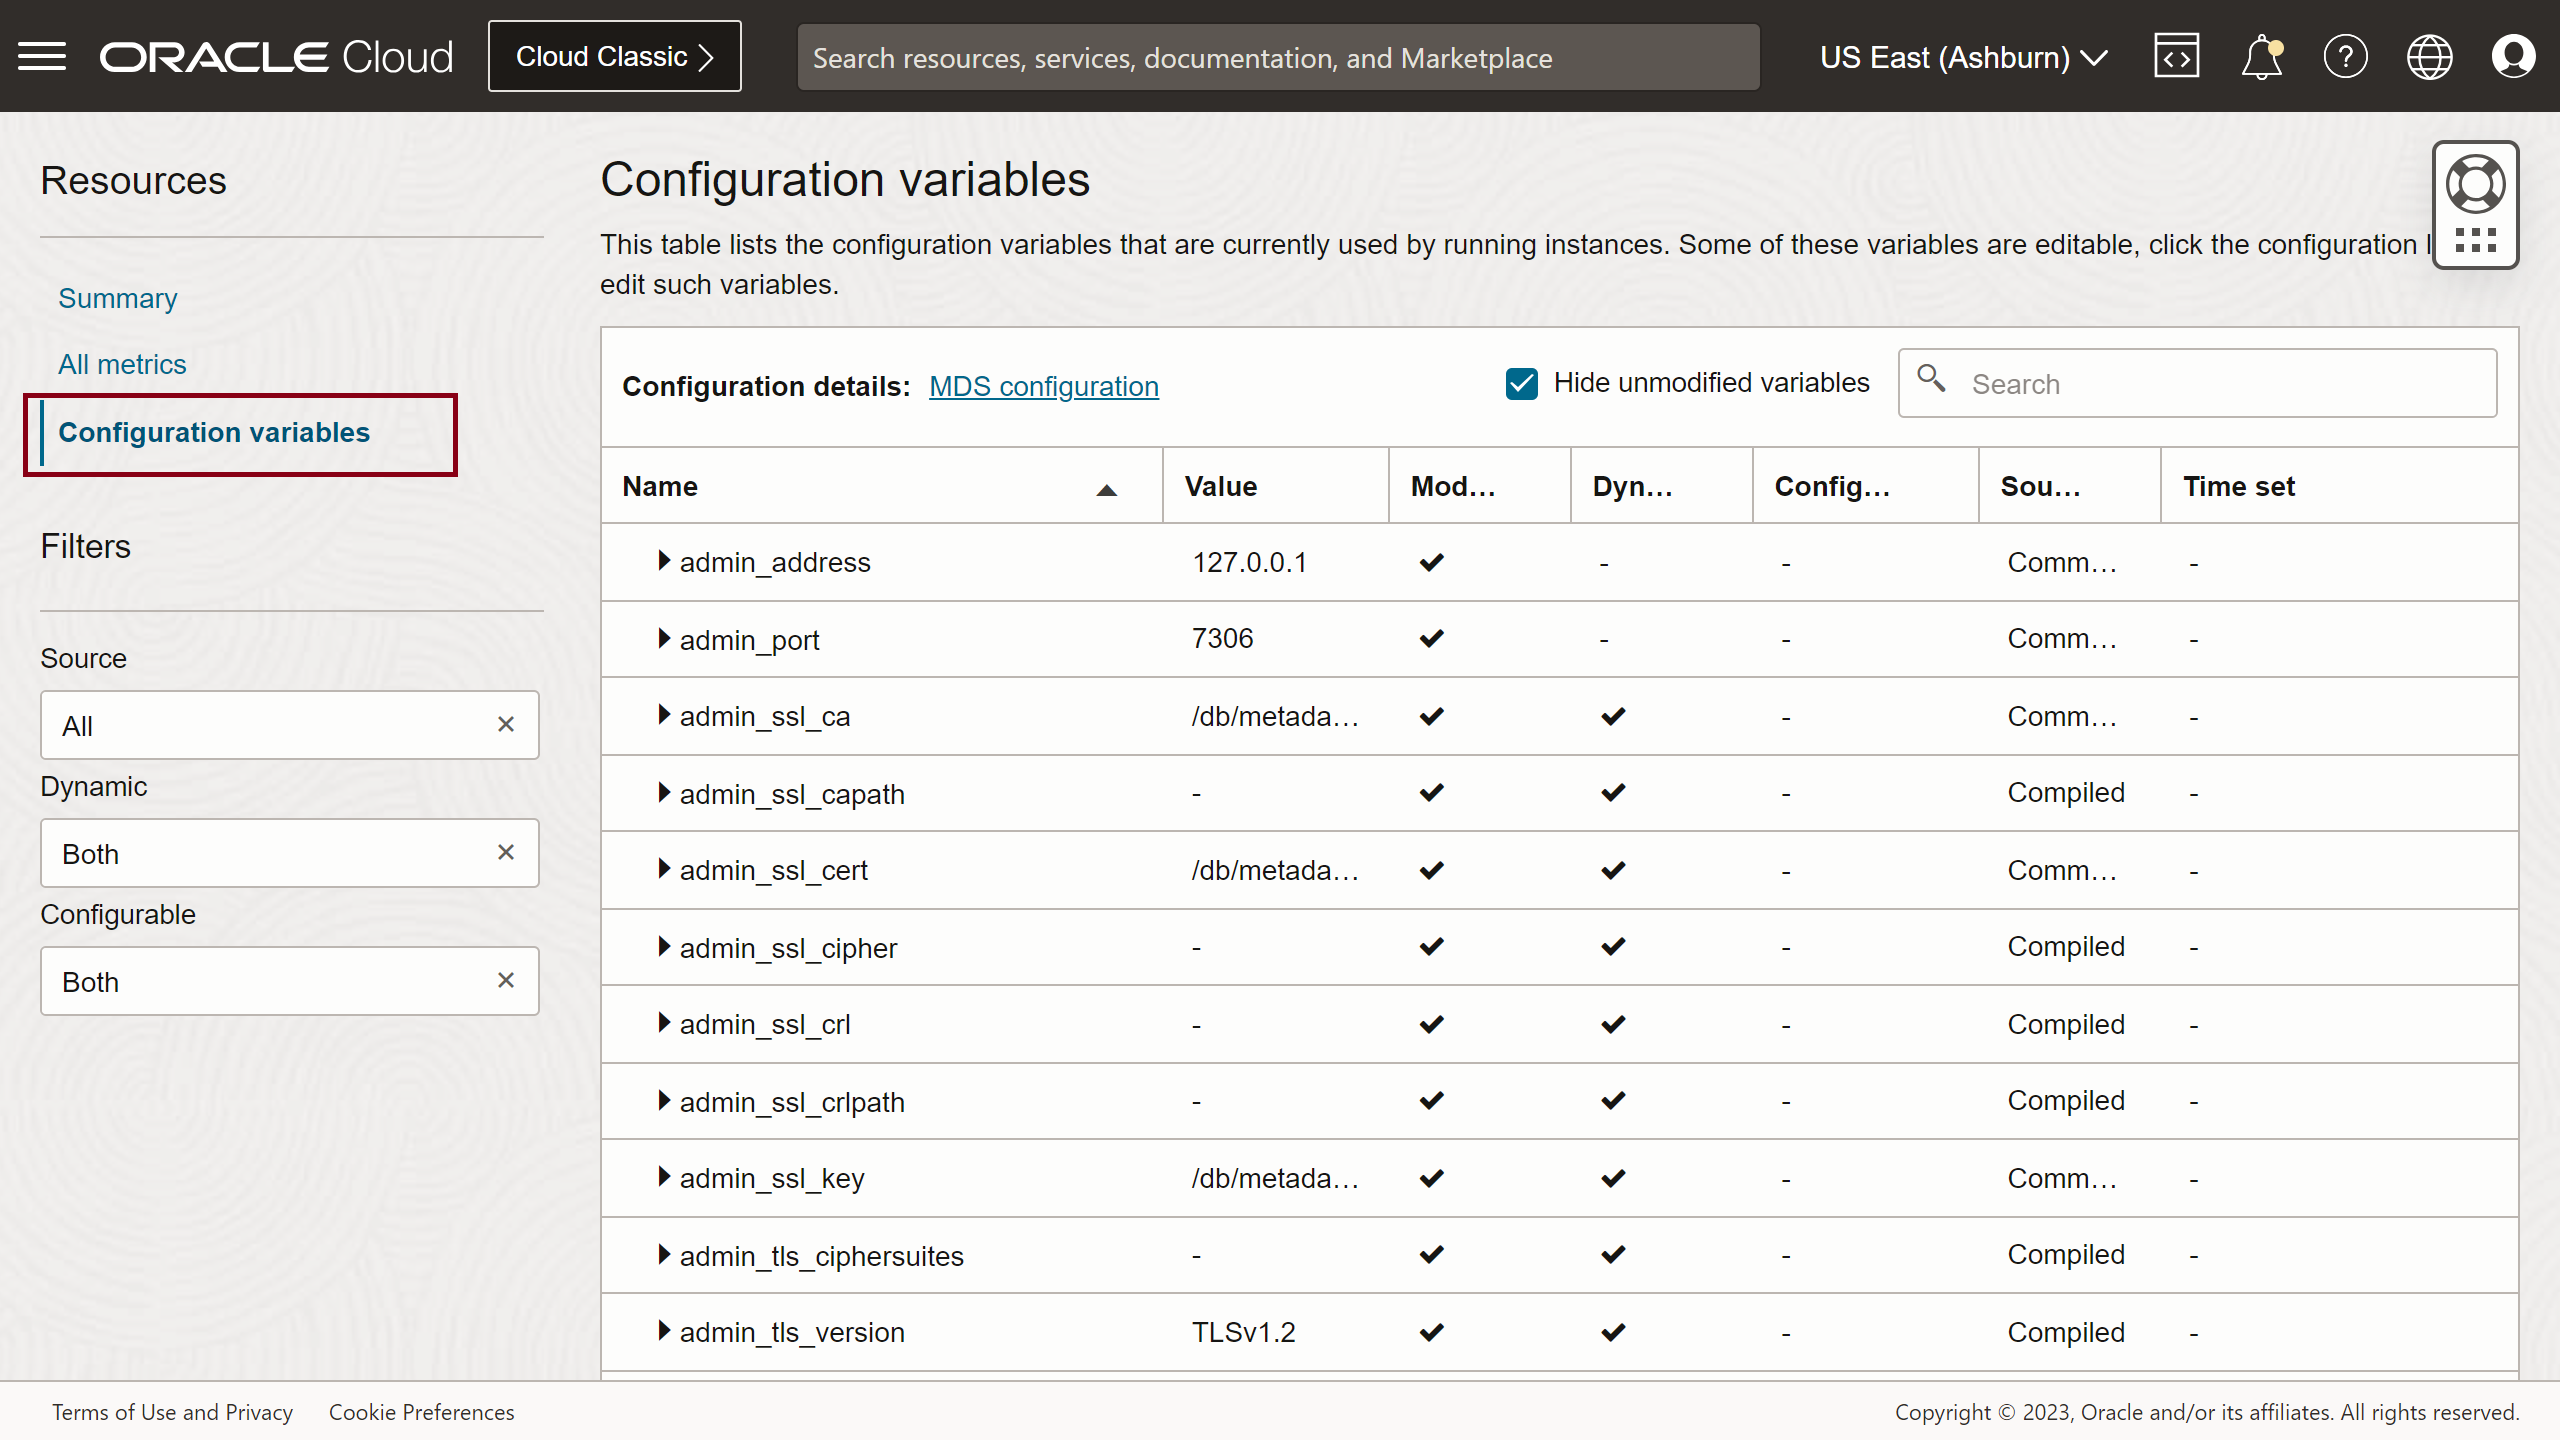
Configuration variables to monitor MySQL database
In the Configuration variables section, you can monitor the configuration variables that are currently used by the MySQL database. Configuration variables are the user, system, initialization, or service-specific variables that define the operation of a MySQL DB system. In the previous paragraph about the All metrics section, we discussed the Merge passes chart (SortMergePasses metric) and a probable solution to mitigate issues related to disk sorts is to increase the sort_buffer_size system variable. The Configuration variables section provides the details of the variables and the option of navigating to the MySQL HeatWave service to edit the variables if required. Use the various filters on the left pane to perform a quick search for a particular configuration variable.
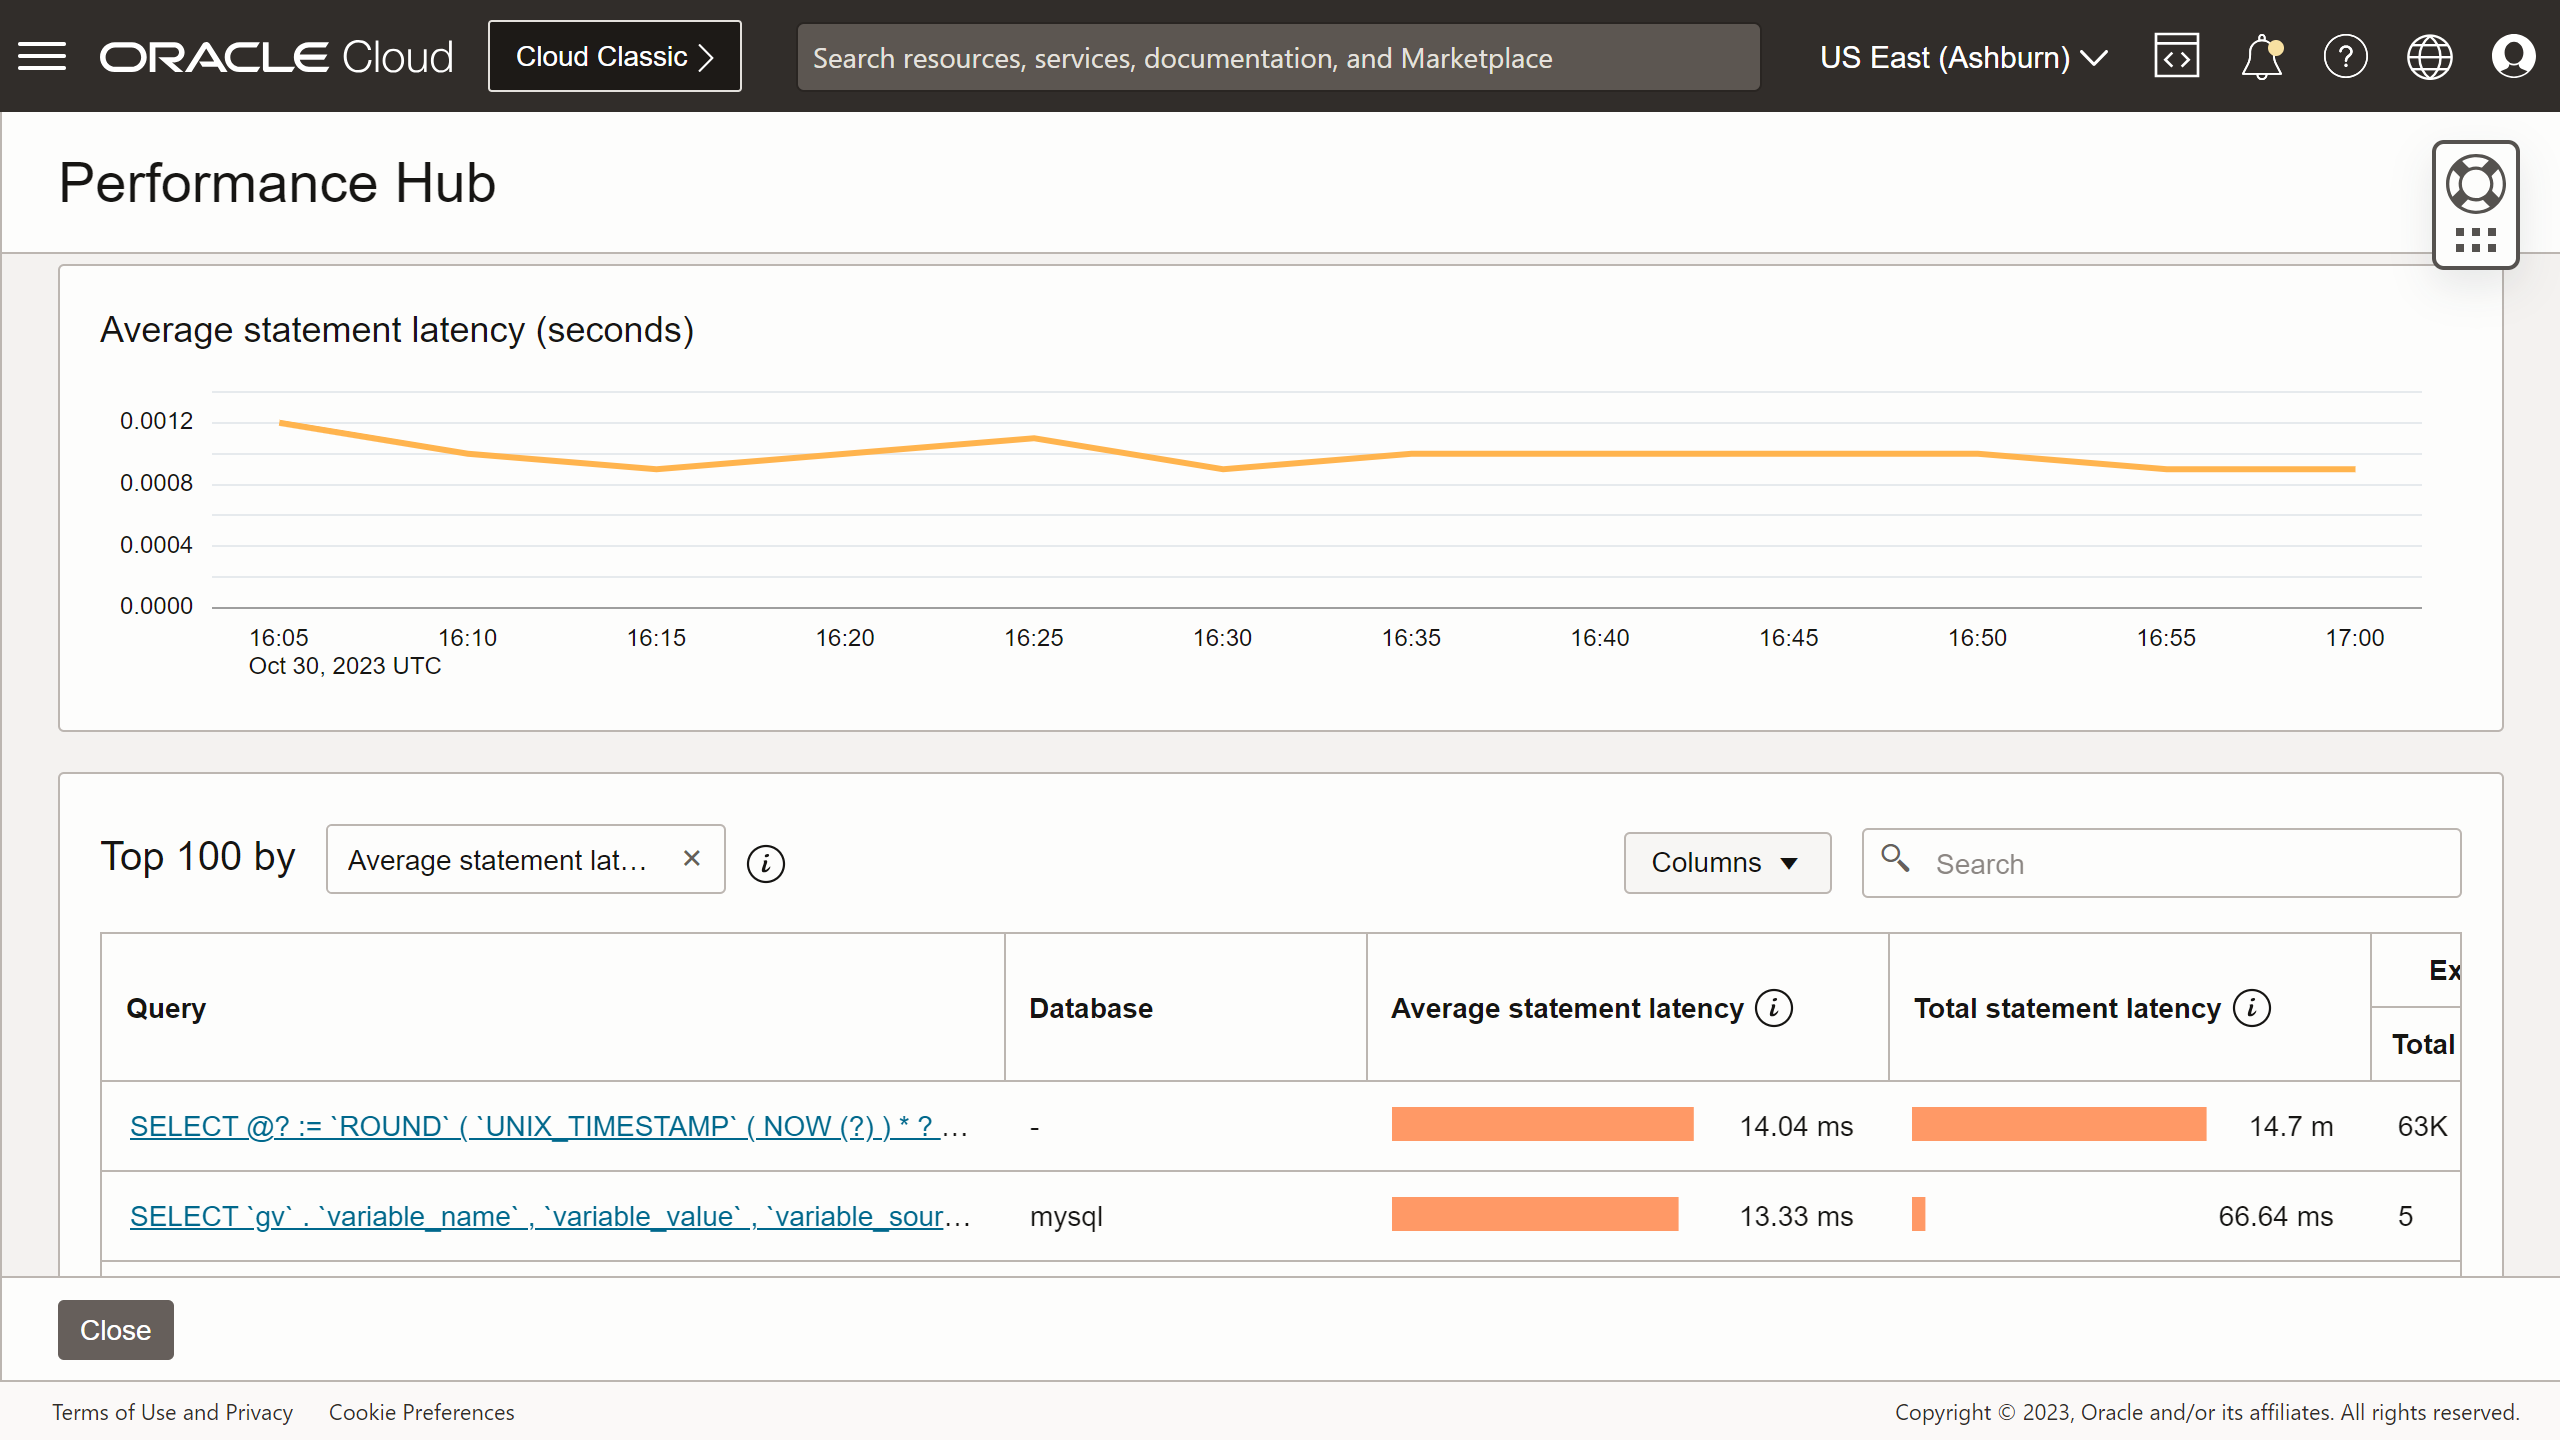
Performance Hub improves database application performance
Performance Hub enables developers and DBAs to quickly improve the performance of their database applications by monitoring query performance. Accurately pinpoint the SQL code that is causing a slowdown by making use of the rich graphs that drill down into detailed query information, thereby providing significantly better visibility into database performance issues. With Performance Hub, developers can improve SQL code during active development as well as continuously monitor and tune queries running on production systems.
Here are the key Performance Hub features for MySQL databases:
-
Quickly identify expensive queries that impact the performance of your applications
-
Visualize query activity to gain further insight into performance beyond query statistics
-
Filter for specific query problems like full table scans and bad indexes using advanced global search options
-
Monitor the performance of the query after optimization to ensure that the execution time has improved
Get started today!
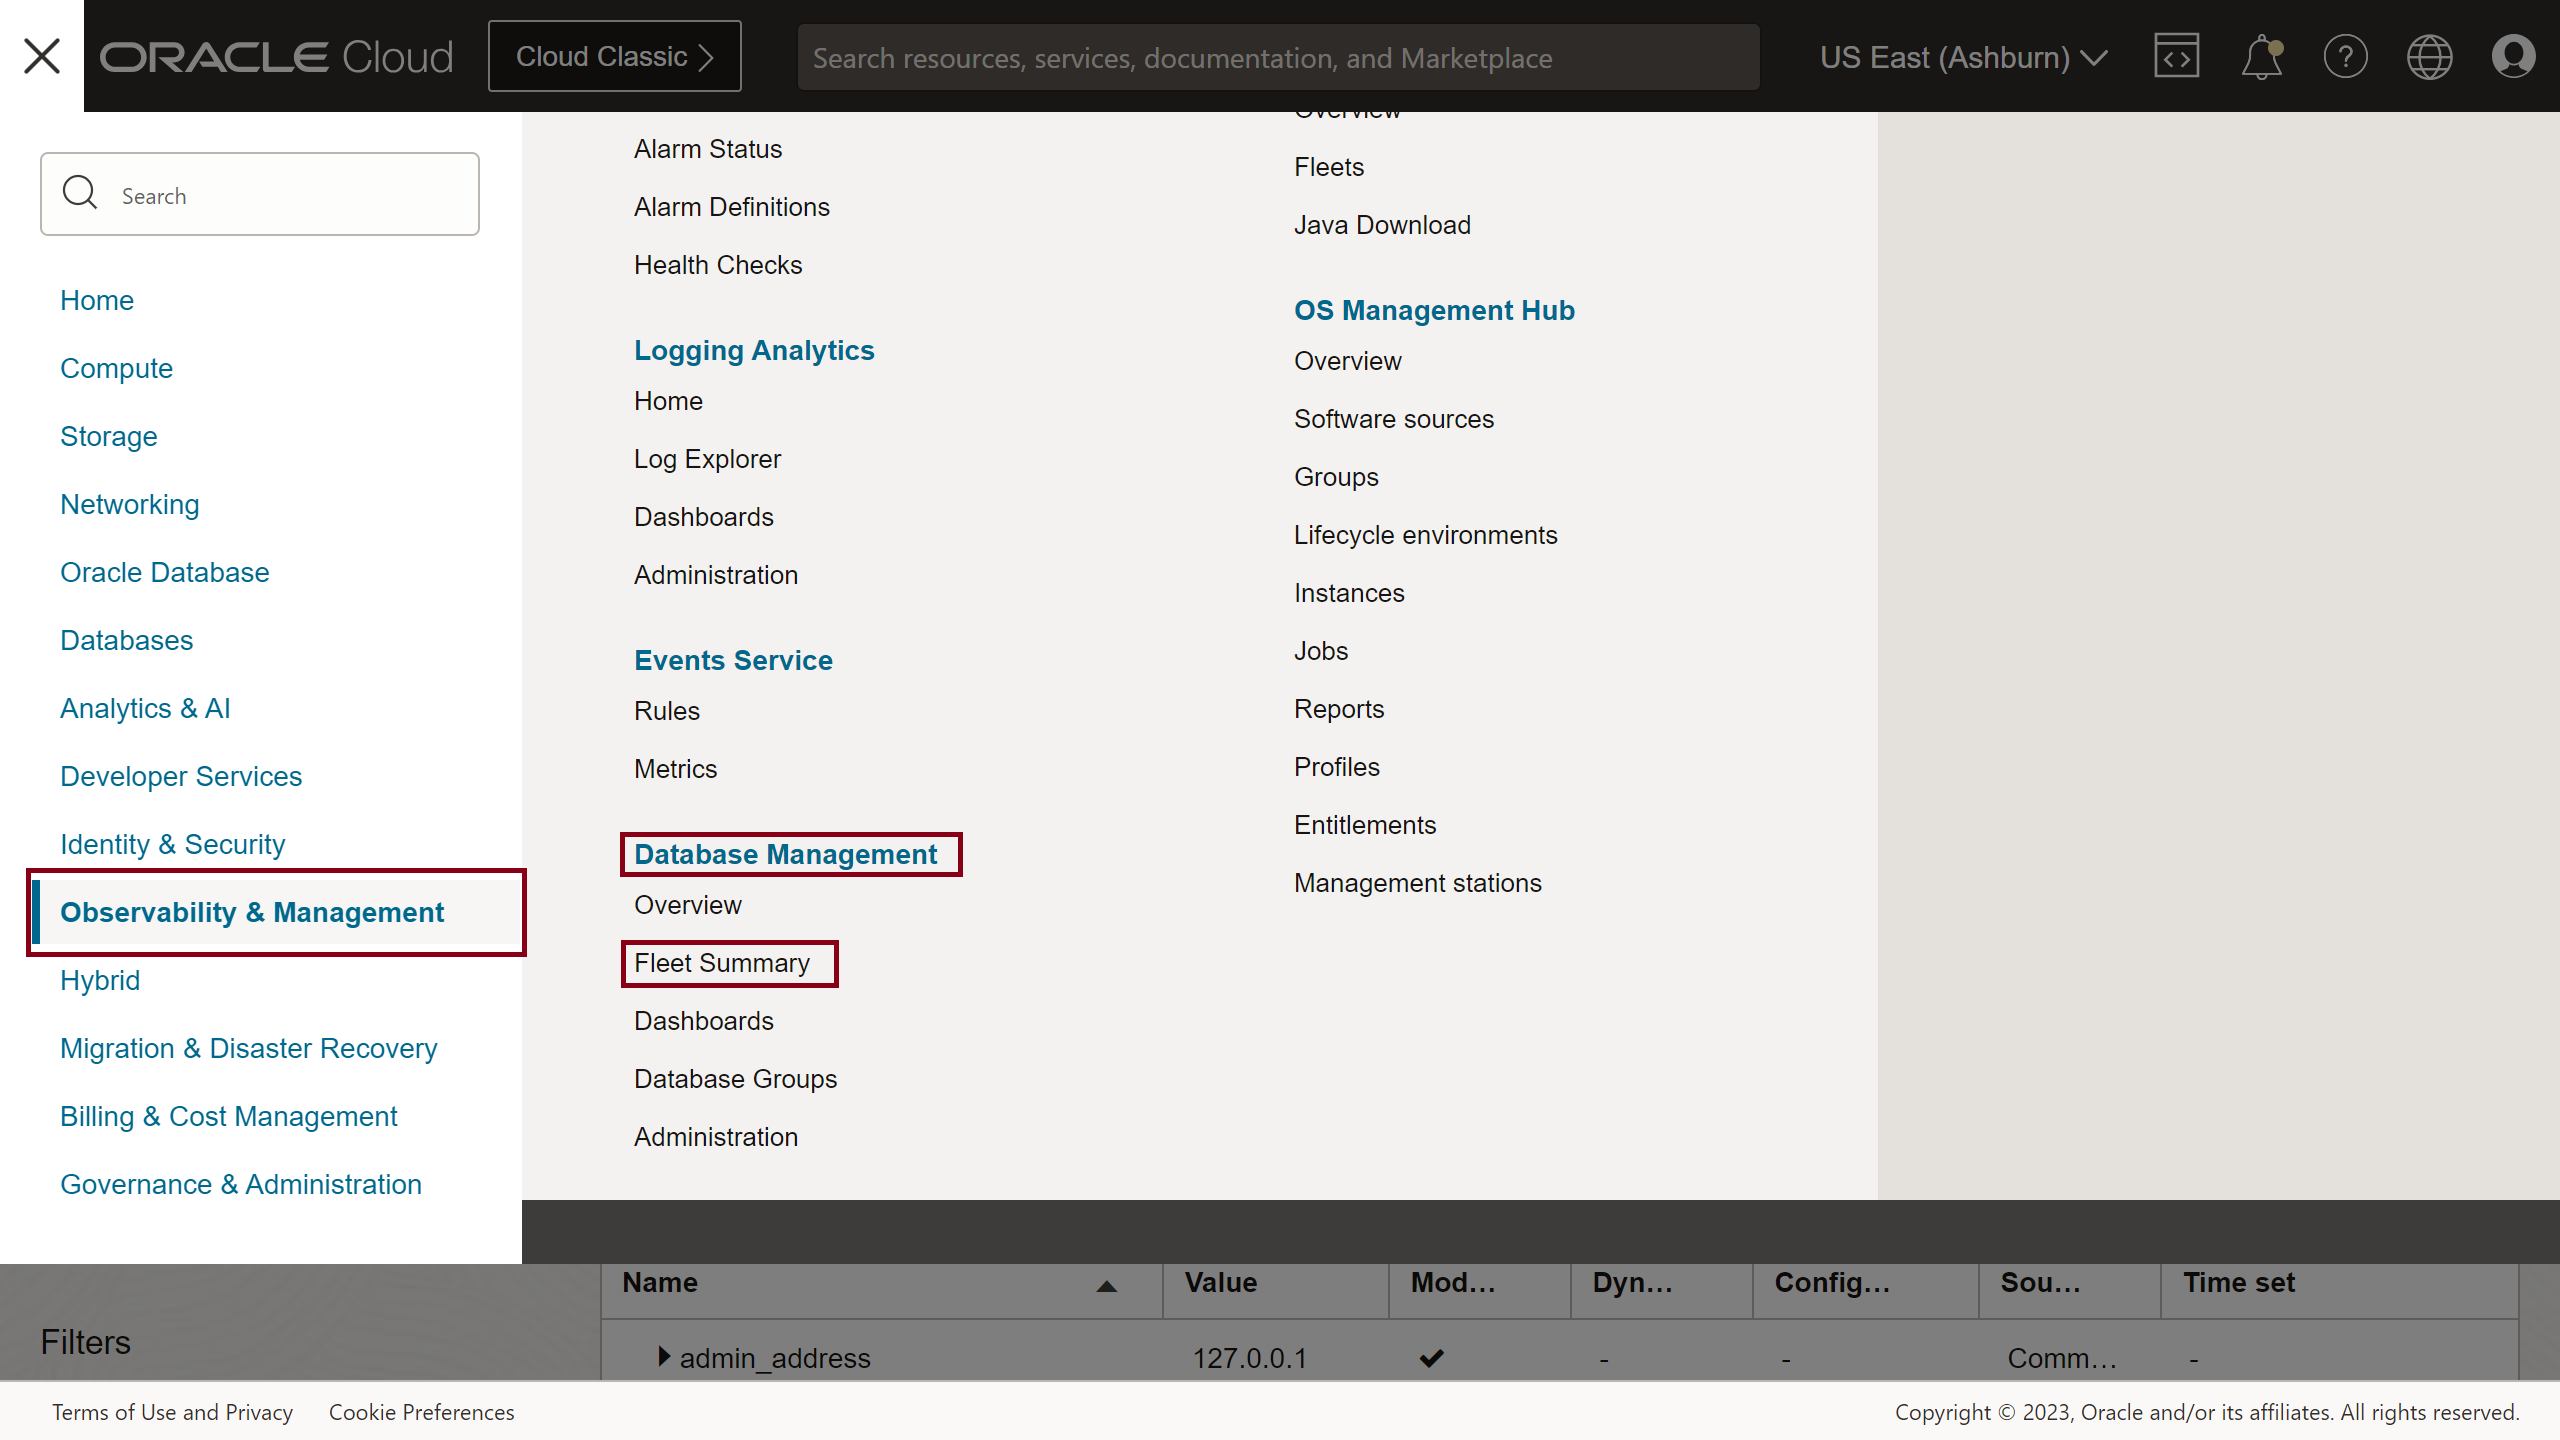
You can find Database Management under the Observability and Management menu in the Oracle Cloud Infrastructure Console. The service is accessible through the Console, CLI, and REST API. Database Management is available in all OCI commercial regions. For more details and availability in US and other government regions, please check the OCI service availability page.
Database Management is currently available for use with the MySQL Heatwave service in OCI. Support for on-premises MySQL Databases is coming soon.
Sign up for an Oracle Cloud Infrastructure trial account! For more information about this feature and how to use it, see the documentation.