MySQL HeatWave is the only fully managed MySQL database service that combines transactions, analytics, machine learning, and GenAI services, without ETL duplication. MySQL HeatWave also includes MySQL HeatWave Lakehouse, allowing users to query data stored in object storage, MySQL databases, or a combination of both. Users can deploy MySQL HeatWave–powered apps on a choice of public clouds: Oracle Cloud Infrastructure (OCI), Amazon Web Services (AWS), and Microsoft Azure.
MySQL HeatWave on AWS provides built-in monitoring capabilities through an intuitive console, offering immediate visibility into key metrics such as CPU usage, memory consumption, storage capacity, and buffer pool size. This monitoring is enabled by default, so you can start tracking your instance as soon as it’s created—no setup required.
Now, MySQL HeatWave on AWS extends its monitoring capabilities by integrating with Amazon CloudWatch, allowing you to view many additional metrics and track its history over time. With this integration, you can build customized dashboards for a centralized view, complementing the pre-built dashboards in the MySQL HeatWave Console. You can define thresholds for key metrics and receive alerts when those thresholds are breached.
With metrics available in both the MySQL HeatWave Console and Amazon CloudWatch, you gain a comprehensive view of your system’s health. This makes it easier to monitor application performance, troubleshoot issues, and proactively optimize resources.
In this blog, I’ll walk you through the monitoring capability with Amazon CloudWatch.
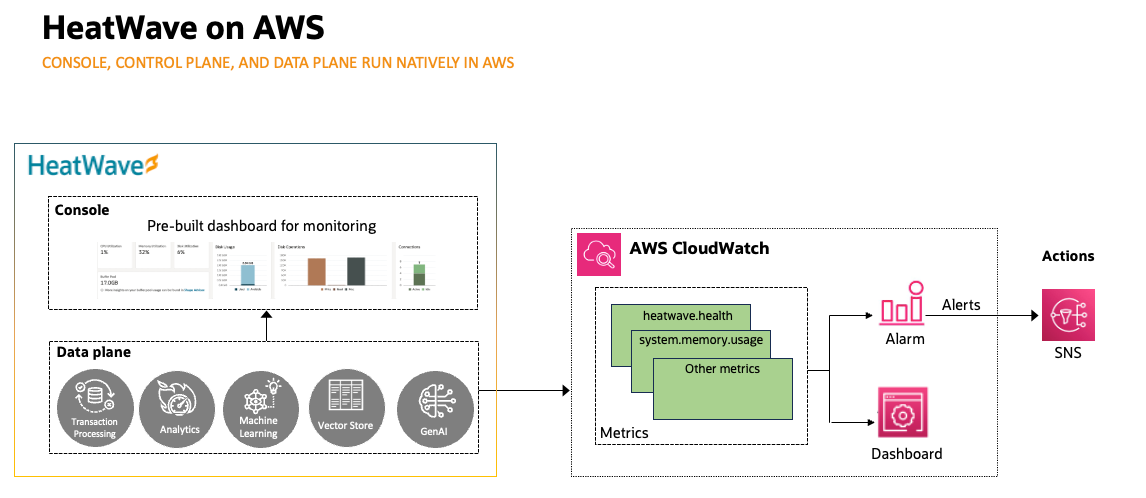
Figure 1: Monitoring MySQL HeatWave on AWS
Benefits of monitoring with Amazon CloudWatch
- Monitor additional metrics: While the MySQL HeatWave Console offers built-in visibility into essential metrics, Amazon CloudWatch extends your monitoring capabilities by exposing a broader set of metrics. This expanded view offers valuable insights enabling you to measure, analyze, and optimize your MySQL HeatWave resources effectively. See CloudWatch Monitoring Metrics.
- Track metric history over time: CloudWatch retains historical telemetry data, allowing you to observe how your MySQL HeatWave instances perform over days, weeks, or months. This historical insight helps to identify performance trends, conduct root-cause analysis, and support long-term capacity planning for your MySQL HeatWave workloads.
- Set alarms: With CloudWatch, you can define thresholds for key MySQL HeatWave metrics—such as CPU utilization, memory pressure, or I/O activity—and receive alerts when those thresholds are breached. For example, you can monitor the CPU usage and disk reads and writes of your instances and then use that data to determine whether you should launch additional instances to handle increased load. You can also use this data to stop under-used instances to save money. See Using Amazon CloudWatch alarms.
- Create customized dashboards: CloudWatch gives you the flexibility to build custom dashboards providing you with a centralized view of your MySQL HeatWave metrics. For quick insights, the MySQL HeatWave Console also includes pre-built dashboards that showcase key performance indicators out of the box. See Monitoring & Using Amazon CloudWatch dashboards.
Enabling CloudWatch monitoring
To start monitoring your MySQL HeatWave instances with Amazon CloudWatch, you first need to create an IAM role via the AWS Management Console. This role grants CloudWatch the necessary permissions to access telemetry data from your DB system and HeatWave clusters. Detailed step-by-step instructions can be found here.
After the IAM role is configured, you can enable CloudWatch monitoring either when creating a new DB system or by updating the monitoring configuration of an existing system—making it easy to add observability at any stage of your deployment.
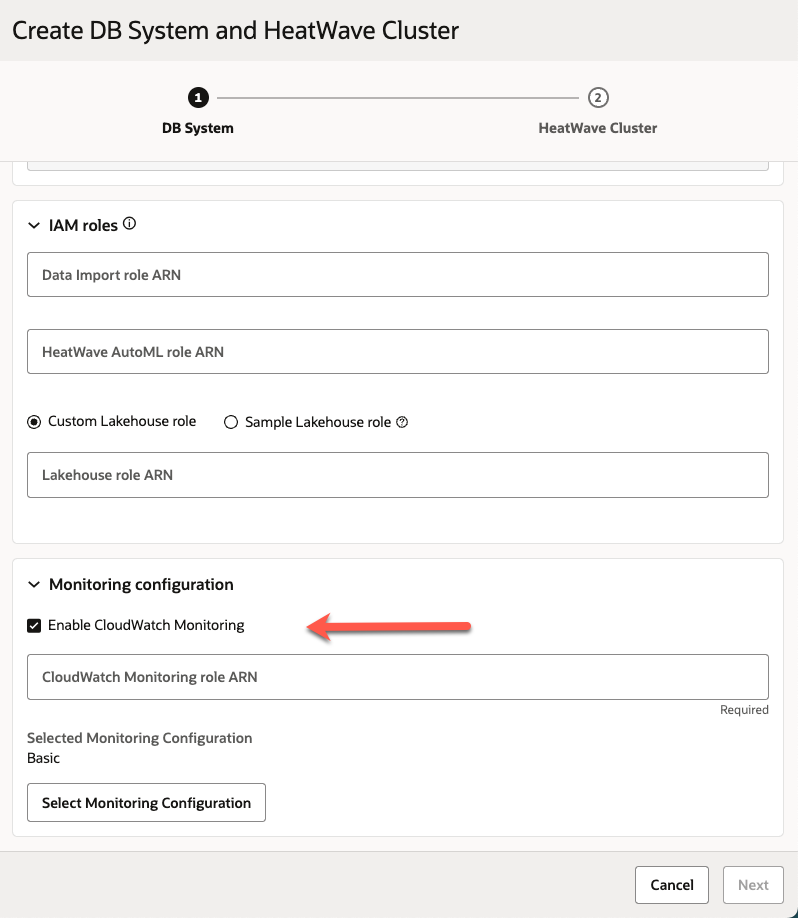
Figure 2: Enabling CloudWatch monitoring when creating a DB system
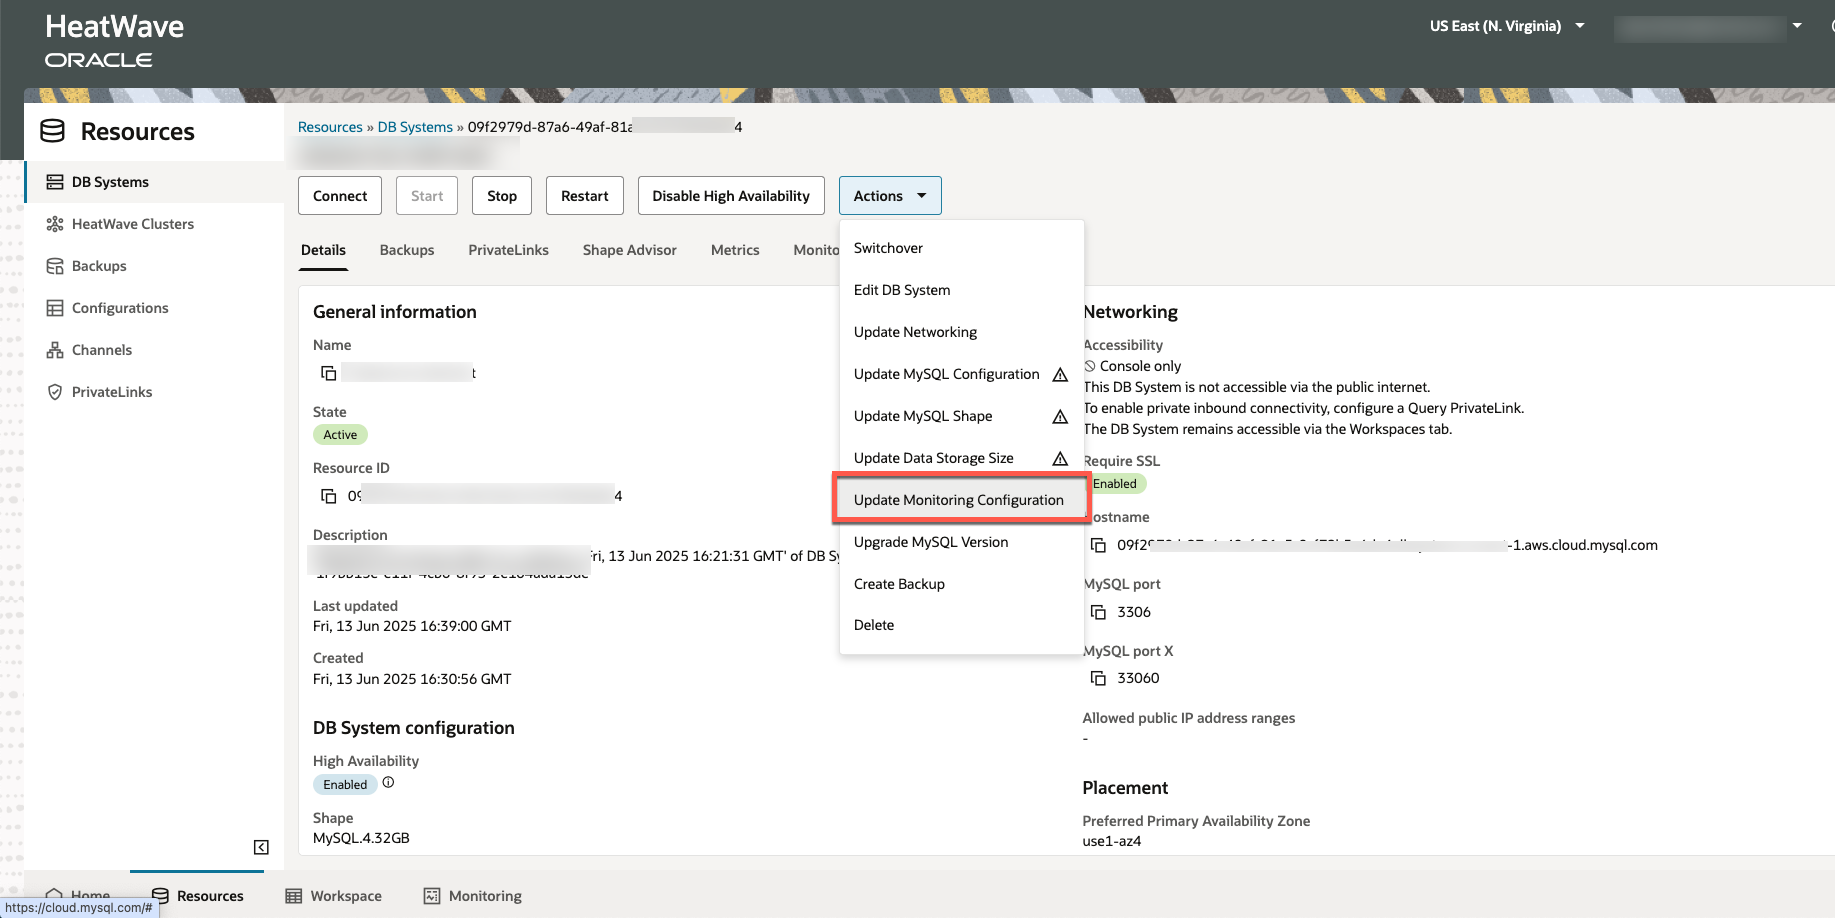
Figure 3: Enabling CloudWatch monitoring on an existing DB system
Selecting monitoring configuration
To simplify setup, MySQL HeatWave on AWS provides predefined telemetry templates. These templates help you get started with minimal effort:
- Basic: Includes essential metrics for standard monitoring.
- Detailed: Covers an extended set of metrics, providing deeper insights into your instance performance.
- Custom: Gives you full control to select exactly which metrics to monitor, offering maximum flexibility for advanced users with specific requirements.
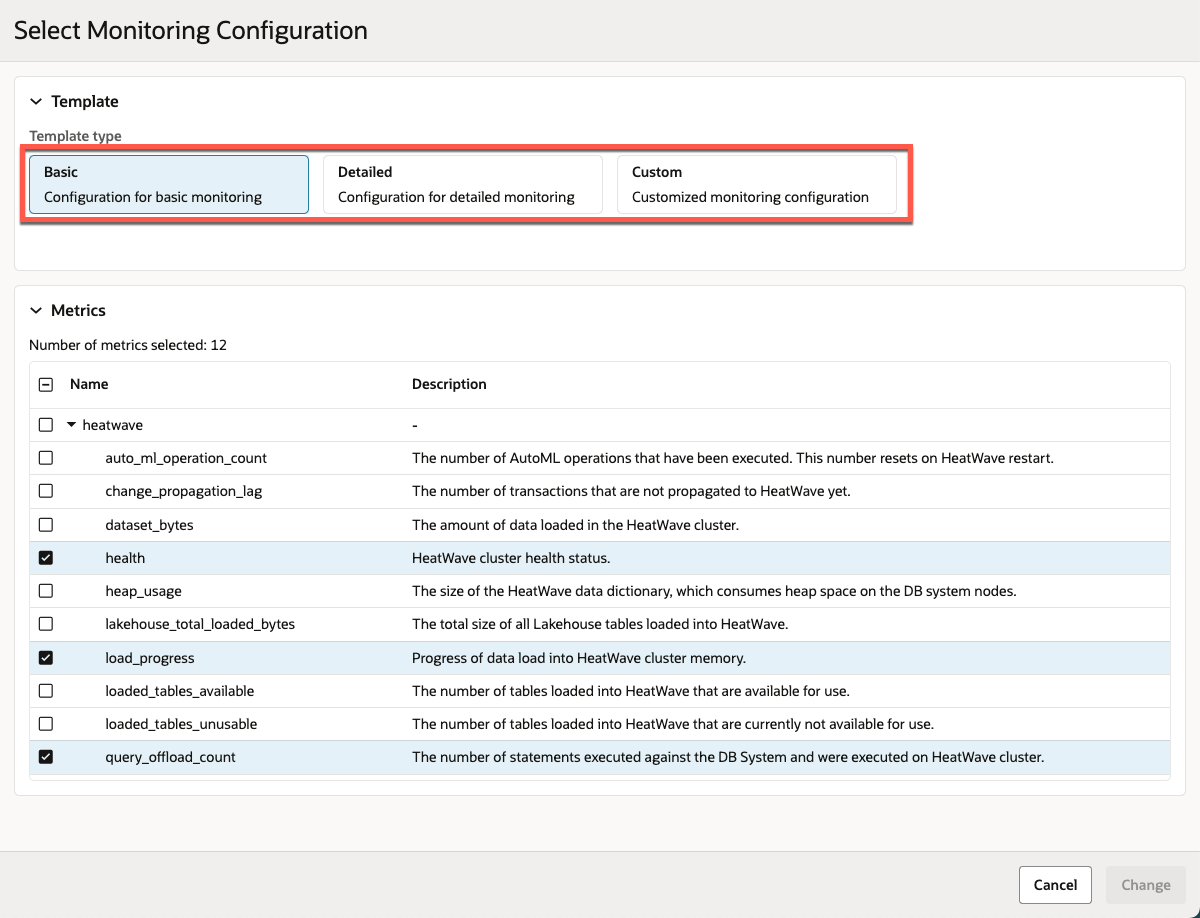
Figure 4: Selecting monitoring configuration
Verify the list of CloudWatch monitoring metrics you have set up by checking the Monitoring Configuration tab of your DB System. See MySQL DB System Details.
Figure 5: Monitoring configuration
Viewing metrics in CloudWatch
Once CloudWatch monitoring is enabled, you can access MySQL HeatWave metrics under the OracleHeatWave namespace. These metrics provide valuable insights into your system’s performance, enabling you to quickly identify and troubleshoot issues.
For high availability configurations, only the primary MySQL HeatWave instance emits metrics. If a failover occurs, the new primary automatically assumes responsibility for metric reporting, ensuring uninterrupted monitoring and continuous visibility. See CloudWatch Monitoring.
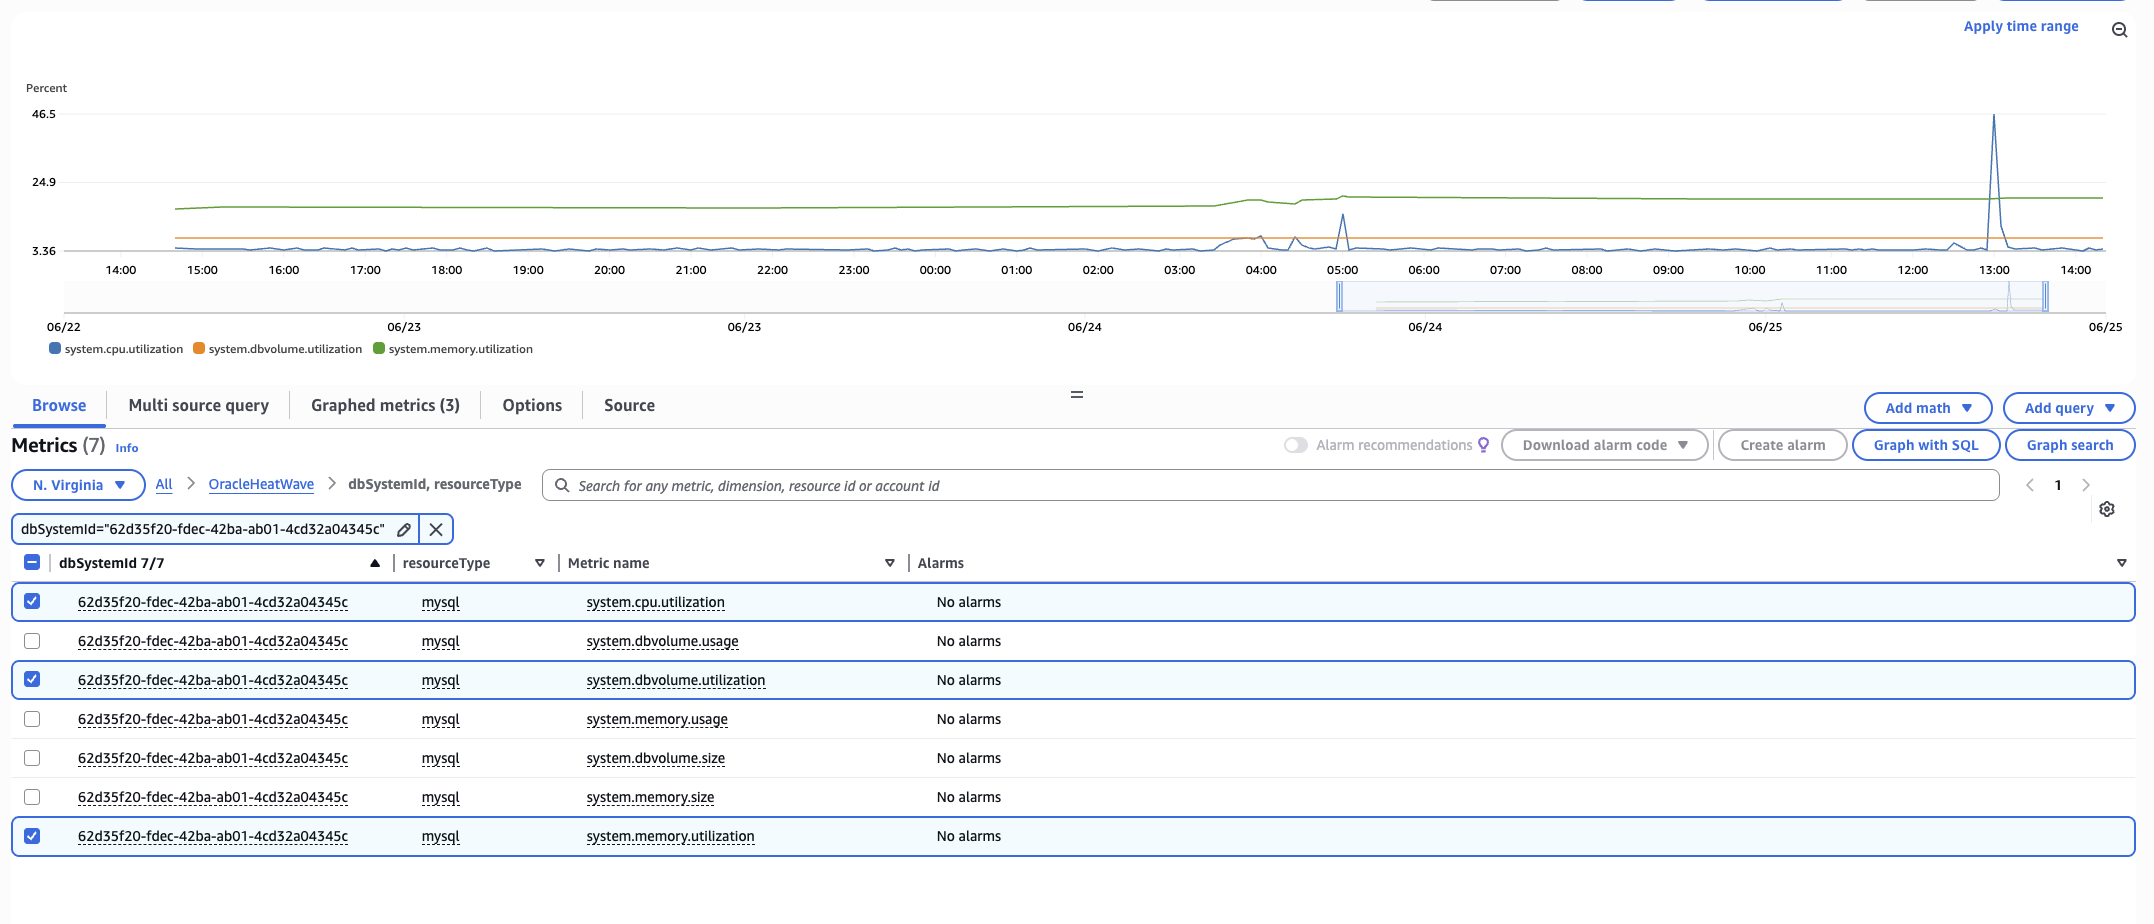
Figure 6: Metrics in CloudWatch
Getting started with MySQL HeatWave for free
You can explore MySQL HeatWave on AWS at no cost by signing up for the Oracle Cloud Free Tier. New users receive $300 in free credits, valid for up to 30 days. This gives you the opportunity to test-drive MySQL HeatWave with full access to its features, including CloudWatch monitoring.
Additional Resources
- MySQL HeatWave website
- MySQL HeatWave on AWS documentation
- MySQL HeatWave on AWS Technical Brief
- MySQL HeatWave documentation
- Request a free MySQL HeatWave workshop