Towards the end of the previous year, we shared the general availability of the Oracle Cloud Infrastructure Database Management for MySQL Heatwave Database Service on Oracle Cloud Infrastructure (OCI).
The initial release focused on MySQL OLTP observability. Building upon the existing foundation, we are pleased to announce an extension of its monitoring capabilities encompassing MySQL HeatWave clusters and Lakehouse-enabled DB Systems. With this enhancement, the Database Management service empowers data professionals with deeper insights and provides proactive monitoring opportunities, ensuring robust performance and informed decision-making.
Oracle has been a leader in database management for decades, and now these unique capabilities are available in Oracle Cloud. This new capability in the Database Management service brings the best of Oracle’s industry-leading innovations from MySQL Enterprise Monitor (MEM) and Enterprise Manager into Oracle Cloud.
Feature summary
- Unified user interface to monitor multiple databases, including MySQL HeatWave and Oracle Databases, deployed and managed within OCI in their respective fleet summaries
- Enhanced ability to proactively detect and identify the root cause of performance issues across a fleet of databases with HeatWave clusters and Lakehouse enabled
- Consolidated performance alerts for a fleet or specific database to triage investigation
- Proactively detect and identify the root cause of SQL performance issues
MySQL HeatWave Cluster and Lakehouse systems
Database Management provides the following fleet monitoring features:
- A unified user interface to monitor multiple MySQL HeatWave Database systems with Lakehouse deployed in OCI
- Within the alarms section, you’ll find metrics specifically related to HeatWave clusters for DB systems. These metrics allow you to view alarms categorized by their severity level
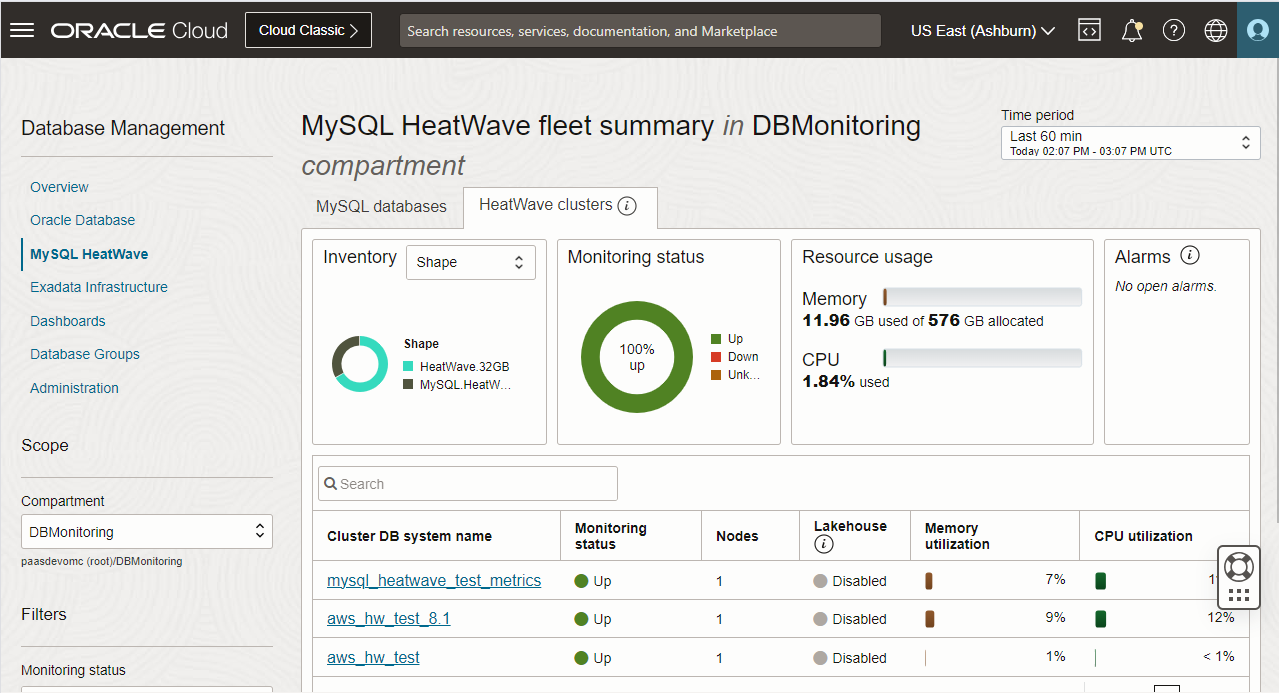
- A HeatWave clusters tab with details about the HeatWave clusters associated with the DB systems under monitoring in Database Management. When exploring this tab, you have the capability to utilize filters to refine your view and focus on specific DB systems
- The fleet page displays key configuration and monitoring metrics about HeatWave clusters attached to the DB systems
- Monitoring status: Current monitoring status of the HeatWave clusters:
- Up: HeatWave cluster health status is healthy, reloading, or recovering
- Down: HeatWave cluster health status is failed. This status is displayed if even one of the nodes in the HeatWave cluster is in a failed state
- Unknown: HeatWave cluster health status metric is unavailable
- Nodes: Number of HeatWave nodes in the HeatWave cluster.
- Lakehouse: Lakehouse enablement status. Indicates whether Lakehouse is enabled for the HeatWave cluster.
- Memory utilization: Percentage of memory utilized by the nodes in the HeatWave cluster.
- CPU utilization: Percentage of CPU utilized by the nodes in the HeatWave cluster.
Monitor a HeatWave Cluster
You can drill down to the MySQL database details page from the Fleet summary page to monitor key metrics for a HeatWave Cluster that is attached to a Database System.
Navigate to the cluster information tab to access essential details, including the compartment and OCID of the DB system, the number of nodes within the cluster, the shape of the HeatWave nodes, and the status of Lakehouse enablement. You can also monitor the number of open alarms for the MySQL HeatWave Cluster.
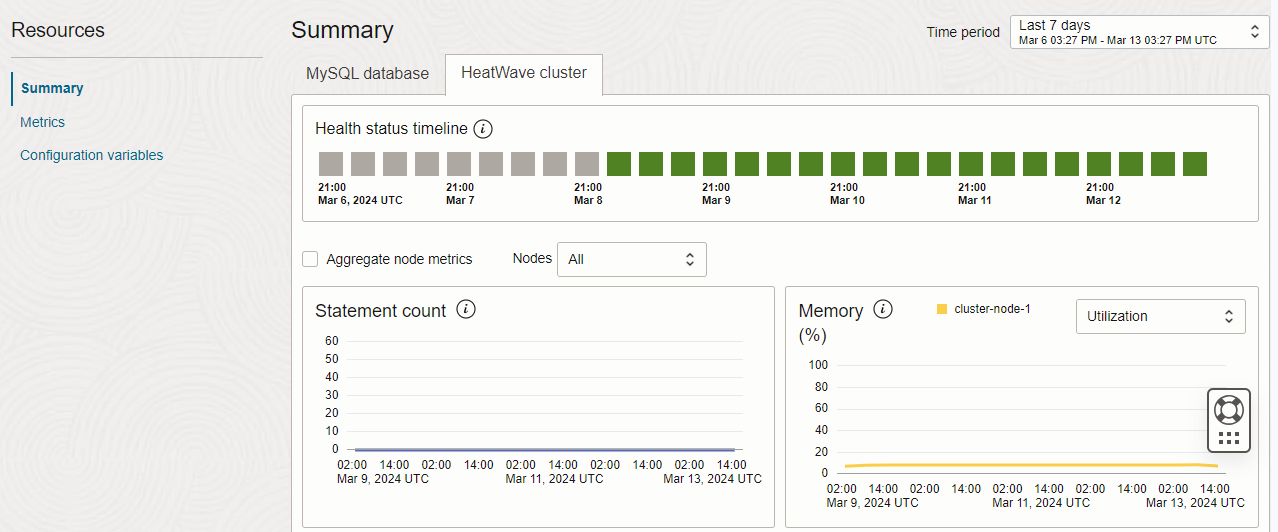
You can use the HeatWave cluster tab in the Summary section to:
Monitor the Health status timeline, which displays an overview of the health status of the HeatWave cluster during the selected period of time. The health status indicates whether the HeatWave cluster is healthy, reloading data, undergoing recovering, or experiencing a node failure.
Keep a close eye on critical HeatWave cluster metrics, including Memory (%) and CPU (%). The visual representation of these metrics provides rapid insights into the health, capacity, and performance of your HeatWave cluster.
The Memory (%) and CPU (%) metric charts offer a granular view at the HeatWave node level. Additionally, you have the option to select the ‘Aggregate node metrics’ checkbox, which reveals the combined metrics for all nodes within the HeatWave cluster. For specific insights into a particular HeatWave node, simply choose the desired node from the Nodes drop-down list.
Customized display of metrics
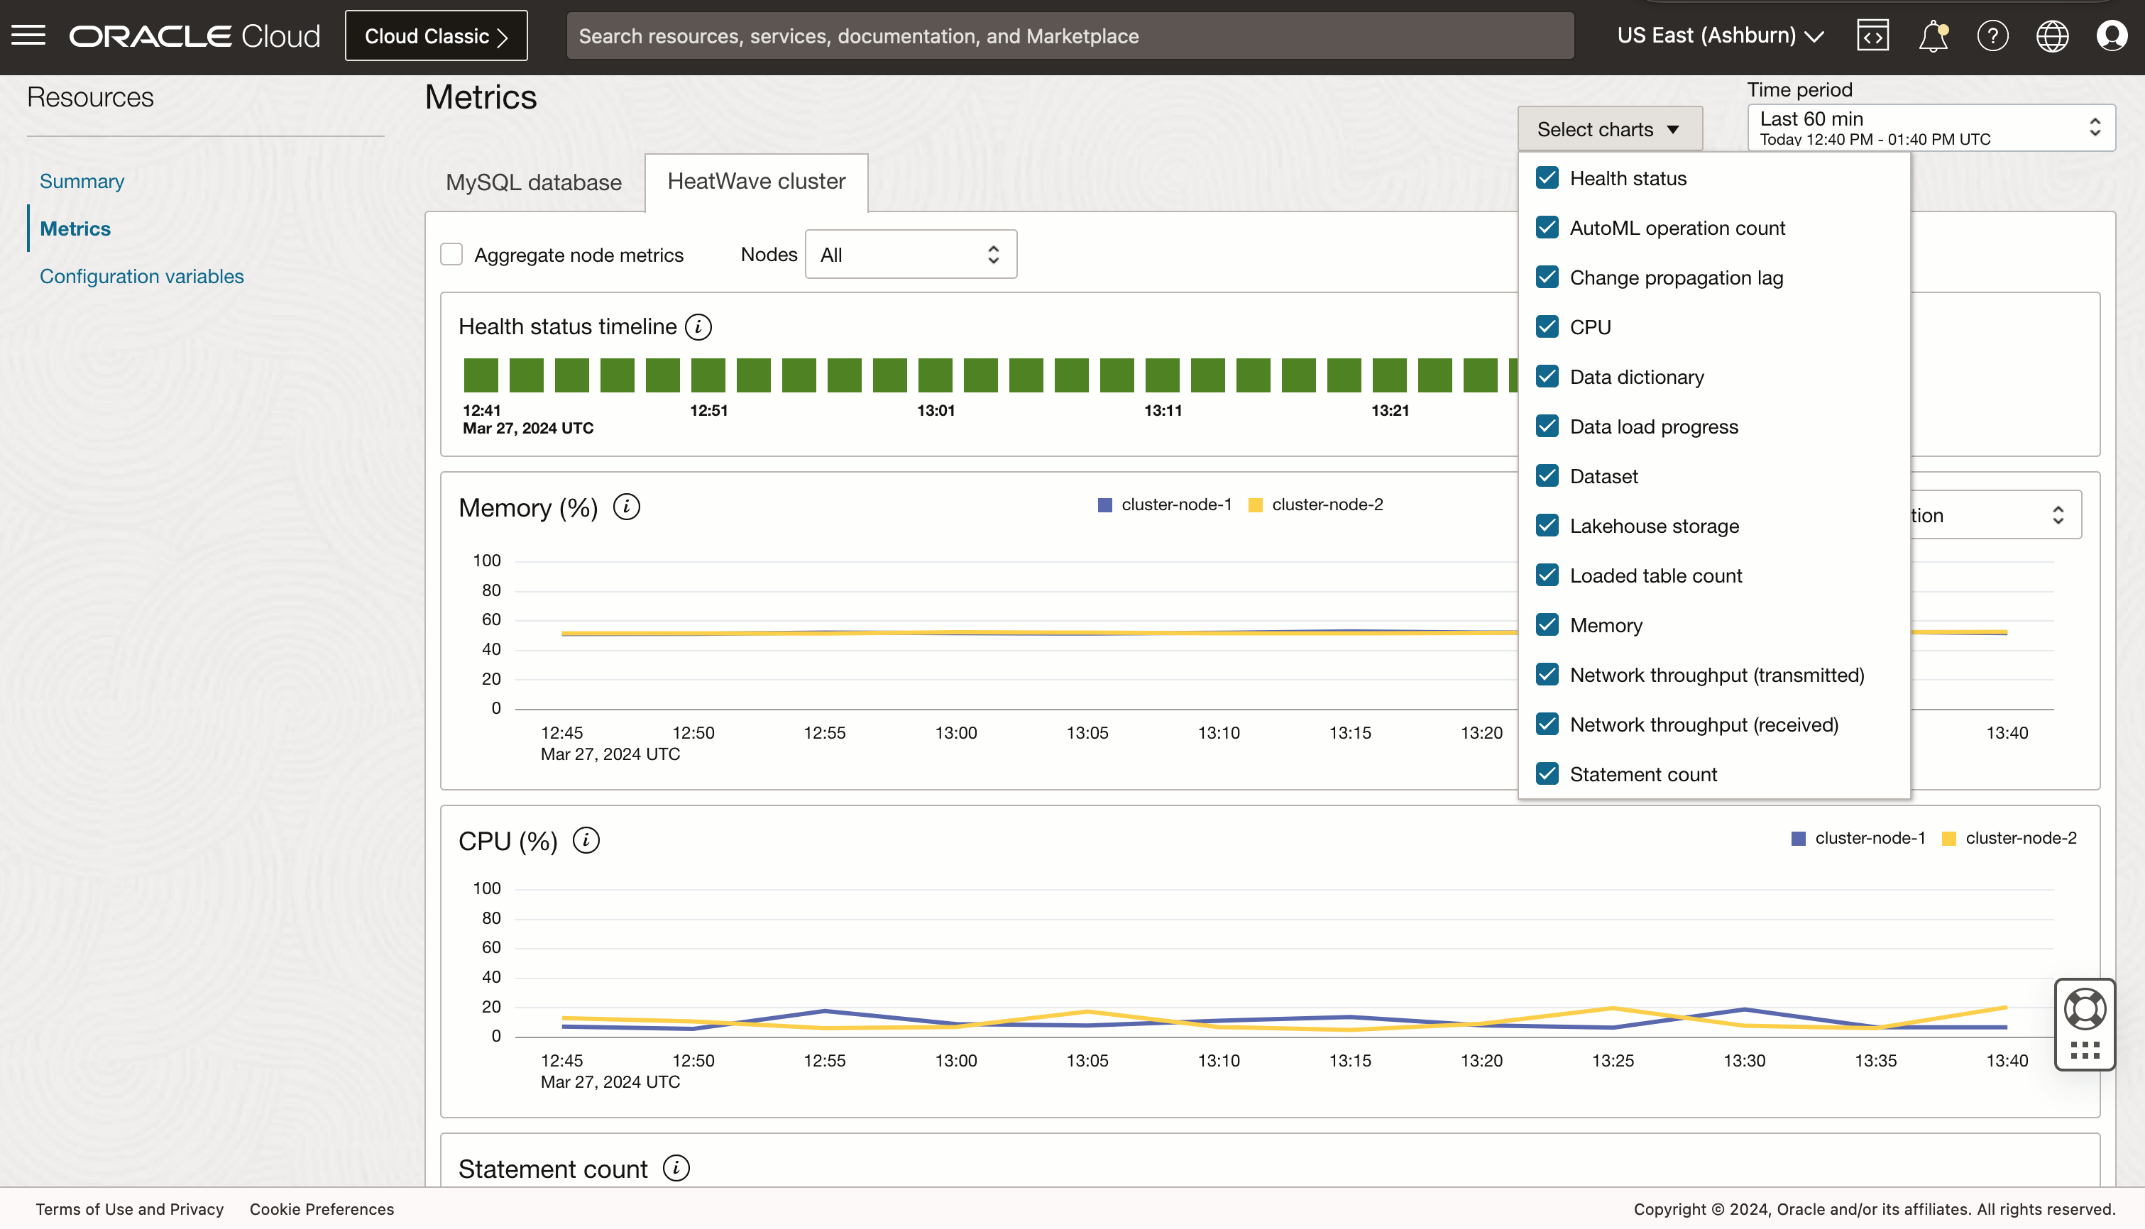
To monitor a comprehensive range of HeatWave cluster metrics and analyze data using various indicators, follow these steps:
- Click on Metrics in the left pane under Resources
- Next, select the HeatWave cluster tab
- Here, you’ll find charts that include those displayed in the Summary section, as well as additional metric charts such as Network throughput.
If you’d like to customize the metrics displayed, use the Select charts drop-down list next to the Time period field.
Performance Hub
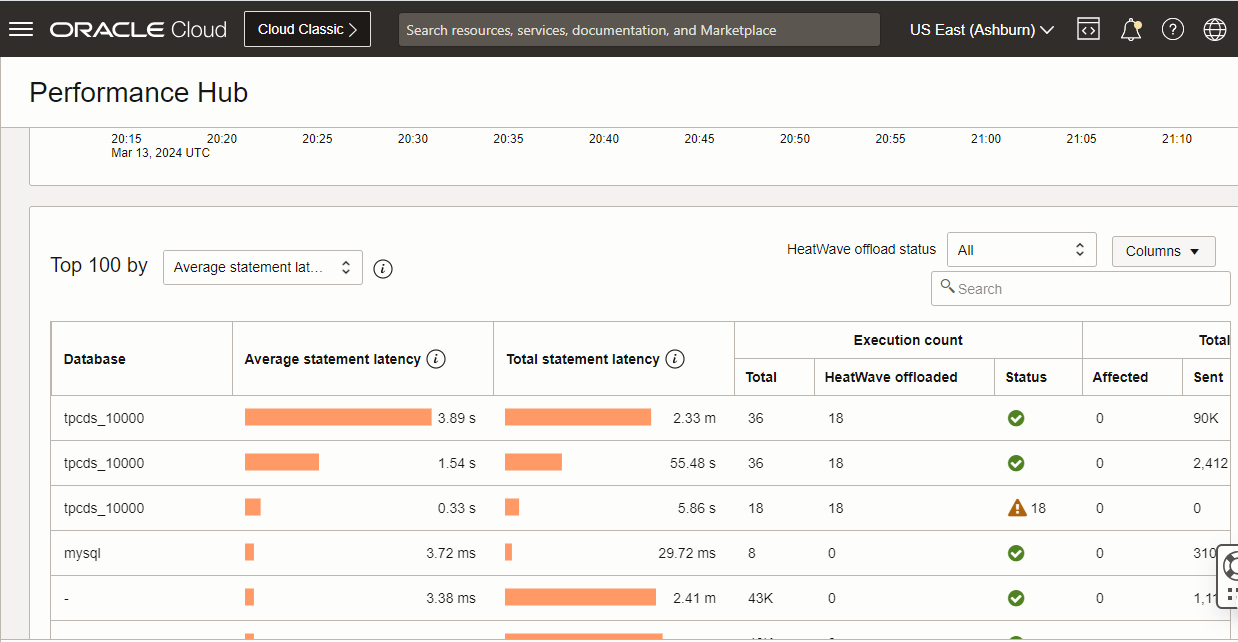
The Performance Hub enables developers and DBAs to quickly improve the performance of their database applications by monitoring query performance. You can accurately pinpoint SQL code that is the root cause of a slow down by making use of the rich graphs. The graphs support drilling down into detailed query information that provides significantly better visibility into database performance issues. With Performance Hub, developers can improve SQL code during active development as well as continuously monitor and tune queries running on production systems.
For Heatwave-enabled MySQL DB Systems, Performance Hub provides an overview of the total number of SQL statements executed and the count of SQL statements offloaded to HeatWave for execution during the selected time period.
Get started today!
You can find Database Management under the Observability and Management menu in the Oracle Cloud Infrastructure Console. The service is accessible through the Console, CLI, and REST API. Database Management for MySQL Heatwave is available in all commercial with availability of Government regions coming soon.
Database Management is available to use with MySQL Heatwave Database service in OCI. Support for MySQL Databases on-premises is coming soon.
Sign up for an Oracle Cloud Infrastructure trial account! For more information about this feature and how to use it, see the documentation.