In the previous part, we created our application and our 2 functions.
Now we need to create an API Gateway to be able to call these functions from outside OCI. Using a third party scheduler, our laptop, etc…
Before creating the gateway, we need to create some policy to allow the API Gateway to call our functions. I’ve tried to create the policy after, it seems to not work as expected.
Security
Dynamic Group
We need to create a Dynamic Group that will match our gateway:
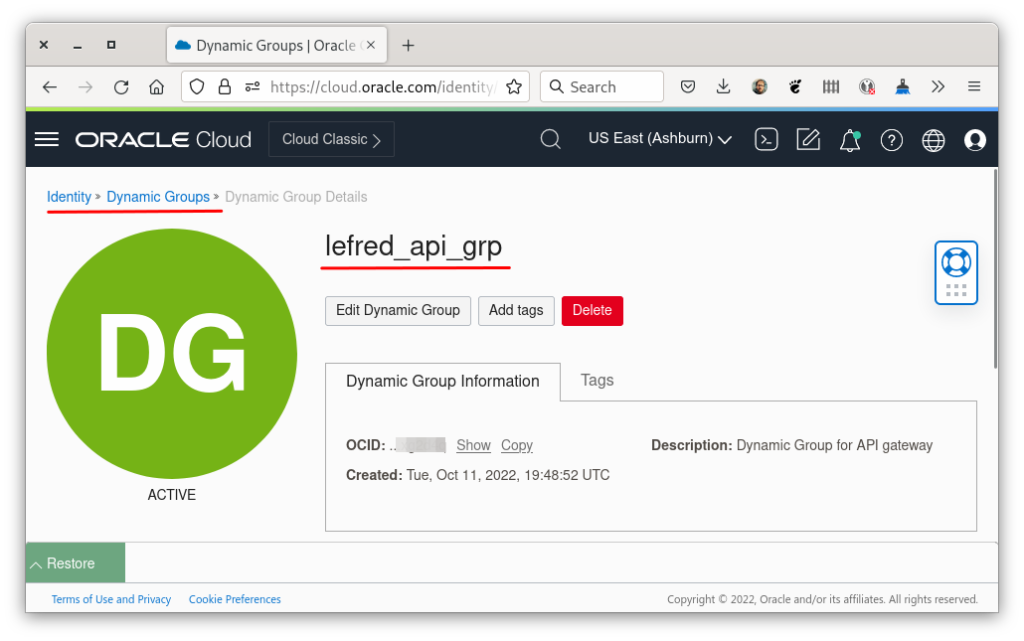
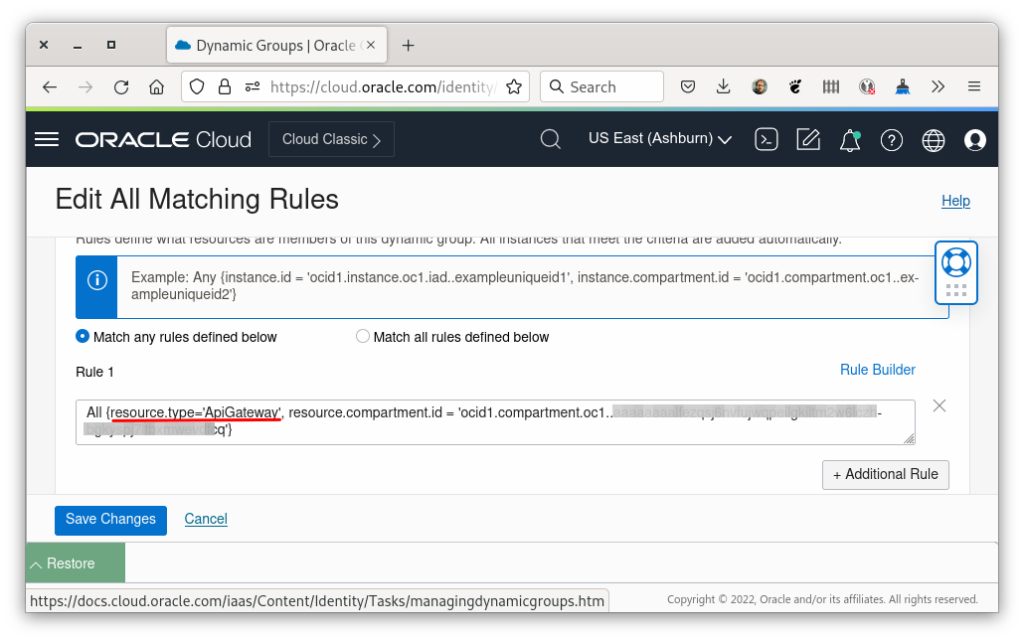
ApiGateway and my compartment’s id:
All {resource.type='ApiGateway', resource.compartment.id = 'ocid1.compartment.oc1..xxxxxxxxx'}Policy
Now that we have created the dynamic group, we need to create a policy: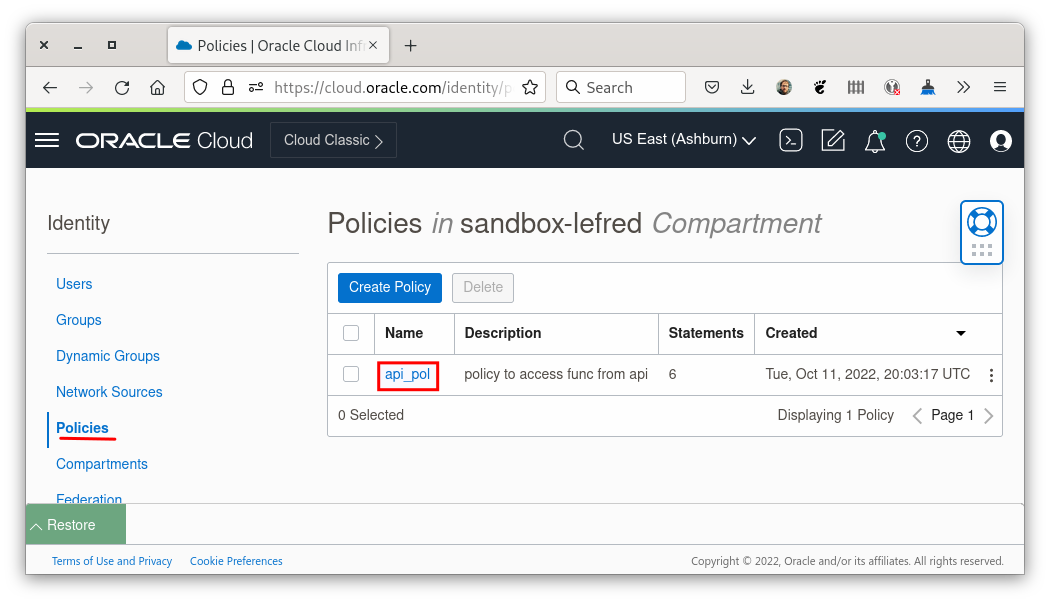
The Policy Statements are sentences describing what is allowed:
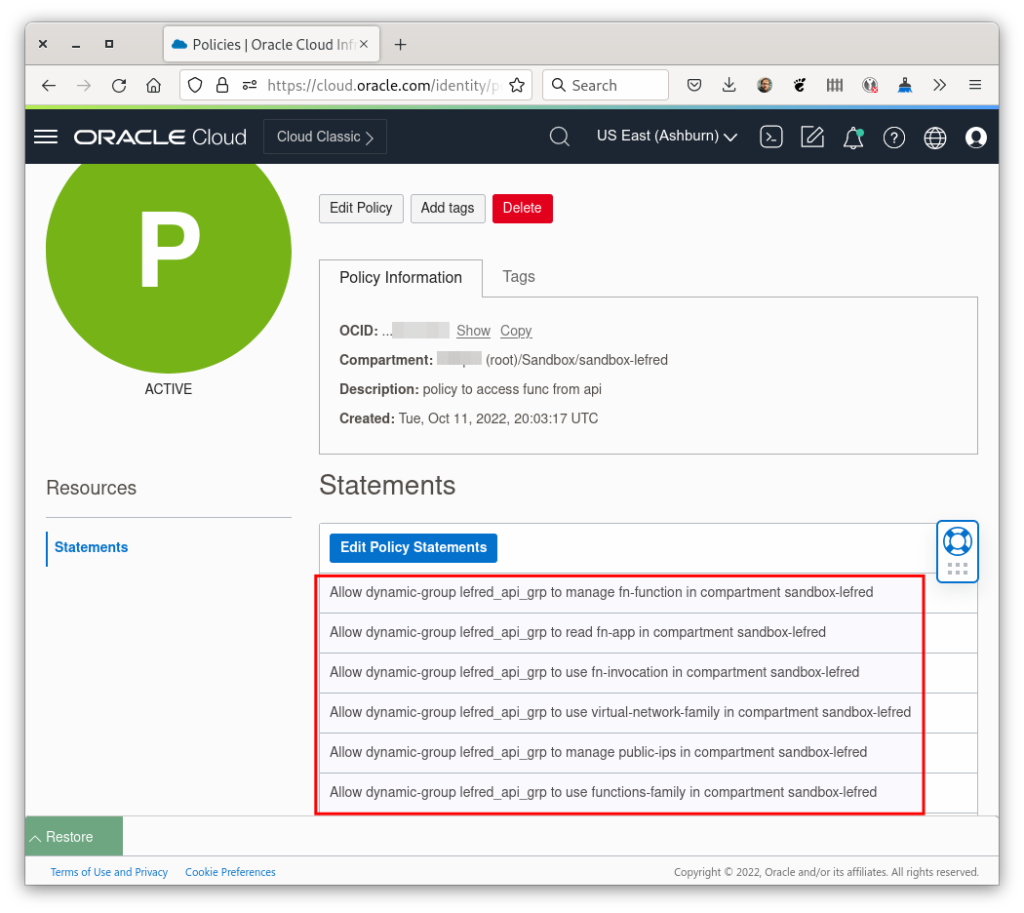
These are my statement in text, lefred_api_grp is the dynamic group’s name and my compartment is sandbox-lefred. You need to replace them by yours:
Allow dynamic-group lefred_api_grp to manage fn-function in compartment sandbox-lefred
Allow dynamic-group lefred_api_grp to read fn-app in compartment sandbox-lefred
Allow dynamic-group lefred_api_grp to use fn-invocation in compartment sandbox-lefred
Allow dynamic-group lefred_api_grp to use virtual-network-family in compartment sandbox-lefred
Allow dynamic-group lefred_api_grp to manage public-ips in compartment sandbox-lefred
Allow dynamic-group lefred_api_grp to use functions-family in compartment sandbox-lefred
API Gateway
We have everything we need to create our API Gateway and defines the routes to call our functions: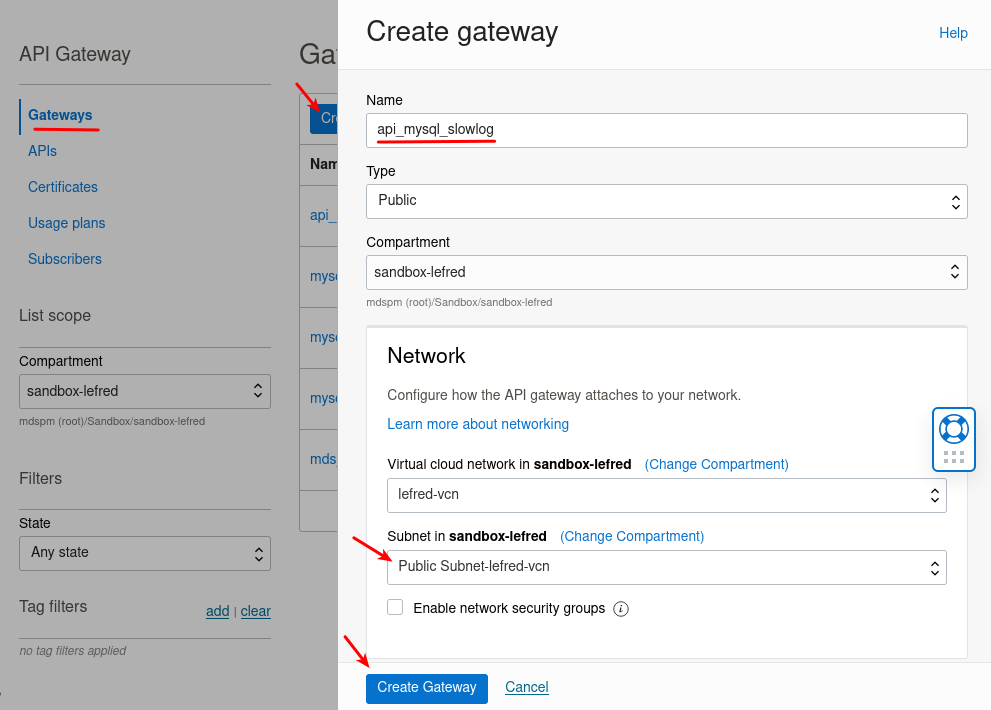
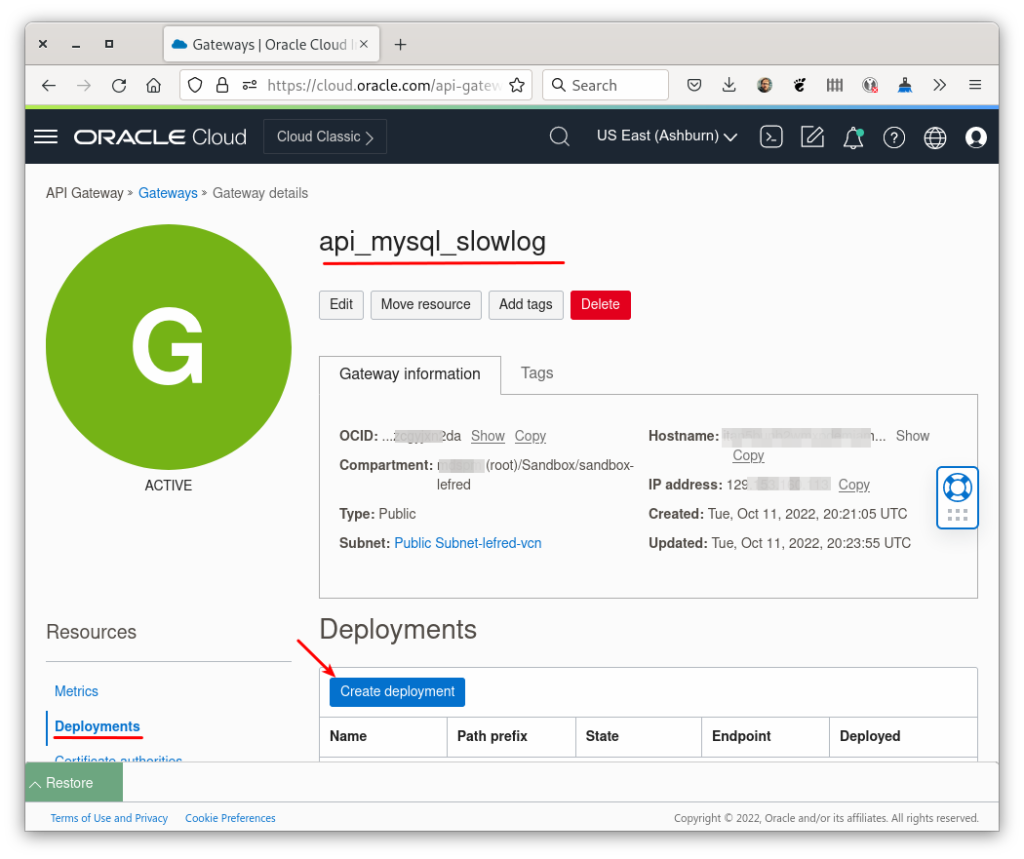
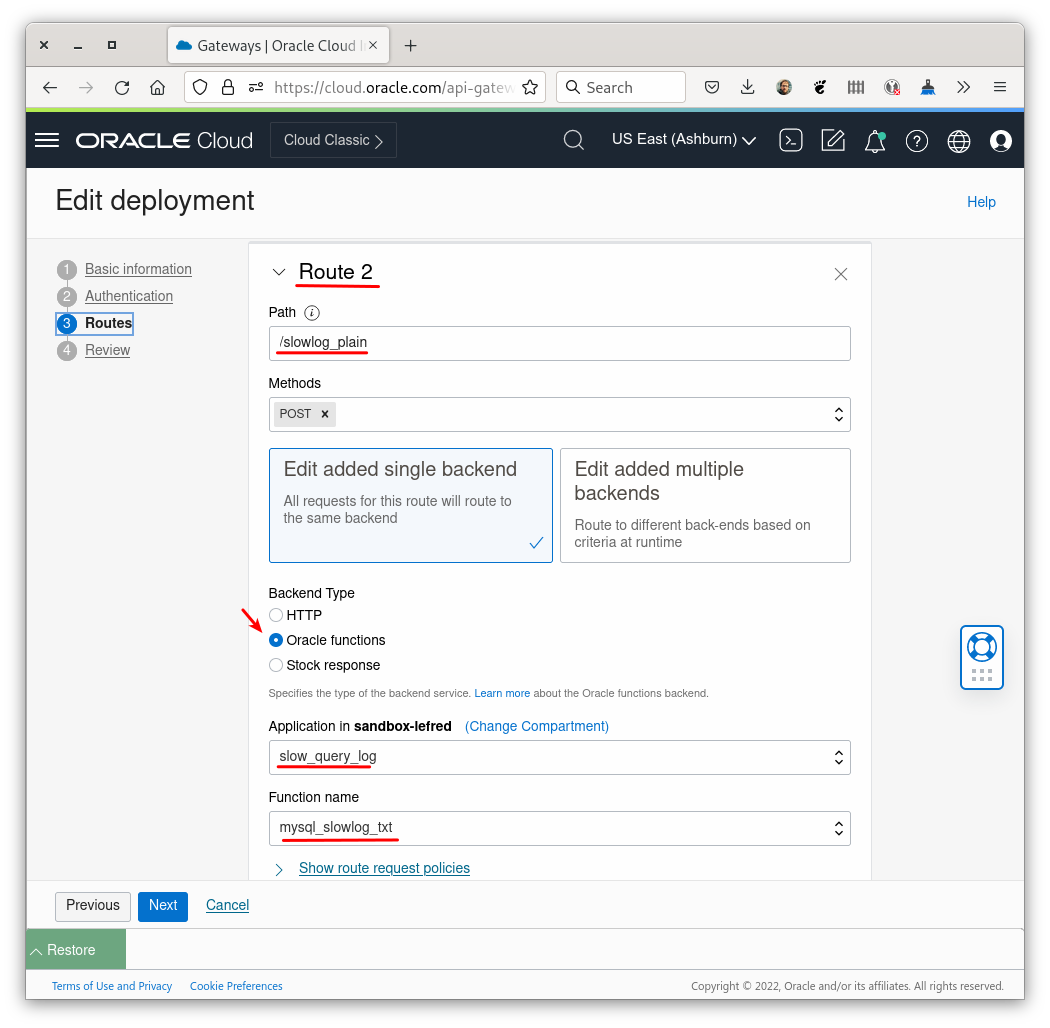
Once the Gateway is active, we can create a deployment:
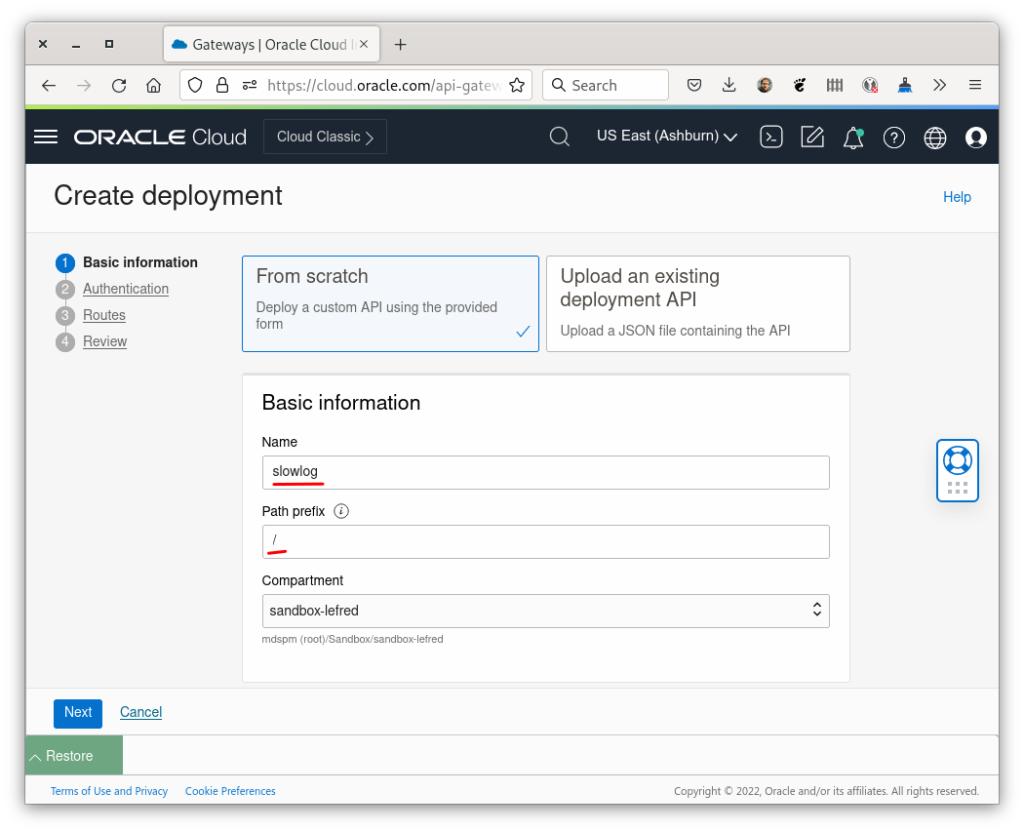
To not make it too complicate, I’m bypassing the authentication.
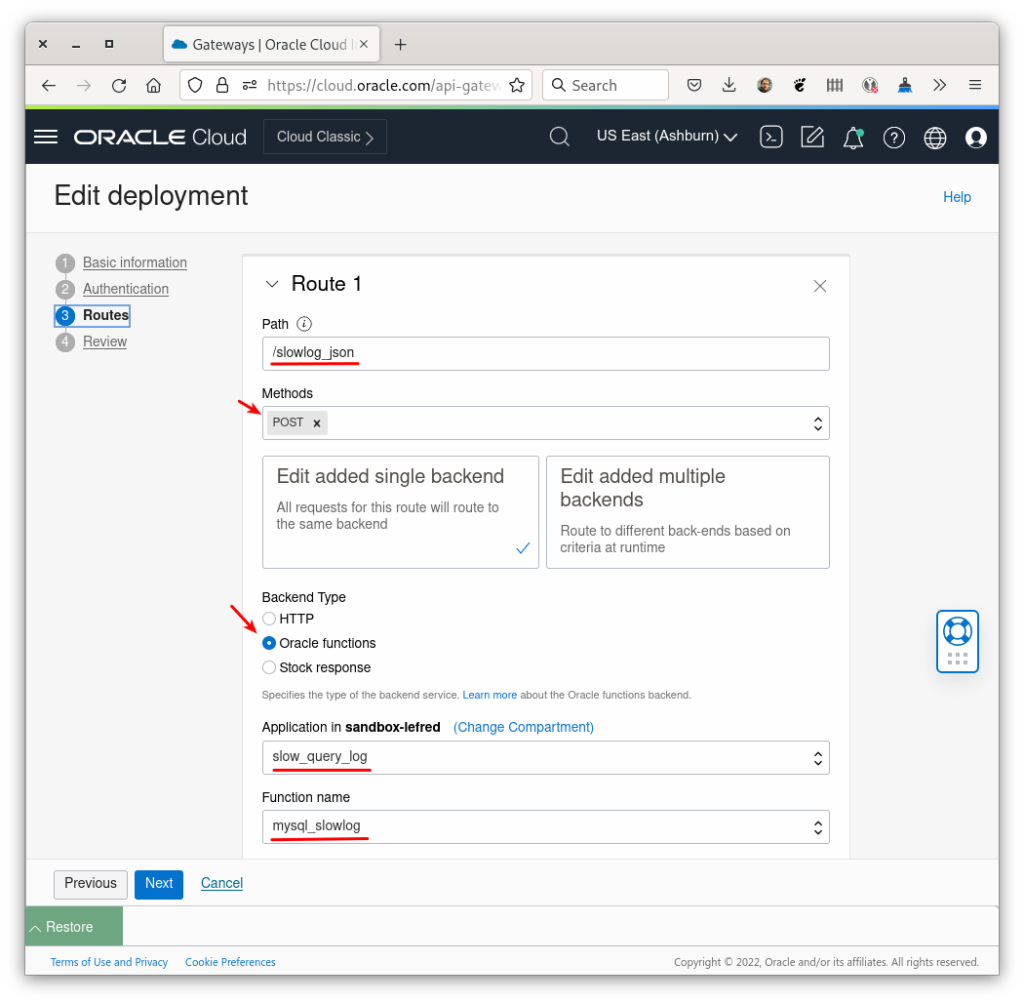
And we need to define two routes:
/slowlog_json: to call the export in JSON/slowlog_plain: to call the export of a plain text slow query log
Using the API Gateway
Now we can use the API with curl for example like this, from my laptop, replace the xxxxx by your gateway’s endpoint:
$ curl https://xxxxx.apigateway.us-ashburn-1.oci.customer-oci.com/slowlog_plain \
  -X POST -H 'Content-Type: application/json' -d '{"mds_host": "10.0.1.127",
  "mds_user": "admin", "mds_port": "3306", "mds_password": "Passw0rd!",
   "mds_name": "lefred-mysql"}'
{"message": "MySQL Slow Log saved: slow_lefred-mysql_202210140748.log"}
And the file is now available in Object Storage:
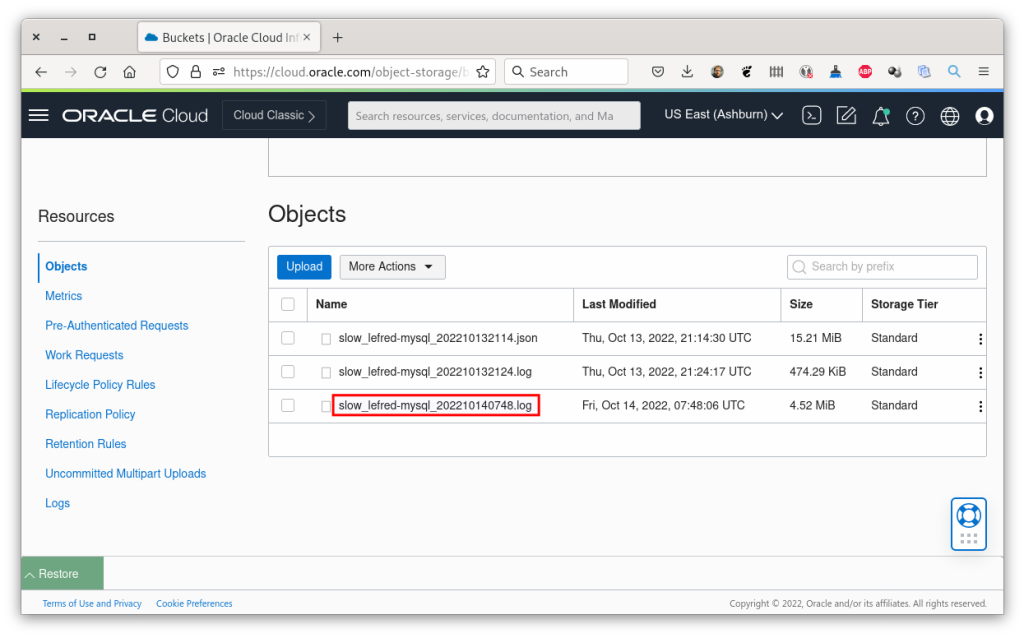
We can download the file and use it with pt-query-digest for example: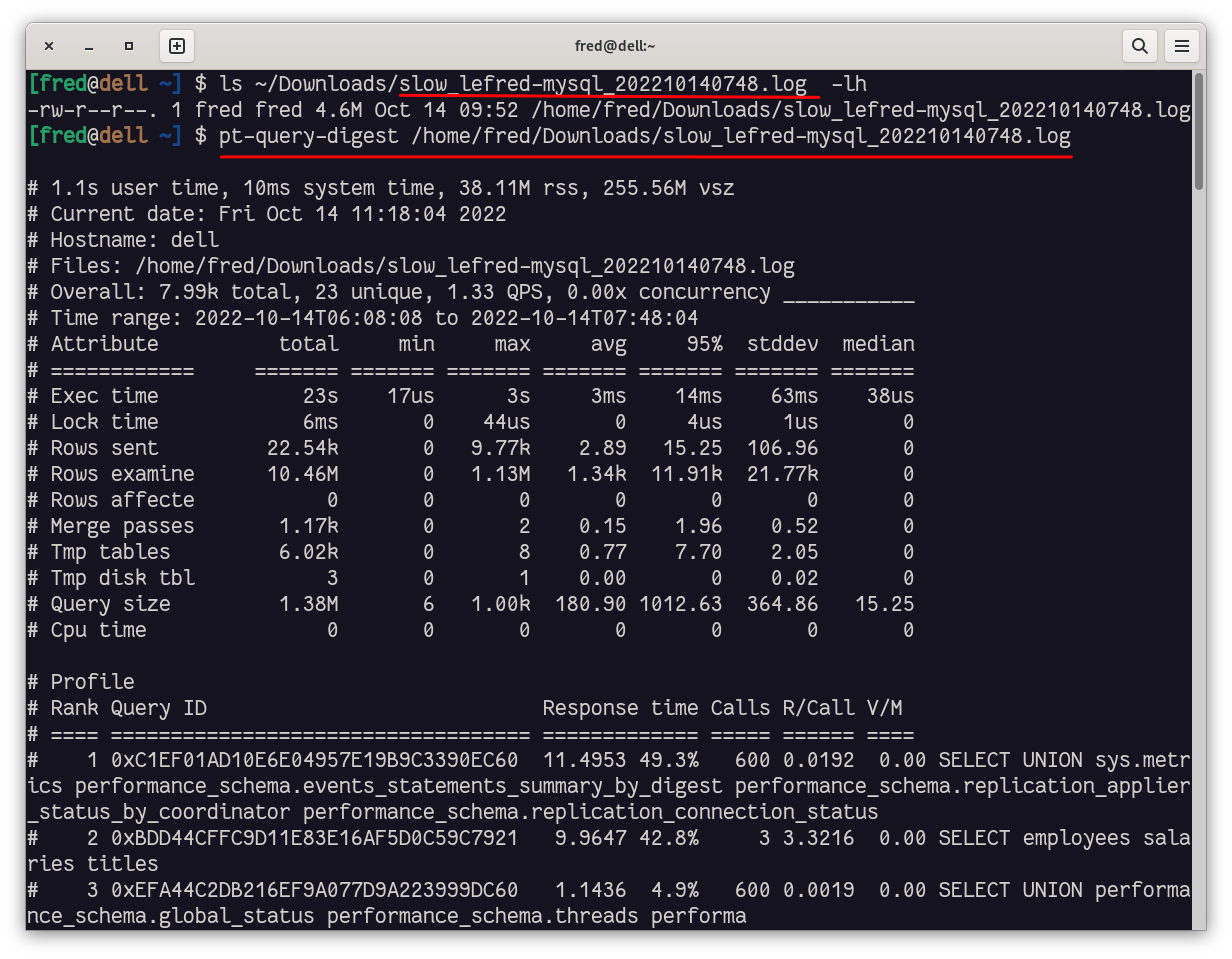
We can also get the JSON file and use it with other third party tool. This is an example of the file opened in Firefox:
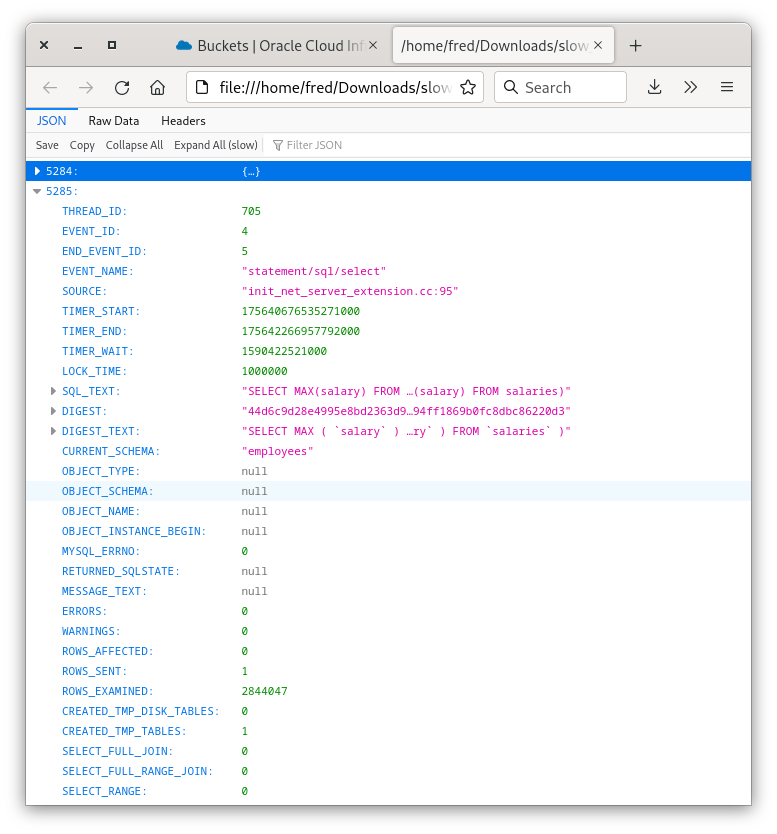
The output also contains information like on which engine was the query executed, InnoDB (PRIMARY) or HeatWave (SECONDARY):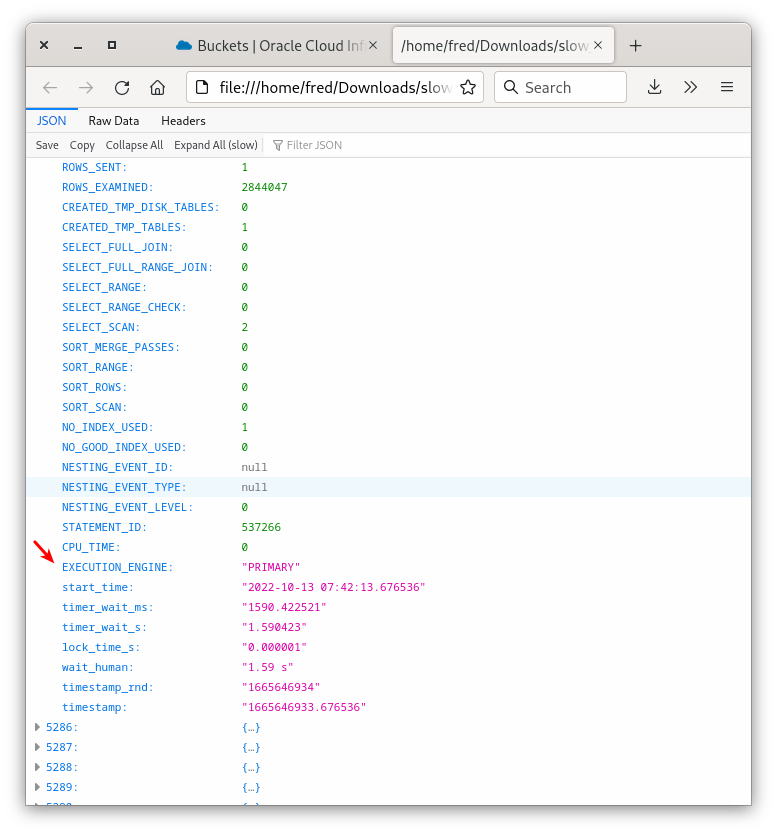
This is an example of Grafana Loki when loading those generated JSON files:
Scheduled Dumps
It is possible to call the application from external tools like EasyCron or Cronless.
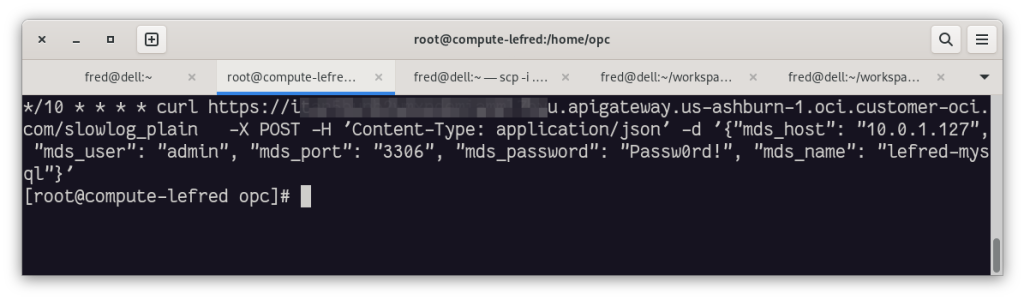
I’ve decided to use a cronjob directly from my Always Free Ampere instance. This cronjob is calling the /slowlog_plain route every 10 mins:
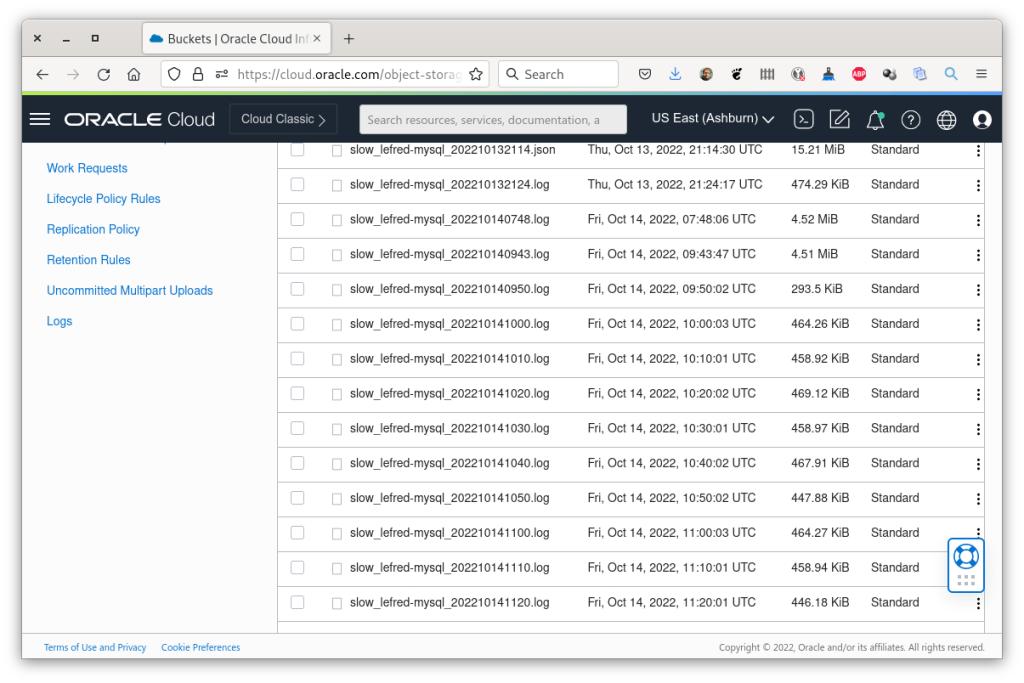
If we check the cron daemon’s output, we can see the list of generated files:
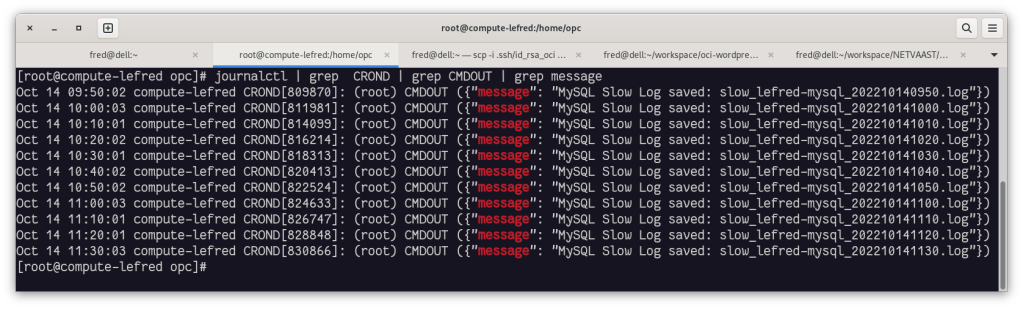
We can see that all to logs are sent to Object Storage:
Limitations
Using this method to export slow query log information from the MySQL Database Service has some limitations. But in general, the reported information should be more than sufficient to have a decent overview of the workload.
These are the limitations:
- only 10,000 entries can be maintained in the
Performance_Schemahistory table (performance_schema_events_statements_history_long_size), this is why you need to schedule your dump with intervals to avoid reaching 10k statements. This might be impossible in very busy systems. - the SQL text returned can be truncate as it’s limited to 1024 characters in MySQL Database Service and cannot be increased (
performance_schema_max_sql_text_length)
Conclusion
This method allows the MySQL DBA to easily retrieve slow query log information directly from Object Storage for all MySQL database instances running on OCI.
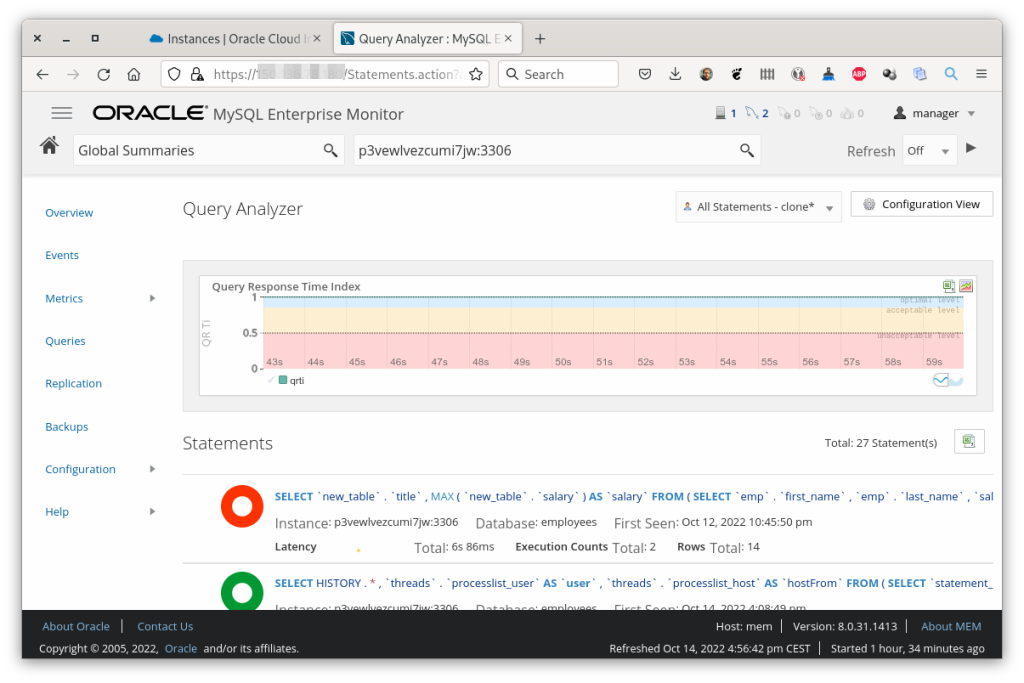
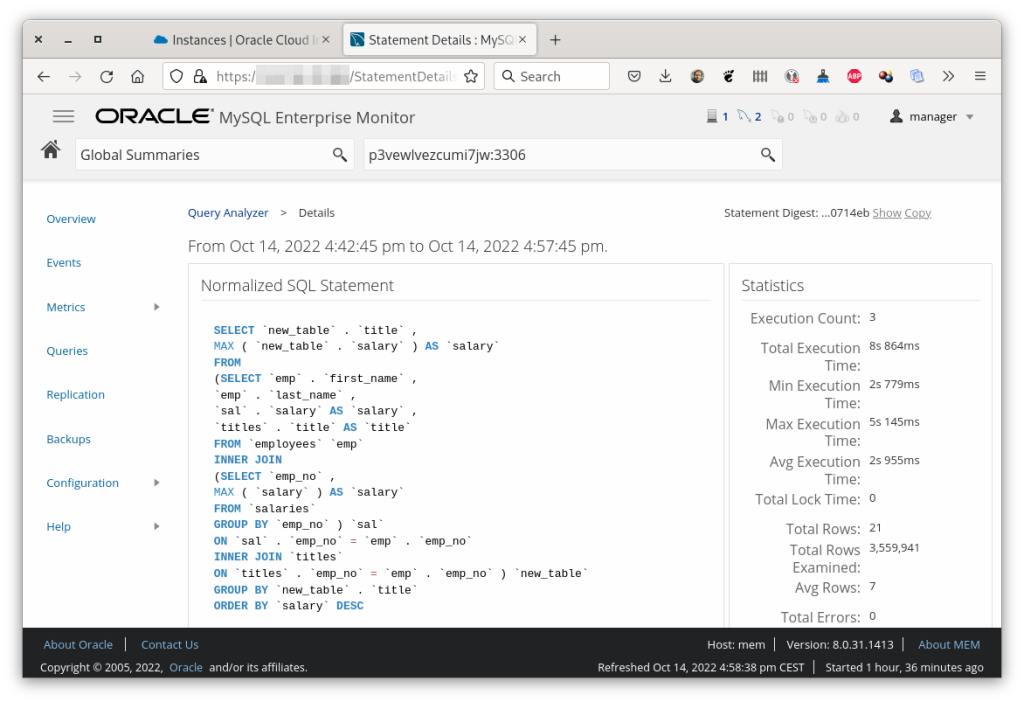
This approach may not be suitable for large workloads. If you need more information about your workload in OCI and want to get details about your readings, I recommend using MySQL Enterprise Monitor (MEM) or any other third-party tool on a Compute Instance in your Tenancy.
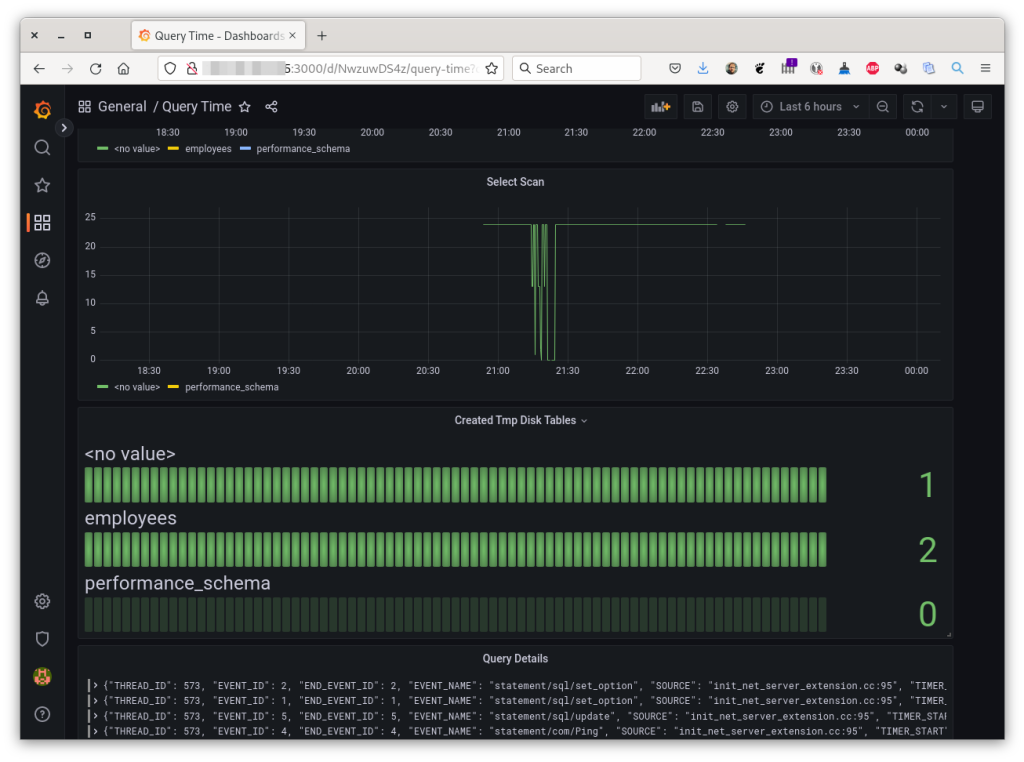
Examples of MEM Queries Dashboard:
Enjoy MySQL and happy query optimization !