Getting a task’s preferred node correct is critical to performance in a NUMA based system.
What exactly is NUMA?
NUMA stands for Non-Uniform Memory Access. From the perspective of a task running on a CPU, this implies that there is “near” memory and at least one if not multiple tiers of “farther” memory, “near” and “far” here indicating different memory access times, the time it takes to load the cache-line containing the memory address. The cache itself, is the best defense against the performance impact of “far” memory accesses as a hit in some level of the cache can completely remove the cost of the physical memory access. The degree to which the cache ultimately helps is generally dependent on various characteristics of the task, such as number of memory accesses and the access pattern.
NUMA Awareness of the Scheduler
Given the definitions above it seems clear that memory access performance should be better when scheduling tasks on a ‘near’ memory node versus ‘far’ and we should be able to demonstrate the scheduler’s NUMA “awareness” with experimental data. Included are measurements from a NUMA micro-benchmark developed to measure this “awareness”. There is also a special focus in the data on large ‘DMA-pinned’ RDMA buffers as DMA regularly invalidates the corresponding cache-lines and performance critical tasks accessing these buffers benefit by sharing the node with those buffers. Measurements are presented for three distinct CPU architectures, Intel, AMD, and ARM64.
How Does NUMA Work in the Linux Scheduler
The essence of NUMA awareness in the scheduler depends upon the struct task_struct field numa_preferred_nid. The value in this field is used in task placement decisions primarily by load-balancing and with lesser effect in the wake-up slow path.
The load balancer moves load (load here being CPU consumption on behalf of a task[1]) to prevent the over-loading of CPUs and roughly balance out the run-queue depths in the system[2]. This is done by determining which tasks to move from busy CPUs to less busy based on prior observed load. One simple solution would be to gather the load/capacity for every CPU in the system, do some math and then do some moves – simple but unacceptable performance on any large heavily loaded system while also completely ignoring the cache hierarchy.
The Linux solution uses the concept of scheduler domains[3], CPU groupings arranged in a tree hierarchy that roughly mimics the underlying hardware architecture. Each group tracks the load and capacity of its children meaning that load/capacity comparisons happen among the siblings of that domain.
Conceptually, load balancing begins by evaluating potential task movements in the lowest level domain[4] (among the the sibling groups), rising up through each level in the hierarchy until finding a sibling group with sufficient capacity and then proceeding down that tree ultimately ending at a new CPU. This mechanism also results in a tendency to keep tasks under a particular cache or node as they are generally represented by domains in this hierarchy. For reference, the scheduling domains of each platform will be shown below with its data. The issue however, given that the default value of numa_preferred_nid is -1 (no preference) is that the load balancer lacks the information needed to make any NUMA aware decision at all and unfortunately with Auto-NUMA-Balancing off, there is no means of setting numa_preferred_nid to any useful value. The patches mentioned below have been included as a preview in Oracle’s UEK8 release to enable customer’s and developers to test the benefits. Like much in the system, behavior and subsequent performance deltas are work load dependent.
Auto-NUMA-Balancing
Auto-NUMA-Balancing (ANB) is a mechanism using the temporary removal of blocks of virtual addresses in a task’s address space and the resulting faults and corresponding physical addresses to determine the accessed memory node. This allows a task’s numa_preferred_nid to track the most heavily accessed node. The size of the regions to unmap and the frequency of the scans can be controlled via a debugfs interface. All results here used the system defaults. As is typical with the scheduler there is often a trade-off between all of this tracking overhead and the measured benefit.
The original stated design requirement for ANB was the ability to ‘migrate’ (memory copy) the physical pages of a task in order to consolidate memory onto a prior determined numa_preferred_nid memory node. DMA-pinned buffers, being unmovable (as some DMA engine likely has the physical address) are thus not monitored. One major issue that this can cause is given a task whose primarily function is accessing a DMA-pinned buffer, the only ANB monitored memory accesses are for everything but the buffer, potentially causing the wrong node to be “preferred”. While ANB can provide benefits, its value is workload dependent and is often off especially as it is a global system-wide kernel setting which containers cannot hide.
Description of the Experiment
Description of the Kernel
The kernel used in these tests is Oracle UEK8, 6.12 and contains two patches which provide a prctl() which enables directly getting/setting a task’s numa_preferred_nid to the preferred node number or -1 for no preference.
The implementation requires that Auto-NUMA-Balancing be enabled though the faulting behavior can be effectively disabled by adjusting scan frequencies and memory range sizes. However as physical page migration is tightly coupled with ANB scanning, it is a trade-off between faulting overhead and the benefits of memory consolidation.
-
Kernel Interface:
A simple prctl() is used that allows setting a numa_preferred_nid for any of the user’s pids.
#define PR_PREFERRED_NID                101
# define PR_PREFERRED_NID_GET           0
# define PR_PREFERRED_NID_SET           1
# define PR_PREFERRED_NID_CMD_MAX       2

    int prctl_chg_pref_nid(unsigned long cmd, int nid, pid_t pid, unsigned long uaddr)
cmd is either PR_PREFERRED_NID_SET or PR_PREFERRED_NID_GET and in the case of get, uaddr should be a pointer to a user space unsigned long long.
If pid == 0, then use current task for the set or get operation.
This value is not inherited by a task’s children.
-
User Space Code Example:
    if (prctl(PR_PREFERRED_NID, PR_PREFERRED_NID_SET, pref_nid, 0, 0) < 0)
            handle_error("setting preferred NID failed");
Other Environmental Settings
NUMA Balancing Parameters (system default):
    kernel.numa_balancing : 1
    kernel.numa_balancing_promote_rate_limit_MBps : 65536
    hot_threshold_ms: 1000
    scan_size_mb: 256
    scan_period_max_ms: 60000
    scan_period_min_ms: 1000
    scan_delay_ms: 1000

migration_cost_ns: 500000 (system default)
Description of the Micro-Benchmark
An upcoming blog will describe in detail and provide source for the micro-benchmark. For purposes here, the micro-benchmark consists of a task, the probe, running in an environment that encourages the scheduler to schedule. The probe itself, simply measures the time required to complete a large number of memory accesses to an allocated buffer and is run with various settings of bound/unbound memory and node affined/unaffined tasks as described in the below Table Data Key. Additionally, the nature of the micro-benchmark (meaningful results in relatively short time) allows complete tracing of all of the probe’s CPU migrations and some of this data is shown as well.
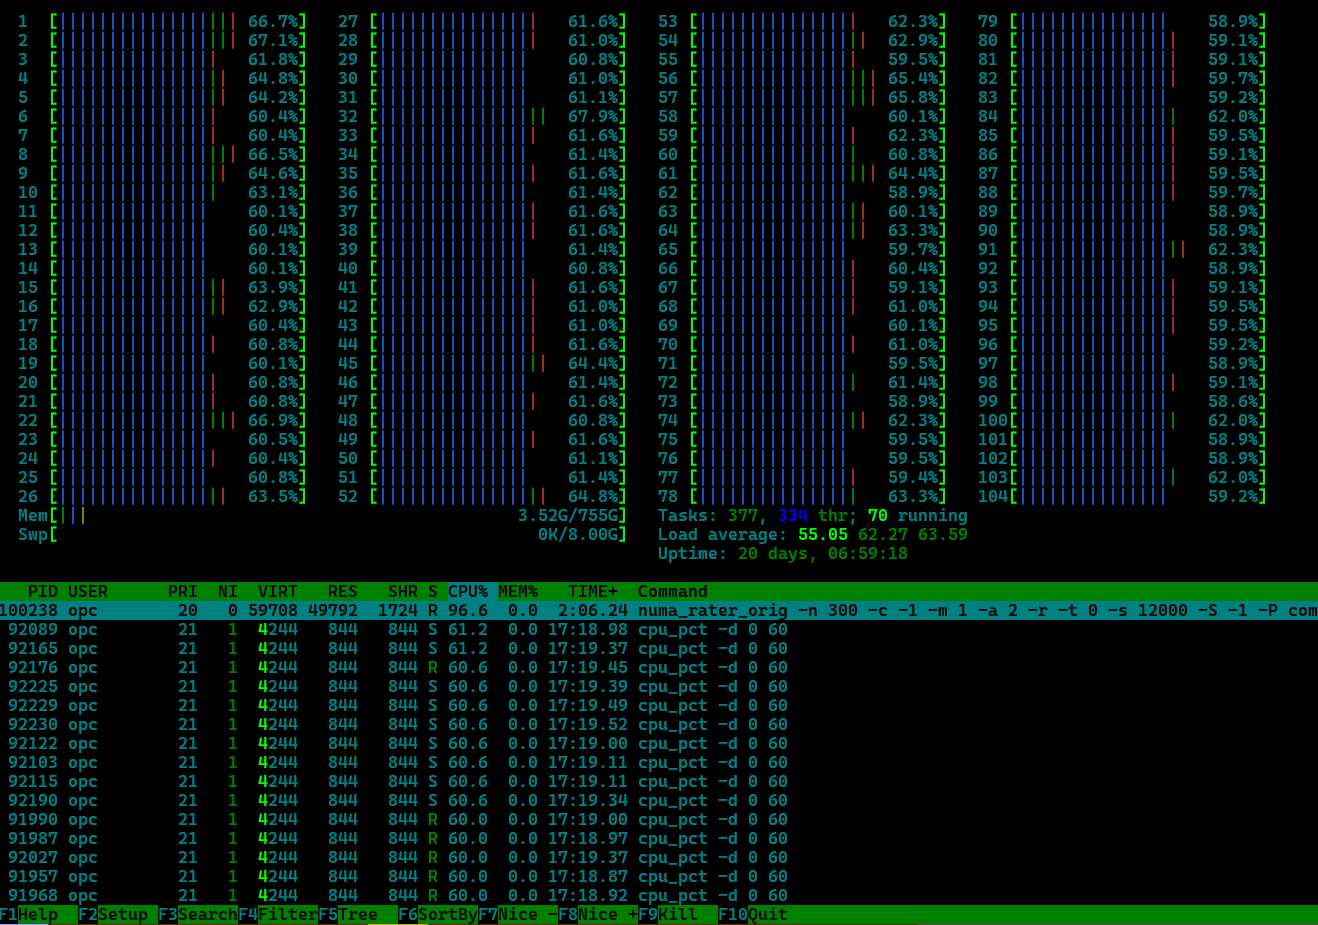
The core idea behind the micro-benchmark was that if near versus far memory accesses account for bad NUMA performance, there should be a way to isolate and focus on just that. Take away inter-process communications, locks, syscalls, I/O etc, that otherwise complicate the scheduling and replace it with a task, the probe, which simply measures the duration of a large number of memory accesses in an extremely tight loop. The idea itself is certainly not novel, but unfortunately by itself also tells us very little. On an otherwise idle system, the probe likely will be parked on a CPU and essentially stays there. The key to making the probe measure scheduler placement decisions is to force the scheduler to actually make placement decisions. This is accomplished by pinning a task on each CPU that consumes a fixed percent of cpu, in these tests 60%, but the actual load ultimately does not matter so much as the load periodically waking-up thus preempting the probe. At the same time there are almost always idle CPUs in the system (their pinned load task sleeping). Much scheduling then ensues.
The below htop snapshot shows the general idea and testing environment.
Description of the Results
One of the more noticeable results below is that on two of the architectures, a task allowed to float (non-affined) accessing bound memory actually performs worse than hard-affining the task on a different memory node!!! Trace results from the Intel test machine are included below to explain this.
The short summary of the below results are that without Auto-NUMA-Balancing enabled, there is NO NUMA awareness in the scheduler and that ANB alone will not solve the DMA-pinned buffer problem. However, in those instances where the location of these buffers can be otherwise determined, the ability to set a preferred node for the tasks accessing these buffers can bring substantial benefit.
Table Data Key:
- PNID – the prctl() “forced” numa_preferred_nid, ie ‘Preferred Node Affinity’. (given 2 nodes: 0, 1, and -1 for not set).
- NB – auto-numa-balancing (0 – off, 1 – on).
- Mem – represents the Memory node when memory is bound, else ‘F’ floating, ie not set.
- CPU – represents the CPUs of the node that the probe is hard-affined to, else ‘F’ floating, ie not set.
- Scale – that average time as a ratio over the shortest average time. The scale of the shortest average is thus 1.
- Avg – the average time of the probe’s accesses measured in secs.
- Max – the maximum time of the probe’s accesses measured in secs.
- Min – the minimum time of the probe’s accesses measured in secs.
- Stdv – the standard deviation. Large standard deviations represent the variability in how the scheduler schedules over a large number of runs.
There is an intentional amount of redundancy in the experimental results as an internal consistency check. For example the measured time for task and memory bound to the same node should be statistically the same whether both are bound to node 0 or node 1). Similar with cross-node results. Color-coding is used below to help make this clear.
Interpretation of the Colors:
- Tasks affined to the same node as memory is bound.
- Tasks affined to a different node than memory is bound.
- Tasks unaffined to any node (floating) with memory bound to a specific node. Simulate DMA-pinned memory.
NUMA Experimental Results – Three Architectures
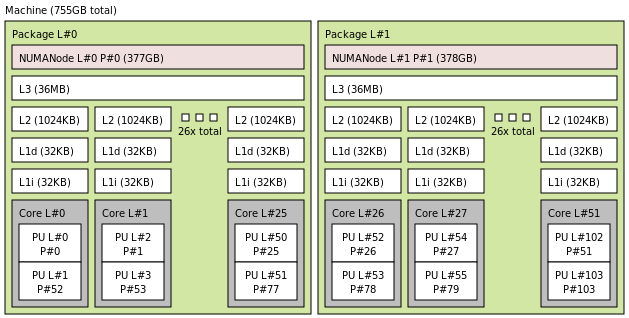
Intel(R) Xeon(R) Platinum 8167M CPU @ 2.00GHz
Scheduler Domain Topology (Two Example CPUs)
cpu0
domain0   SMT    00,00000000,00100000,00000001 -- [0,52]
domain1   MC     00,00003fff,fff00000,03ffffff -- [0-25,52-77]
domain2   NUMA   ff,ffffffff,ffffffff,ffffffff -- [0-103]

cpu53
domain0   SMT    00,00000000,00200000,00000002 -- [1,53]
domain1   MC     00,00003fff,fff00000,03ffffff -- [0-25,52-77]
domain2   NUMA   ff,ffffffff,ffffffff,ffffffff -- [0-103]
Hardware Topology
Experimental Results
Number of samples: 60
The obvious benefit of setting a task’s numa_preferred_nid to the node containing the memory buffer can also be shown by comparing the number of cross-node migrations.
The below tables show two representative sample results from ‘ftracing’ the CPU migration events of the probe during the micro-benchmark run. These migrations are then categorized as ‘same-core’, ‘same-node’ or ‘cross-node’. The first table shows the base same-node/cross-node results. (The one cross-node migration is to get to the right node when the probe hard-affines itself.)
| CPU: 0, Mem: 0, NB=0, PNID=-1 | |
|---|---|
num_migrations_samecore : 846 num_migrations_samenode : 2442 num_migrations_crossnode: 1 num_migrations: 3289 |
num_migrations_samecore : 887 num_migrations_samenode : 2375 num_migrations_crossnode: 1 num_migrations: 3263 |
| CPU: 1, Mem: 1, NB=0, PNID=-1 | |
|---|---|
num_migrations_samecore : 822 num_migrations_samenode : 2156 num_migrations_crossnode: 0 num_migrations: 2978 |
num_migrations_samecore : 886 num_migrations_samenode : 1982 num_migrations_crossnode: 0 num_migrations: 2868 |
| CPU: 0, Mem: 1, NB=0, PNID=-1 | |
|---|---|
num_migrations_samecore : 1038 num_migrations_samenode : 2892 num_migrations_crossnode: 0 num_migrations: 3931 |
num_migrations_samecore : 1055 num_migrations_samenode : 2824 num_migrations_crossnode: 1 num_migrations: 3879 |
The next table shows the “DMA-pinned” buffer scenario with the probe allowed to float. The first sub-table is the current behavior with Auto-NUMA-Balancing OFF.
| CPU: F, Mem: 0, NB=0, PNID=-1 | |
|---|---|
num_migrations_samecore : 788 num_migrations_samenode : 2251 num_migrations_crossnode: 1738 num_migrations: 4777 |
num_migrations_samecore : 739 num_migrations_samenode : 2292 num_migrations_crossnode: 1500 num_migrations: 4531 |
| CPU: F, Mem: 0, NB=1, PNID=-1 | |
|---|---|
num_migrations_samecore : 663 num_migrations_samenode : 2434 num_migrations_crossnode: 1344 num_migrations: 4441 |
num_migrations_samecore : 657 num_migrations_samenode : 2427 num_migrations_crossnode: 1499 num_migrations: 4583 |
| CPU: F, Mem: 0, NB=1, PNID=0 | |
|---|---|
num_migrations_samecore : 653 num_migrations_samenode : 2954 num_migrations_crossnode: 7 num_migrations: 3614 |
num_migrations_samecore : 665 num_migrations_samenode : 2880 num_migrations_crossnode: 12 num_migrations: 3557 |
We can see that setting numa_preferred_nid to the desired node (where the memory is bound) decreases the number of cross-node migrations by several orders of magnitude and importantly to performance on this machine, a node is also an LLC (last level cache). At the same time we see that this affinity is “soft” in that under heavy local load the scheduler does sometimes migrate the task off of the node making this technique superior to simply hard-affining the task where the load cannot be moved away in the presence of severe local stress and performance suffers.
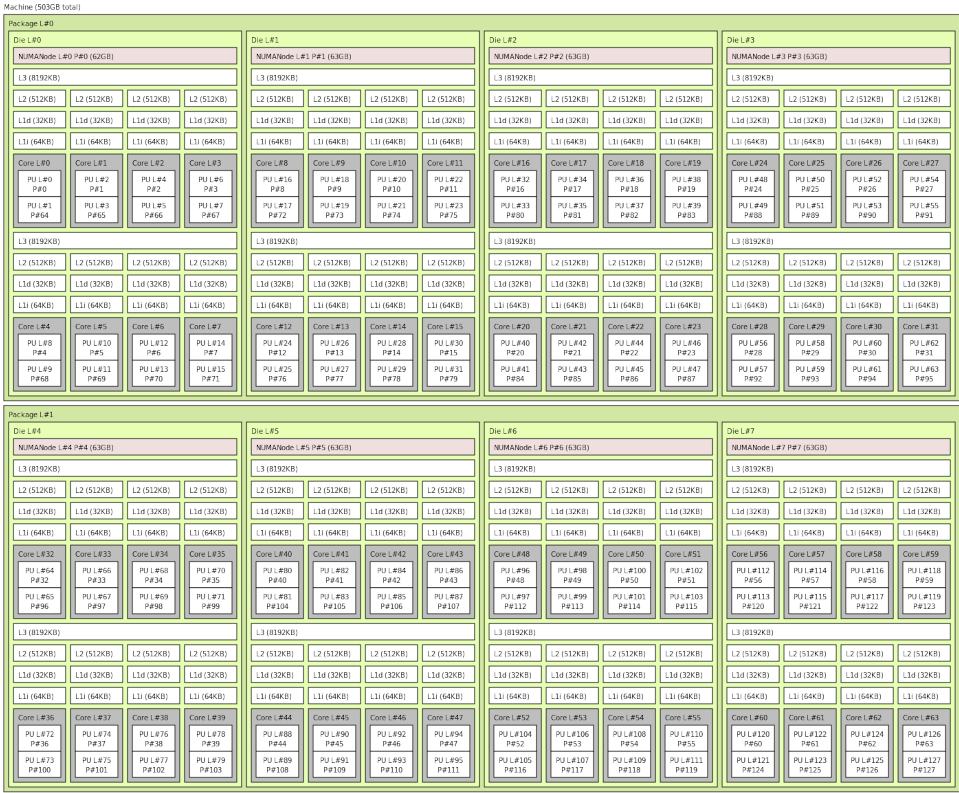
AMD EPYC 7551 32-Core Processor
Scheduler Domain Topology (Two Example CPUs)
cpu0
domain0   SMT    00000000,00000001,00000000,00000001 -- [0,64]
domain1   MC     00000000,0000000f,00000000,0000000f -- [0-3,64-67]
domain2   NODE   00000000,000000ff,00000000,000000ff -- [0-7,64-71]
domain3   NUMA   00000000,ffffffff,00000000,ffffffff -- [0-31,64-95]
domain4   NUMA   ffffffff,ffffffff,ffffffff,ffffffff -- [0-127]

cpu63
domain0   SMT    80000000,00000000,80000000,00000000 -- [63,127]
domain1   MC     f0000000,00000000,f0000000,00000000 -- [60-63,124-127]
domain2   NODE   ff000000,00000000,ff000000,00000000 -- [56-63,120-127]
domain3   NUMA   ffffffff,00000000,ffffffff,00000000 -- [32-63,96-127]
domain4   NUMA   ffffffff,ffffffff,ffffffff,ffffffff -- [0-127]
Hardware Topology
Experimental Results
Number of samples: 60
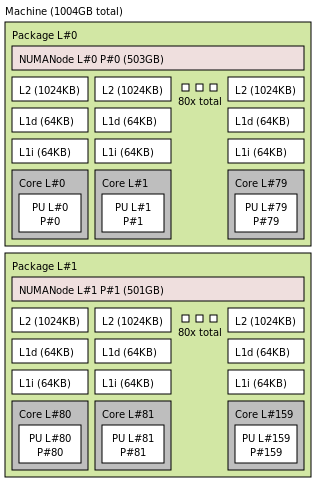
ARM64 Neoverse-N1
Scheduler Domain Topology (Two Example CPUs)
cpu0
domain0   PKG    00000000,00000000,0000ffff,ffffffff,ffffffff -- [0-79]
domain1   NUMA   ffffffff,ffffffff,ffffffff,ffffffff,ffffffff -- [0-159]

cpu80
domain0   PKG    ffffffff,ffffffff,ffff0000,00000000,00000000 -- [80-159]
domain1   NUMA   ffffffff,ffffffff,ffffffff,ffffffff,ffffffff -- [0-159]
Hardware Topology
Experimental Results
Number of samples: 60
Summary
In summary, getting a task’s preferred node correct is critical to performance in a NUMA based system. Two samples from the above Intel data clearly illustrate this. Setting a preferred NID enables NUMA sensitive scheduling that makes the latter 40 seconds faster in a 2 minute run.
CPU: F, Mem: 0, NB=0, PNID=-1
Scale: 1.39  Avg: 165.99, max: 181.60, min: 146.61, stdv: 7.89

CPU: F, Mem: 0, NB=1, PNID=0
Scale: 1.01  Avg: 120.85, max: 151.09, min: 112.46, stdv: 6.88
This is just a micro-benchmark specifically crafted to explore this behavior, but it does show the scheduler’s ability to honor NUMA sensitivities when given accurate information. Extrapolating performance gains from this for real world applications is of course, much harder and workload dependent.
Additionally, the prctl() shows the potential of user space intervention where ANB falls short, though in fairness to ANB, this was not a serious effort to test its effectiveness as the limitation concerning “DMA-pinned” memory made it moot.
References
- Technically a scheduling entity, but ‘task’ will be used for simplicity.
- With load always changing and “correction” often implying destruction of cache footprints, balance is a loose notion.
- https://www.kernel.org/doc/html/v5.4/scheduler/sched-domains.html
- When the lowest level domain is a hyper-threaded CPU, that domain is typically skipped in favor of another CPU given the shared nature of the HW.