Introduction
This is the second of a 3-part series about memory compaction in the Linux kernel. Part one in this series covered why and how the Linux kernel performs memory compaction. This blog builds on that foundation and describes the different kinds of data that the compaction subsystem exposes for debugging and diagnosis.
This diagnostic data is exposed broadly through two kinds of interfaces. The first is a set of tracepoints that provide fine-grained, per-event visibility into compaction behaviour — each tracepoint fires at a specific point in the compaction code path and carries data about what happened at that point. The second is a set of counters, flags, and other metrics exposed through proc and debugfs, providing a higher-level, always-on view of compaction health, even when tracing is disabled. Both mechanisms are described here, along with guidance on how to interpret the data each one provides.
The practical application of this data — including bpftrace/dtrace scripts that attach to the tracepoints described here and shell scripts that collect and interpret the proc and debugfs data — is covered in the next blog in this series.
Like the previous blog, this blog is also based on the v6.18 kernel. Older kernels may be missing some of the events or data described here, but those that are present can be interpreted in the same way. Also, this blog assumes that debugfs has been mounted at /sys/kernel/debug and the kernel has been built with tracing support.
Event-level data: Compaction events
The memory compaction subsystem provides the following tracepoints (ls output has been re-ordered for readability):
# ls /sys/kernel/debug/tracing/events/compaction/

mm_compaction_isolate_freepages
mm_compaction_isolate_migratepages
mm_compaction_begin
mm_compaction_kcompactd_sleep
mm_compaction_defer_compaction
mm_compaction_kcompactd_wake
mm_compaction_defer_reset
mm_compaction_migratepages
mm_compaction_deferred
mm_compaction_suitable
mm_compaction_end
mm_compaction_try_to_compact_pages
mm_compaction_fast_isolate_freepages
mm_compaction_wakeup_kcompactd
mm_compaction_finished
These events can be enabled individually:
# echo 1 > /sys/kernel/debug/tracing/events/compaction/mm_compaction_begin/enableOr the entire group in one go:
# echo 1 > /sys/kernel/debug/tracing/events/compaction/enableFor ease of understanding, we can classify these events into the following categories at a conceptual level:
- Compaction deferral events
- mm_compaction_defer_compaction
- mm_compaction_deferred
- mm_compaction_defer_reset
- Compaction pass progress events
- mm_compaction_begin
- mm_compaction_end
- mm_compaction_finished
- Direct compaction events
- mm_compaction_try_to_compact_pages
- Scanner isolation events
- mm_compaction_isolate_migratepages
- mm_compaction_isolate_freepages
- mm_compaction_fast_isolate_freepages
- Migration outcome events
- mm_compaction_migratepages
- kcompactdN activity events
- mm_compaction_wakeup_kcompactd
- mm_compaction_kcompactd_wake
- mm_compaction_kcompactd_sleep
- Compaction suitability events
- mm_compaction_suitable
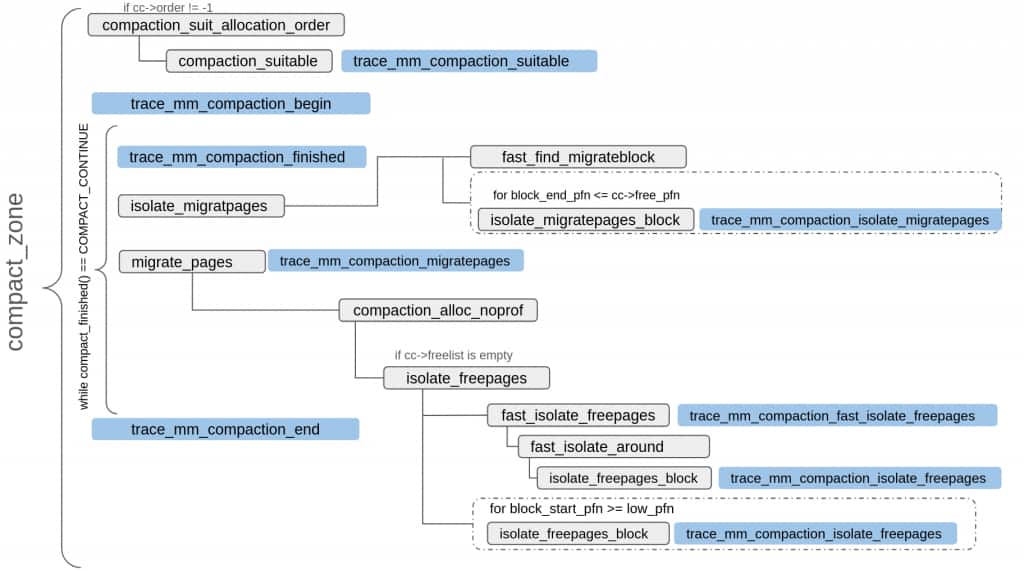
The following diagrams show where the above-mentioned tracepoints appear in different types and stages of the compaction flow. The diagrams are similar to the ones covered in the previous blog but here they also show the involved tracepoints. Since compact_zone() is common and the main part of the compaction engine, it has been shown separately from direct and indirect compaction flows.


Let’s examine each of these event groups in more detail.
Compaction deferral events
The previous blog described when and why a compaction attempt may be deferred. Three tracepoints cover the deferral mechanism:
- mm_compaction_defer_compaction
- mm_compaction_deferred
- mm_compaction_defer_reset
These events represent three sequential states of the deferral mechanism: a compaction attempt is made and fails, the next few attempts should be skipped, and finally, after a few skips (max 64), compaction is tried again; if it succeeds, the state is reset.
mm_compaction_defer_compaction
This event fires from defer_compaction() and its log looks like the following:
kcompactd0-1701 [134] 7763732.901234: mm_compaction_defer_compaction:
node=0 zone=Normal order=8 order_failed=8 consider=1 limit=2
node and zone indicate where compaction is being attempted, order is the target compaction order. order_failed comes from zone->compact_order_failed and indicates the lowest known order for which compaction failed on this zone and node — it may come from a prior recorded value if it’s less than the current compaction target order, or it can be the newly updated value after detecting failure for the current target order. consider comes from zone->compact_considered and indicates how many consecutive compaction attempts have been skipped, and limit comes from (1 << zone->compact_defer_shift) and indicates how many attempts to skip before trying again.
Here we see that the compaction attempt for order-8 failed (order=8). The lowest known failing order is 8 too, order_failed=8, but it may or may not have been updated by the current pass. The failure happened for the Normal zone on node 0. consider=1 and limit=2, in the above log, show that the deferral window is still small, i.e., this is an early failure and the system will retry soon.
mm_compaction_deferred
This event fires when compaction_deferred() decides that the current compaction attempt should be skipped. The important thing here is that if deferral is not needed, for example, because the order is lower than the current zone->compact_order_failed, this event is not triggered. The log of this event looks like the following:
kcompactd0-1701 [134] 7764537.508219: mm_compaction_deferred: node=0
zone=Normal order=9 order_failed=8 consider=60 limit=64
We see the same fields as in the previous events and their sources are the same too, but the interpretation of some fields changes.
This log says that the compaction of the Normal zone on node 0 was skipped. The compaction target was an order-9 block and it was skipped because an earlier compaction attempt for an order-8 block failed for this zone and node. The consider field shows that it is the 60th consecutive skip, and limit shows the current skip limit is 64 (which incidentally is the max skip limit too).
The key distinction between mm_compaction_deferred and mm_compaction_defer_compaction is that the former means no compaction attempt was made at all (it skipped based on the record of earlier failures) while the latter means that the current attempt failed. The former records a decision before trying while the latter records the outcome after trying.
mm_compaction_defer_reset
This event fires from compaction_defer_reset() and its log looks like the following:
kcompactd0-1701 [134] 8662832.134450: mm_compaction_defer_reset:
node=0 zone=Normal order=9 order_failed=10 consider=0 limit=1
Again, the fields and their sources are the same as the prior two events of this group but when compared with the logs of the other two events of this group, we can observe some differences. Firstly, order is less than order_failed, showing that compaction with a target of order-9 succeeded and hence the new (probable) order for failure is 10. consider=0 indicates that the deferral data for this zone has been reset.
The three events covered in this group are useful in several debug scenarios. They can be used to construct a full deferral cycle for a zone — for example, a long gap between mm_compaction_defer_compaction and mm_compaction_defer_reset for the same zone and order indicates a prolonged period of failed compactions. Dumping call stacks at mm_compaction_defer_compaction can show who is attempting these failed compactions (for direct compactions). If kcompactdN is trying this frequently we can use other events to see what is waking it up. Similarly, dumping call stacks at mm_compaction_deferred can indicate which compaction requests are being skipped due to prior failures.
Compaction pass progress events
As mentioned in the previous blog, all compaction flows eventually converge at compact_zone(), and each compaction pass consists of one invocation of compact_zone(). The start and end of each compaction pass are marked by two events: mm_compaction_begin and mm_compaction_end. The intermediate mm_compaction_finished event signals if the current compaction pass should continue or not.
Together, they provide a complete picture of what a compaction pass set out to do, how it progressed, and what it achieved.
mm_compaction_begin
compact_zone() triggers this event, just before starting the main loop that runs compaction stages. The log of this event looks like:
kcompactd1-1738 [231] 7770360.320248: mm_compaction_begin:
zone_start=0x1a840000 migrate_pfn=0x1a840000 free_pfn=0x250ffe00
zone_end=0x25100000, mode=sync
zone_start and zone_end are the PFN boundaries of the zone being compacted. migrate_pfn and free_pfn, respectively, come from cc->migrate_pfn and cc->free_pfn and hence show the current positions for migration and free scanners. The mode field is based on cc->mode and indicates if blocking is allowed during this compaction or not. Both MIGRATE_SYNC_LIGHT and MIGRATE_SYNC are indicated as mode=sync, and MIGRATE_ASYNC appears as mode=async.
mm_compaction_end
compact_zone() triggers this event at the end of a compaction pass. The log of this event mirrors that of mm_compaction_begin with one additional field (status).
kcompactd1-1738 [246] 7770556.199004: mm_compaction_end:
zone_start=0x1a840000 migrate_pfn=0x1d730e00 free_pfn=0x1d730f78
zone_end=0x25100000, mode=sync status=complete
The migrate_pfn and free_pfn are the current positions of the scanners at the end of this pass. The status field indicates the outcome of the compaction run.
status can have one of the following values:
complete → the zone could be scanned without any error but the compaction target was not met
success → compaction was able to provide a page of the target compaction order or, for proactive compaction, the fragmentation score is now within the specified threshold
contended → the compaction pass was aborted because of contention
partial_skipped → scanners met without producing a page of the target order, or a proactive compaction was aborted in favour of an ongoing background reclaim
mm_compaction_finished
This event is triggered from compact_finished(), which controls the main loop of compact_zone(). Since compact_finished() is the loop’s continuation condition, a peek into this event log can tell us why/if a compaction pass continued for long.
For example, a log like the one below:
test-31987 [162] 7763650.985971: mm_compaction_finished: node=1
zone=Normal order=9 ret=continue
tells that this iteration of compaction stages could not yield an order-9 page, but compaction stages should be tried again (ret=continue). The compaction pass is not done yet, and a compaction attempt will be made again within the same compaction pass.
On the other hand, a log like this one:
test-287825 [168] 7764351.294311: mm_compaction_finished: node=1
zone=Normal order=9 ret=contended
indicates that this compaction pass should be terminated because of contention or some other error (ret=contended) observed by one of the compaction stages. ret can have other values too; please see the description of the mm_compaction_end event’s status field for an explanation of those other values.
mm_compaction_begin and mm_compaction_end can be paired together to find out how long compaction has run on a particular zone, and how many of those runs were successful. These can also be grouped with other intermediate events of a compaction pass to summarise each compaction pass. Also, in the case of direct compactions, the interval between these two events can be used to find out how much time (if any) a task is spending in direct compaction.
For a brief summary of a pass, mm_compaction_begin, mm_compaction_end and mm_compaction_finished can be grouped together to see why a compaction pass is failing or continuing for long.
Direct compaction events
try_to_compact_pages() is the entry point for direct compaction and triggers the mm_compaction_try_to_compact_pages event described below.
mm_compaction_try_to_compact_pages
This event links allocation failures to compaction attempts. Its log looks like:
test-190120 [143] 7763940.974602: mm_compaction_try_to_compact_pages:
order=9 gfp_mask=GFP_TRANSHUGE|__GFP_NORETRY|__GFP_THISNODE
priority=2
order tells the order for which the allocation failed and hence the order the compaction needs to satisfy. gfp_mask corresponds to the GFP mask of the current allocation and priority indicates how hard the direct compaction attempt would try to succeed. A lower value here means higher priority, i.e., compaction would try harder to succeed.
In the above log, priority=2 corresponds to COMPACT_PRIO_ASYNC, which is the lowest priority for a direct compaction request.
Another interesting thing here is that the name of the task trying this high-order allocation appears in the log, which can indicate who is trying such an allocation and how often those requests are triggering compaction.
Scanner isolation events
These events track the effort and yield of the migration and free scanners, and are as follows:
- mm_compaction_isolate_migratepages
- mm_compaction_isolate_freepages
- mm_compaction_fast_isolate_freepages
mm_compaction_isolate_migratepages and mm_compaction_isolate_freepages are the per-pageblock results for the migration and free scanners respectively. As described in the previous blog, usually both free and migration scanning happens linearly, pageblock by pageblock, but at the start both migration and free scanners try to optimise the scanning by looking at the freelists. For the migration scanner, this quick lookup identifies a block as a migration source but does not isolate any pages to migrate. On the other hand, for the free scanner, this quick lookup also isolates free pages that can act as migration targets. So for the free scanner, the fast isolation of free pages fires mm_compaction_fast_isolate_freepages, which covers just this fast isolation.
mm_compaction_isolate_migratepages
The migration scanner (isolate_migratepages_block()) triggers this event at the end of scanning a pageblock for migration sources. Its log looks like:
kcompactd0-1701 [136] 7763570.028504:
mm_compaction_isolate_migratepages: range=(0x12c16e48 ~ 0x12c17000)
nr_scanned=348 nr_taken=234
range is the PFN range covered; nr_scanned shows the number of pages actually scanned; and nr_taken shows how many of the scanned pages were isolated.
nr_taken close to nr_scanned indicates that the scanned range was well populated with movable pages and the migration scanner is working efficiently.
On the other hand, nr_scanned and nr_taken being far apart (like in the log below):
kcompactd0-1701 [136] 7763570.027561:
mm_compaction_isolate_migratepages: range=(0x12be7e00 ~ 0x12be8000)
nr_scanned=338 nr_taken=0
indicates that the migration scanner is having problems, and this can be because of multiple reasons. It could be that the scanned range had unmovable pages, or the compaction did not allow blocking and pages were under writeback or had the dirty bit set (hence ignored), or the scanner is wrongly scanning some range that it should have skipped, or there is some other issue. But the important thing here is that a low yield ratio (nr_taken/nr_scanned) indicates that the migration scanner is struggling, and this will slow down both direct and indirect compactions and, in the case of indirect compactions, cause high CPU churn because of kcompactdN thread(s).
mm_compaction_isolate_freepages
The free scanner (isolate_freepages_block()) fires this event after examining a pageblock for freepages. Its log mirrors that of mm_compaction_isolate_migratepages.
kcompactd0-1701 [130] 7763960.263425: mm_compaction_isolate_freepages:
range=(0x12ef000b ~ 0x12ef0200) nr_scanned=394 nr_taken=15
But here nr_scanned is the number of free pages that were scanned and nr_taken is the number of those that were isolated to work as a migration target. A low yield ratio (nr_taken/nr_scanned) here indicates issues like memory pressure, memory fragmentation, or a bug in the free scanner code.
Another difference between these two events is that mm_compaction_isolate_migratepages runs in the compaction loop but mm_compaction_isolate_freepages runs lazily when the supply of free destination pages is exhausted.
mm_compaction_fast_isolate_freepages
As mentioned earlier, fast_isolate_freepages() is a fast path supplement for the free scanner and looks into the buddy allocator’s freelist to identify and isolate pages that can work as migration targets.
Its log is identical to that of mm_compaction_isolate_freepages with the only difference being the name of the event. Of course, a low yield here would not necessarily mean that pageblock-level scanning would struggle too; it would just mean that fast scanning is not isolating enough free pages, but usual pageblock scanning may still be able to do that.
These three events constitute the most interesting part of a compaction pass and can be grouped with mm_compaction_begin and mm_compaction_end to summarise each individual pass. For example, a low yield ratio for one or both scanners can show why a certain pass took long or was not successful. These events could be probed to accumulate and periodically show the yield numbers mentioned earlier, so that we can see if during a certain timeframe, one or the other of the scanners was struggling or not.
Migration outcome events
This event indicates the result of a migration attempt. We saw earlier how mm_compaction_isolate_migratepages indicates how many pages have been isolated for migration; this event shows how many of those isolated pages could actually be migrated.
mm_compaction_migratepages
The compact_zone() main loop triggers this event after attempting to migrate previously-isolated pages. Its output looks like:
kcompactd0-1762 [133] 7766493.880000: mm_compaction_migratepages:
nr_migrated=32 nr_failed=0

kcompactd0-1762 [133] 7766493.881666: mm_compaction_migratepages:
nr_migrated=32 nr_failed=0
Here nr_migrated shows how many pages were migrated and nr_failed shows how many migrations failed; their total equals nr_taken of mm_compaction_isolate_migratepages. On a system where migration is working fine, nr_failed should be 0 or very low compared to nr_migrated.
kcompactdN activity events
These events trace the activity of the per-node kcompactdN threads and show when background compaction was triggered, when it actually began working and when it considered its job done. These events are not part of a compaction pass and describe kcompactdN activity from the outside.
There are three events in this category:
- mm_compaction_wakeup_kcompactd
- mm_compaction_kcompactd_wake
- mm_compaction_kcompactd_sleep
mm_compaction_wakeup_kcompactd
This event fires from wakeup_kcompactd() and in the context of the thread that decides to wake up the kcompactdN thread — for example, the page allocator calling wakeup_kcompactd() after a high-order allocation fails. This event happens before kcompactdN actually runs and its log looks like:
kswapd0:0-1969 [038] 7763632.578174: mm_compaction_wakeup_kcompactd:
nid=0 order=9 classzone_idx=Normal
In the above snippet, we see that the background reclaim path (kswapd0) woke up kcompactd0 (nid=0) while trying to reclaim memory for an order-9 allocation request, and the highest zone type that compaction can consider is the Normal zone.
mm_compaction_kcompactd_wake
This event fires when the kcompactdN thread actually wakes up; it is a counterpart of the previously-described mm_compaction_wakeup_kcompactd, and its log is identical as well, except for the name of the event. Another difference between the two events is that mm_compaction_wakeup_kcompactd happens in the context of the task that is waking up the kcompactdN thread but this event happens in the context of the kcompactdN thread itself.
mm_compaction_kcompactd_sleep
This event fires when the kcompactdN thread is about to go back to sleep after finishing its job. Its log looks like:
kcompactd1-1686 [146] 7774533.143389: mm_compaction_kcompactd_sleep:
nid=1
There is not much information here except for the fact that nid=1 and the task name both indicate that the kcompactdN of node 1 is going to sleep.
These three events form a repeating cycle whose frequency and timing reveal the background compaction activity in a system. The absence of these events, or infrequent mm_compaction_wakeup_kcompactd, mm_compaction_kcompactd_wake events soon followed by mm_compaction_kcompactd_sleep events, indicate a system where there is not much need for background compaction. But there are other patterns that indicate problems. If mm_compaction_wakeup_kcompactd fires very frequently for the same node and order, it indicates that high-order allocations are failing continuously or the kcompactdN thread cannot keep up with the demand. If mm_compaction_kcompactd_sleep is rarely or never seen between or after wake events, the kcompactdN thread is perpetually active. If the order field in wakeup events is consistently high (like order 8, 9, or above), fragmentation is concentrated at the large allocation orders, as in systems under THP pressure. On multi-node systems, asymmetry between nodes — like heavy wakeup activity on node 0 with none or very little wakeup activity on node 1 — indicates NUMA-imbalanced allocation patterns.
Compaction suitability events
mm_compaction_suitable
mm_compaction_suitable gets triggered from compaction_suitable() and its log looks like:
metricbeat-31987 [162] 7763650.974298: mm_compaction_suitable: node=1
zone=Normal order=9 ret=continue
node and zone indicate the zone whose suitability is being checked. The important fields here are order and ret. If ret is continue, that means the zone was deemed suitable for a compaction attempt of order seen in the log. ret=skipped would indicate unsuitability of the zone for compaction, and, more specifically, ret=not_suitable_zone would indicate that the fragmentation index does not indicate a need for compaction at this order — i.e., the allocation failure is due to memory shortage rather than fragmentation.
With the tracepoints covered, the following sections turn to the compaction data available through proc and debugfs.
System-level data: proc and debugfs interfaces
Tracepoints provide per-event granularity but require active tracing to collect data. The interfaces described in the following sections are always on — they expose compaction counters, fragmentation metrics, and zone state continuously, making them the natural first stop when investigating compaction issues on a production system.
/proc interfaces
A lot of compaction data is exposed via /proc. Some of these interfaces are exclusive to compaction while others form a broad group, including compaction-specific data.
/proc/vmstat
/proc/vmstat gives a running, system-wide tally of compaction activity — scanner work, isolation yield, and the outcome of direct and background passes — making it the first place to look when investigating whether compaction is involved in a performance problem. It exposes various counters pertaining to the memory management subsystem. These are of type enum vm_event_item. The enum values that pertain to compaction and corresponding /proc/vmstat entries are shown below:
COMPACTMIGRATE_SCANNED → compact_migrate_scanned

COMPACTFREE_SCANNED → compact_free_scanned

COMPACTISOLATED → compact_isolated

COMPACTSTALL → compact_stall

COMPACTFAIL → compact_fail

COMPACTSUCCESS → compact_success

KCOMPACTD_WAKE → compact_daemon_wake

KCOMPACTD_MIGRATE_SCANNED → compact_daemon_migrate_scanned

KCOMPACTD_FREE_SCANNED → compact_daemon_free_scanned
All of the above counters are per-CPU counters and are added up by corresponding proc handlers before being displayed.
compact_migrate_scanned and compact_free_scanned count the total number of pages examined by the migration and free scanners respectively, across all compaction passes. During a compaction pass, migration and free scanners accumulate the count of scanned pages respectively under cc->total_migrate_scanned and cc->total_free_scanned and at the end of the compaction pass, compact_zone() adds these values to the current values of compact_migrate_scanned and compact_free_scanned. compact_isolated counts pages successfully isolated by migration and free scanners, across all passes. During linear scanning of a pageblock by the migration or free scanner, or during fast search by the free scanner, the number of isolated pages is stored in a local count and at the end of a pageblock scan or at the end of a fast search this count gets added to the current value of compact_isolated. Unlike the first two counters mentioned in this section, compact_isolated is not updated at the end of a pass; rather, it’s updated after each successful batch isolation. Also, compact_isolated is a cumulative count of pages isolated by both scanners, and its value relative to the total of the two scanner counters gives the overall scanner efficiency.
compact_stall, compact_fail and compact_success are all related to direct compaction and all of them are updated by __alloc_pages_direct_compact(). compact_stall is incremented by one for each direct compaction attempt that actually runs (i.e., if it does not bail out early because of COMPACT_SKIPPED), a successful attempt ends up incrementing compact_success by one and an unsuccessful one increments compact_fail by one. A high value of compact_stall shows that the execution threads are entering the direct compaction path frequently, and this could be slowing them down. The value of compact_success or compact_fail with respect to compact_stall shows the efficiency of direct compaction attempts.

compact_daemon_wake, compact_daemon_migrate_scanned, and compact_daemon_free_scanned are all related to kcompactdN threads. compact_daemon_wake gets incremented every time kcompactd_do_work() is invoked. compact_daemon_migrate_scanned and compact_daemon_free_scanned are like compact_migrate_scanned and compact_free_scanned respectively, but they indicate the total number of pages examined by the migration and free scanners during indirect compactions only. During proactive compaction, compact_node() updates these counts after each call to compact_zone(), and, for targeted indirect compactions, kcompactd_do_work() does the same.
Numbers shown by compact_migrate_scanned and compact_free_scanned are inclusive of the corresponding compact_daemon_migrate_scanned and compact_daemon_free_scanned numbers, and the difference between the all-inclusive and corresponding background-only counts can indicate if the compaction load is coming from background allocations or from direct allocations.
/proc/buddyinfo
/proc/buddyinfo gives a per-zone snapshot of how many free blocks exist at each buddy order — the cheapest first look at fragmentation. It shows the number of free pages available at each order, per zone, per NUMA node. For each zone, frag_show_print() gets called and dumps zone->free_area[order].nr_free for orders 0 through NR_PAGE_ORDERS-1 in a table that looks like the one shown below:

Each column from left to right represents order-0 through order-10 and the values are the count of free blocks at that order. A zone where high-order columns are all zero or near-zero while low-order columns are large, indicates external fragmentation where plenty of free memory exists but there are very few or no physically contiguous large blocks. Such a zone needs compaction before high-order allocations can succeed.

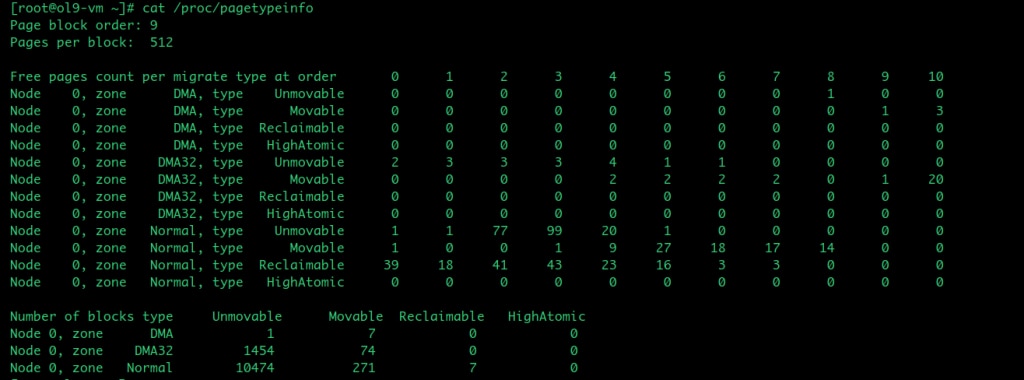
/proc/pagetypeinfo
/proc/pagetypeinfo breaks the per-zone free pages down further by migrate type and order and hence it is the most useful interface for understanding why compaction is failing. But it’s costlier than /proc/buddyinfo because it walks buddy freelists under zone->lock.
This data is shown in the following table:
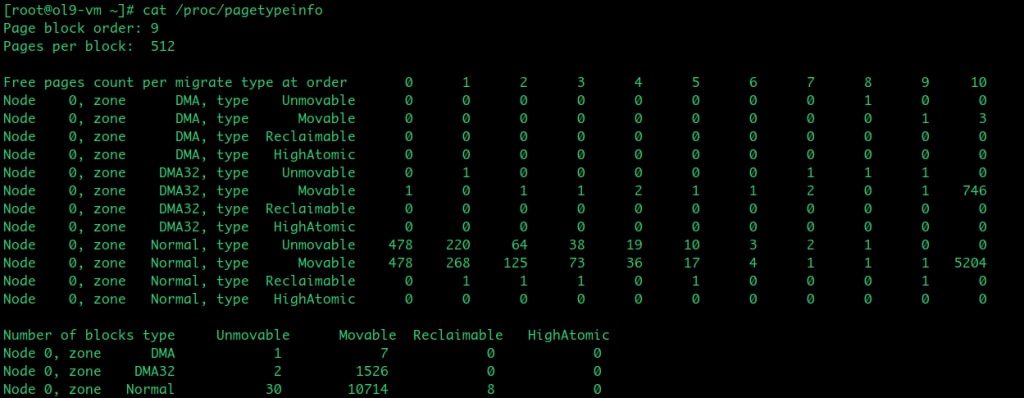
The critical pattern to look for is Unmovable free pages scattered across all orders while Movable free pages are concentrated at low orders — this means non-movable allocations have colonised movable pageblocks, leaving the migration scanner with few valid candidates regardless of how many compaction passes run.
The key difference between buddyinfo and pagetypeinfo is that the former just reads the per-order nr_free count and hence is fast, while the latter walks the free_list linked lists per migratetype and walks all pageblock PFNs, making it an expensive option.
This is an important difference because it means that buddyinfo and pagetypeinfo should not be collected at the same frequency — the overheads involved are very different.
/sys/kernel/debug interfaces
/sys/kernel/debug/extfrag/extfrag_index
/sys/kernel/debug/extfrag/extfrag_index answers a single diagnostic question per zone and order: is the allocation failure at this order due to fragmentation (where compaction can help) or due to memory shortage (where it cannot)? This information is provided via debugfs. The calculation of the external fragmentation index has been covered in the previous blog and the external fragmentation index lies in the range -1000 to 1000. This number is further divided by 1000 before appearing in the extfrag_index table shown below:
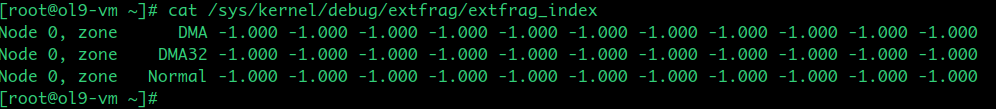
Each column represents order-0 through order-10. A value of -1 means that an allocation would succeed without needing compaction. A value near 0 means allocation failures at that order are due to memory shortage; in other words, compaction cannot help and reclaim is needed. A value near 1 means failures are due to fragmentation — compaction should help.

Also, when the kernel decides about the need for compaction based on the fragmentation index, the fragmentation index is compared against vm.extfrag_threshold which lies in the range 0 to 1000 (i.e., the comparison happens against the actual value returned by __fragmentation_index()). This should be kept in mind while looking at the debugfs table and comparing the values there against vm.extfrag_threshold.
For example, if vm.extfrag_threshold is 500, then a value of 0.6, for zone/order in the extfrag_index table, will trigger compaction.
/sys/kernel/debug/extfrag/unusable_index
/sys/kernel/debug/extfrag/unusable_index quantifies what fraction of zone memory is unusable for an allocation of a given order. So it quantifies the same situation as extfrag_index but from the opposite side and hence complements extfrag_index, which diagnoses the cause.
The calculation happens, just like extfrag_index. For each zone, unusable_show_print() gets invoked and it further invokes fill_contig_page_info() to calculate the same numbers as those calculated for extfrag_index. But the difference here is that these numbers are then passed to unusable_free_index(), which returns the index in the range 0 to 1000. This number is further divided by 1000 before appearing in the unusable_index table as shown below:
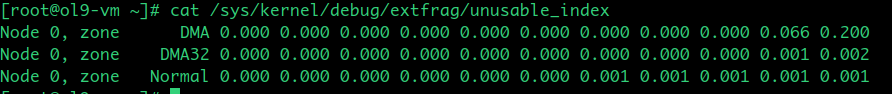
A value of 0 means all of the zone’s memory is available for allocation of that order. A value near 1 means that most of the zone’s memory is unsuitable for that allocation order.
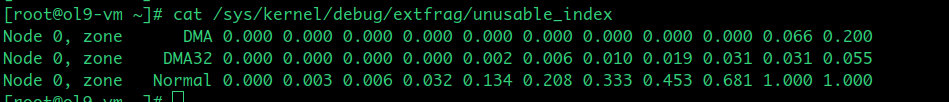
So unusable_index and extfrag_index are complementary in the sense that the former indicates what fraction of memory is unsuitable for a given order allocation and the latter indicates if the allocation failure is due to fragmentation or due to lack of memory.
Conclusion
This blog described the two categories of diagnostic data that the Linux kernel’s compaction subsystem exposes. The tracepoints covered in the first part of this blog provide fine-grained, per-event visibility — each event fires at a specific point in the compaction code path and carries data about scanner positions, isolation yield, migration outcomes, and kcompactdN lifecycle. The proc and debugfs interfaces covered in the second part of this blog provide a higher-level, always-on view — fragmentation metrics, scanner efficiency counters, and system-wide compaction activity — without any tracing overhead.
Used together, these two layers give a complete picture of compaction health. The system-level interfaces are the natural first stop when investigating a performance problem — they confirm whether compaction is the cause, whether the problem is fragmentation or memory shortage, and whether the kernel has given up on a zone. When they point to a specific failure mode but do not provide enough granularity to identify the exact cause, the tracepoints provide the per-pageblock and per-pass detail needed to understand precisely where compaction is failing.
The next blog in this series builds on the data described here and demonstrates how to use bpftrace, dtrace and shell scripts to collect, correlate, and interpret this data in practice — turning the raw events and counters into actionable diagnostic tools for real compaction problems.