Introduction
Recently I worked on a CFS group scheduling bug, where scale up, followed by a scale down of a virtual machine (VM) was adversely impacting the execution time of some udev scripts. One of my previous articles CFS group scheduling described how CFS group scheduling works. This article describes my work in debugging and getting a fix for a CFS group scheduling bug, which was caused by the CPU hot plugging.
Bug manifestation
The issue was manifesting itself as timeouts in execution of some scripts which were supposed to run in response to certain udev triggers. But these timeouts were happening only when the virtual machines (VMs) under test had undergone a scale up followed by a scale down.
For example say a VM was booted with 4 CPUs and had a decent amount of workload on it. If a udev event was triggered on this VM the relevant script would start and finish within 15-20 secs max. Now the same VM was scaled up to 124 CPUs and scaled back to 4 CPUs and then if the same udev event was triggered on this VM the relevant script would take more than a minute to finish. The extra time taken to finish these scripts was resulting in different timeouts which were further getting percolated as other issues.
Debugging
From the manifestation it was evident that CPU hot plugging was playing some part but it was not clear whether it was the scheduler or CPU hot plugging or the kernel’s uevent notification mechanism that was at fault here. For the rest of this blog when I refer to a good and a bad system, by good system I mean a freshly booted VM with 4 CPUs and by bad system I mean a VM that has undergone scale up (of 100+ CPUs) followed by scale down (back to 4 CPUs). The systems are the same in other aspects like available memory, system load etc.
Also in both the cases the udev daemon or systemd-udevd was under its dedicated cgroup (systemd-udevd.service)and overall cgroup hierarchy was like the one shown below:
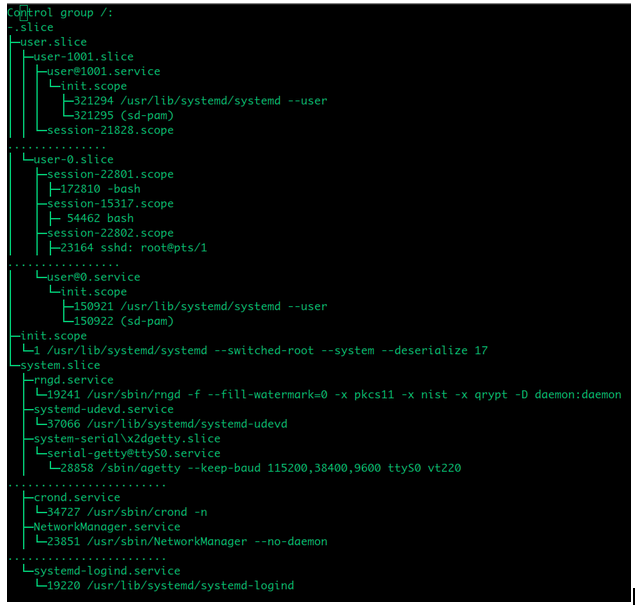
I have omitted some groups/members in the above picture, to keep it small and easy to follow. We can see that we have system.slice and user.slice within root or top cgroup. Then within system.slice we have systemd-udevd.service which is hosting udevd daemon or systemd-udevd.
Verifying uevent delivery
I started with verifying uevent delivery, since it was the starting point for everything else related to this issue. Also it was the easiest thing to verify amongst the three possible problem areas mentioned earlier. Using udevadm monitor, it was evident that in both good and bad cases the uevent was getting delivered in pretty much the same time after being triggered. This meant that in both the cases execution of the udev scripts (named filter_quorum.sh) would start at similar times after the udev event was triggered.
Checking on-cpu time of udev script
So the next thing to see was why the udev script was taking longer to finish, was it getting blocked somewhere or was it doing more work or was it getting less time on CPU. In order to verify these points I collected scheduler event traces for both good and bad cases. I used the trace-cmd (Ref: trace-cmd) here to collect these traces as follows:
trace-cmd record -e sched* sleep 30
In both the cases the traces were collected for 30 secs after triggering the udev events via udevadm trigger. After collecting the traces, we can open these trace files using kernel shark (Ref: kernel shark) and filter it for specific tasks to see their runtime behaviour. In this case we are interested in runtime behaviour of filter_quorum.sh
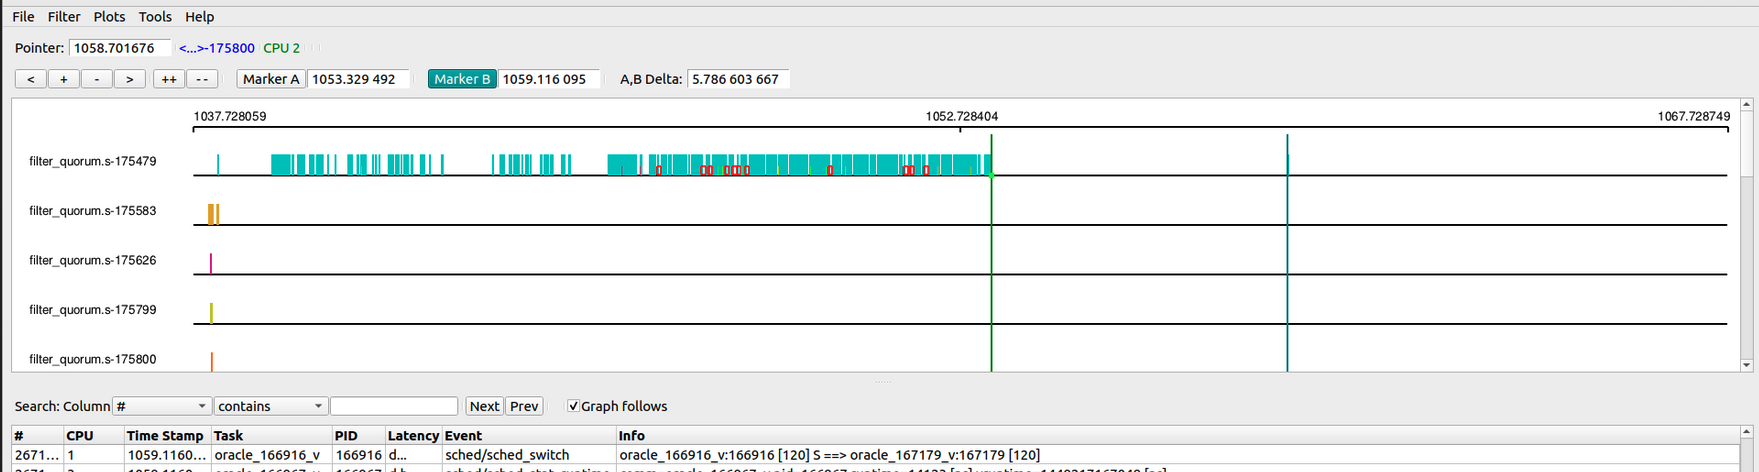
The trace for execution time of filter_quorum.sh, in the good case, is shown below:
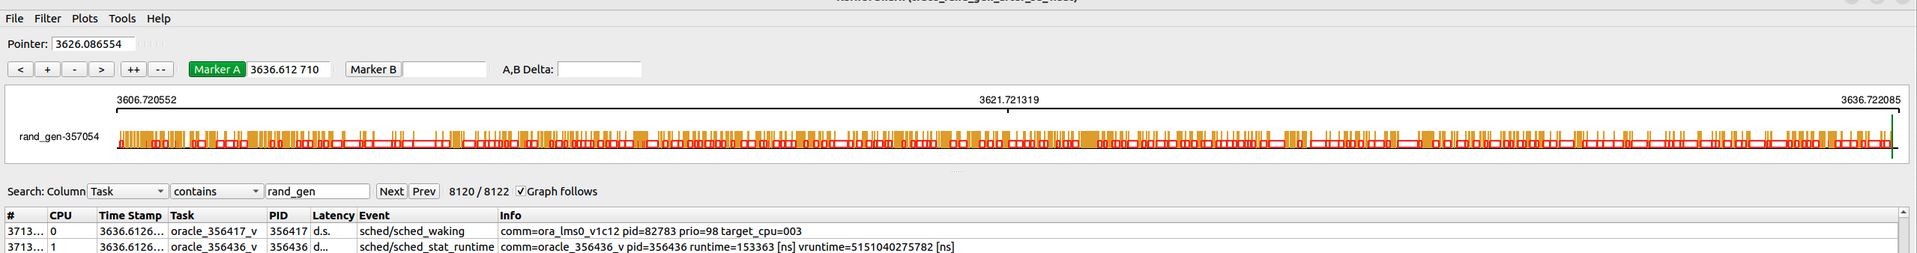
Same trace for the bad case is shown below:
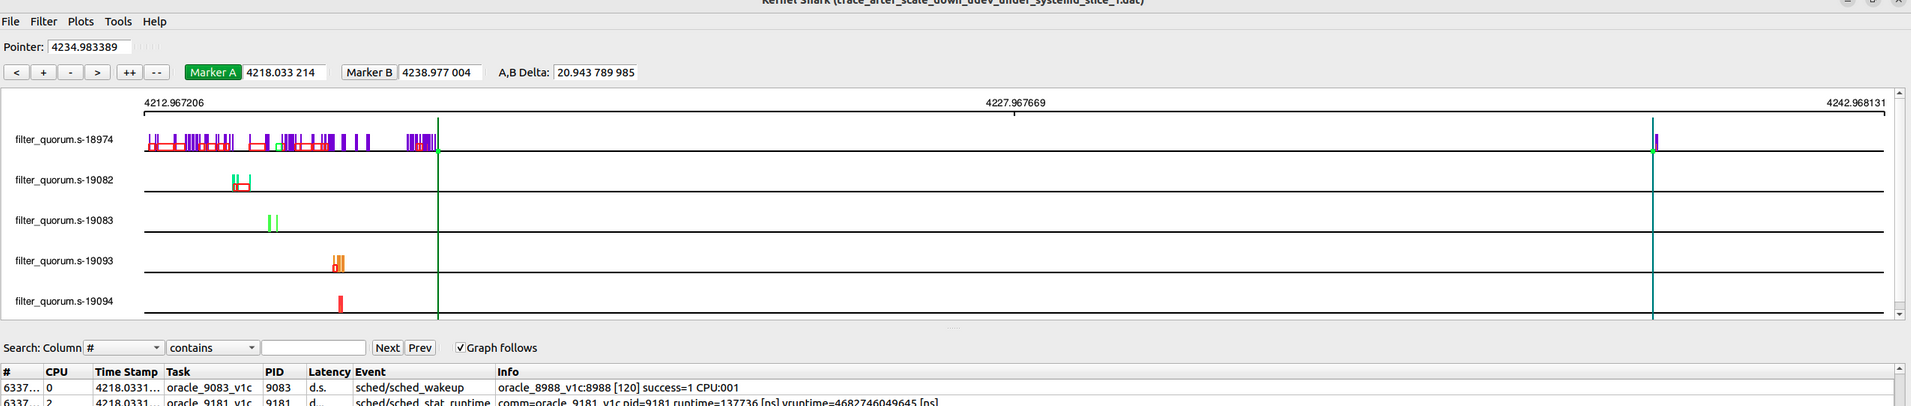
From these traces it was evident that in bad case the udev script was getting kicked off the CPU much more frequently, though it was still runnable. The red squares in the above plots show the duration between time instances when a task was taken off the CPU and when it got back on CPU. Obviously more of these blocks mean more instances where the task was not on CPU despite being runnable, and the wider the block, the longer it was off the CPU.
This meant that udev script was getting less CPU time allotted for itself. It was finishing its quota within scheduler period (described in CFS group scheduling) and was getting kicked off the CPU.
Another thing evident in the above traces is that there are multiple instances of filter_quorum.sh, running at the same time. So there was doubt regarding which of these is getting timed out. Was it the one that remains runnable for most of the trace window or was it one of the ones that run for a much shorter duration and then exit.
If the issue was due to udev script getting less CPU time, it could also be verified using a simple CPU hogger and putting it under systemd-udevd.slice. Having a CPU hogger gives much easier means to trace CPU time since ideally it is always supposed to run (unless it finishes its job) and in this case it would also mean that I could avoid the noise due to other running instances of filter_quorum.sh. So I placed a CPU hogger, that was doing something like below, under systemd-udevd.slice:
int main(int argc, char *argv[])
{
    unsigned long count, i, val;
    if (argc != 2) {
        printf("usage: ./a.out <number of random numbers to generate> \n");
        return 0;
    }
    count = strtoul(argv[1], NULL, 10);
    printf("Generating %lu random numbers \n", count);

    for (i = 0; i < count; i++) {
        val = rand();
        val = val % 2;
    }

    printf("Generated %lu random numbers \n", count);

    return 0;

}
As evident, this CPU hogger was generating a specified number of random numbers. The traces obtained for this, random number generator, under the good and the bad cases can be seen below.
Random_number_generator execution time under good case:
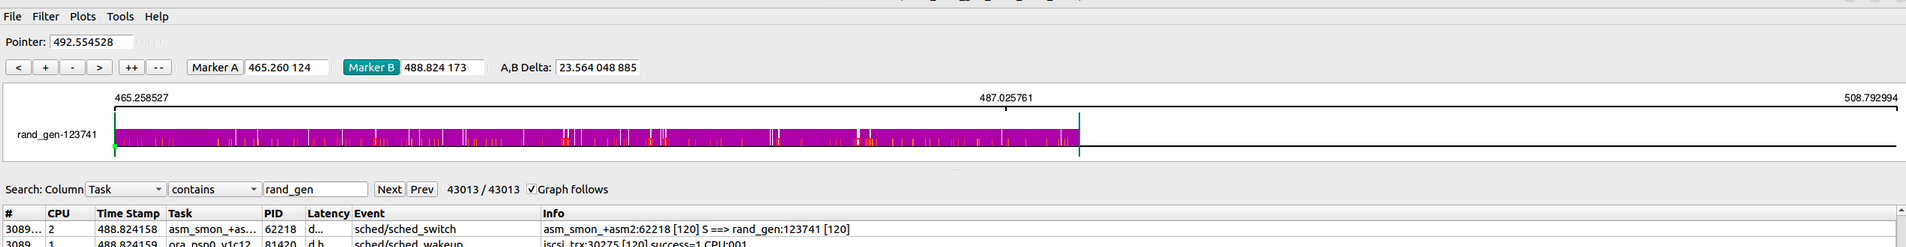
Random_number_generator execution time under bad case:
These traces confirm that under the bad case, the CPU hogger was getting less CPU time and hence was taking much longer to complete. In the above example it was asked to generate 1 million random numbers. We can see that in the good case it finished in around 25 secs but in the bad case it was going on even after 30+ secs.
From this point onward I focused on finding out why the CPU hogger was getting less CPU time in the bad case, because if the CPU hogger under systemd-udevd.service was getting less CPU time, the udev script of the original issue would be getting less CPU time as well and if it gets less CPU time, obviously it would need longer on the wall clock to finish its job.
Checking CPU time allotment for impacted task group
Now why was the CPU hogger getting less time on CPU on a scaled down system. Were there more tasks running under its cgroup or was its cgroup getting less CPU time as a whole.
Using execsnoop from bcc-tools, I could verify that there were no tasks, of short life span, that were getting forked under its cgroup and using systemd-cgtop, I could see that there were no new tasks running under its cgroup. Use of execsnoop was just to make sure that we don’t miss out on tasks that were born and died within a short span of time and hence may be missed by systemd-cgtop.
Once it had been verified that systemd-udevd.service cgroup was having the same number of tasks under good and bad cases, it was evident that in the bad case systemd-udevd.service itself was getting less CPU time as a whole.
Now the next thing to verify was why the systemd-udevd.service group was getting less CPU time. Were there more tasks running under its parent cgroup (system.slice) and this in turn was resulting in it getting less CPU time or was system.slice itself receiving less CPU time. Doing a similar experiment (as described earlier for systemd-udevd.service) using execsnoop and systemd-cgtop for system.slice it was verified that no new tasks were running under system.slice. So was system.slice getting less CPU time and if that be the case all cgroups under the root cgroup would be getting less CPU time.
As I was already at the root level of CPU cgroups, it made sense to make the testing more sand-boxed. Rather than tinkering and testing CPU cgroups created by systemd(as done so far), I could create my own CPU cgroups under root and see how CPU hogger was behaving in good and bad case.
I created two cpu cgroups under root as:
/sys/fs/cgroup/cpu/test_group_1 and /sys/fs/cgroup/cpu/test_group_2
Then I assigned one instance of CPU hogger to both of these and checked the CPU time for these 2 groups in both good and bad cases. I also made sure that the system was decently loaded. Since in these experiments both freshly booted and scaled down VMs had 4 online CPU, I launched 4 CPU hoggers under the root cgroup to load the system.
I found that, in both the good and the bad cases, both the test cgroups were getting similar CPU times, like the snippet shown below:
CPU shares of test groups after boot or after scale up and scale down:
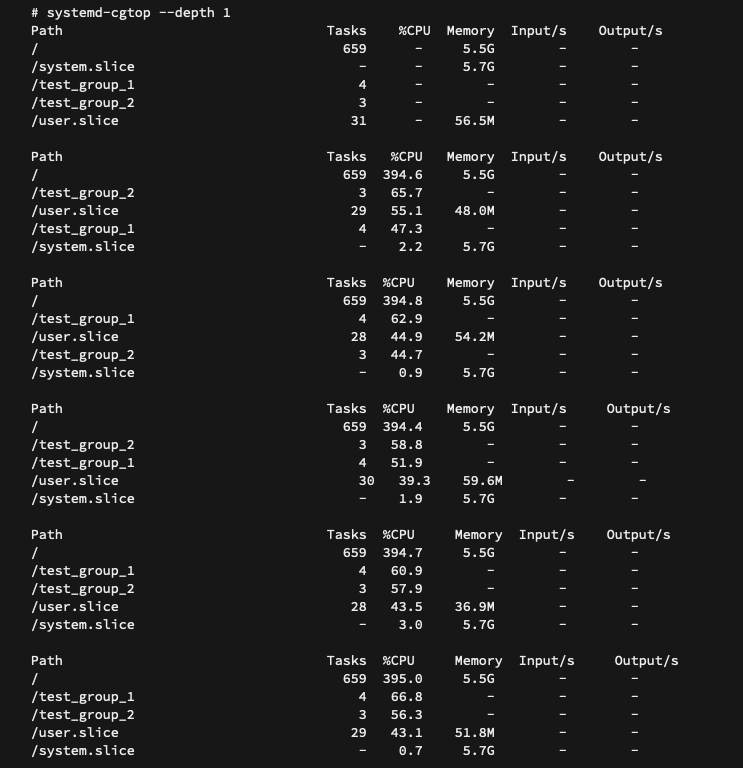
This proved that VM scale down was not changing the CPU time for cgroups under the root cgroup. So in the original issue system.slice would be getting the same CPU time but then why was systemd-udevd.service getting less CPU time, because there were no new tasks to contend against it under system.slice.
Now systemd-udevd.service had just one task under it i.e systemd-udevd, so it made sense to see how my test cgroups behave if they have systemd-udevd under them.
So I did one more experiment. On a freshly booted VM, I moved systemd-udevd to one of my test cgroups and did the test with CPU hoggers. I could see both the groups were getting similar CPU time. So far everything as expected.
Then I performed a scale up and scale down of the same VM. Obviously after scale down the number of CPUs was kept to the same number as the number of CPU with which the VM was booted. Then I ran the CPU hogger test on this scaled down system with the same number of CPU hoggers under root and under each of these test cgroups, as in test after fresh boot.
systemd-cgtop showed that CPU time for test group that had systemd-udevd dropped spectacularly, even though at the time of taking the reading systemd-udevd was not running at all.
CPU shares of test groups (test_group_1 has one CPU hogger and systemd-udevd, test_group_2 has one CPU hogger) after scale up and scale down:

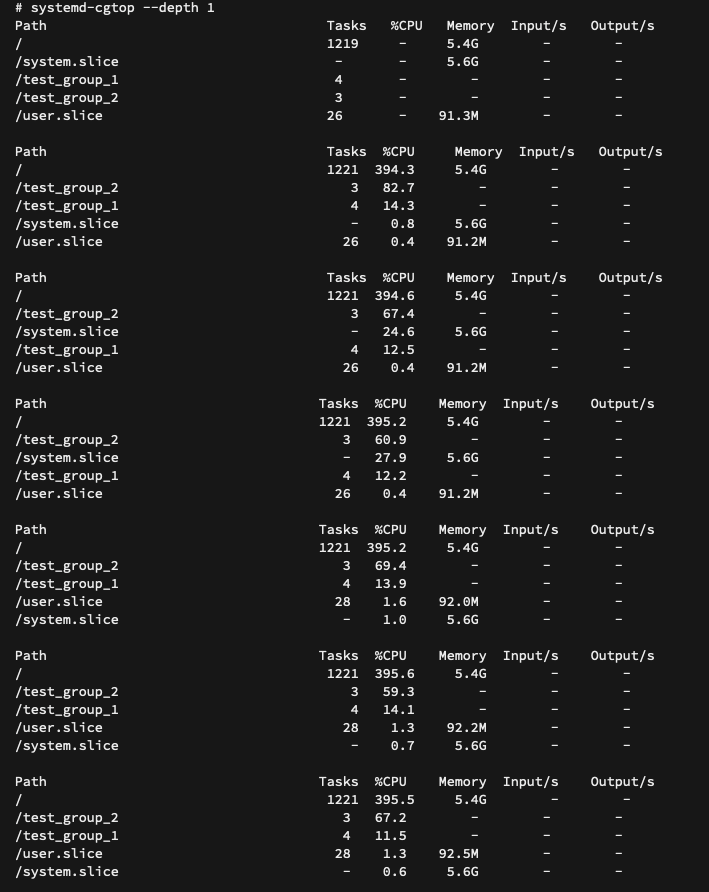
So after all it was systemd-udevd that was doing something that could trigger the issue. But it is a user space daemon and hence it should not be able to confuse the kernel’s scheduling decisions.
Reason for impacted task group getting less CPU time
To debug this further, I collected /proc/sched_debug data for good and bad cases and I could see that in bad case per-cpu sched_entities (described in earlier blog about CFS group scheduling) corresponding to the task group that had systemd-udevd, had their weights reduced by a lot when compared to weights of sched entities belonging to the other test cgroup.
This reduction in weight explained the reason for less CPU time. As explained, in CFS group scheduling blog, a sched_entity with lower load weight will get less quota in current scheduler period and also will have its vruntime increased at a much faster rate. In other words once it gets on CPU it will run out of its quota quickly and once it goes back from being on CPU to being on CPU runq, it will end up on right(er) side of time ordered RB tree and hence it will have to wait longer before it gets its chance on CPU again.
From the same sched debug we could also see that the load average of task group containing systemd-udevd was much higher. Ideally the 2 test task groups should have very similar load avg since both of them mainly had the CPU hogger as their runnable task. systemd-udevd would run but not for much longer.
The load weight of a the task_group’s sched_entity is calculated (to approximate values, to avoid overhead involved in getting precise values) using the following equation:
task_group.se[i].load.weight = task_group.weight * task_group.cfs_rq[i].avg.load_avg / task_group.load_avg
So high load average of the problematic task group was the reason for its sched_entity(ies) getting less weight and hence less CPU time.
Thus, debugging done so far came down to the question that why a CPU cgroup containing systemd-udevd was ending up with high load average after a VM scale up and scale down. Since its a kernel bug most likely there are other ways to hit the same issue as well but at that point of time this was the only way I could reproduce this issue. Irrespective of the number of ways to reproduce this issue, it was clear that issue was on kernel side.
Next I put custom traces in the CFS group scheduling code, to see if it throws out some further clues. Tracing can be tricky especially for race situations and I found out that with some magic amount of tracing the problem was going away. Eventually with some trial and error I could finally come up with traces that showed the problem. The following trace was collected at the time of scale down from 100+ CPUs to 8 CPUs. No CPU hogger was run during this time (just scale up and scale down of VM performed), so it has not contributed to loads of test_group_1 or test_group_2. But test_group_1 also had systemd-udevd, which must have run on the VM during scale down because scale down involves the hot-plugging out of CPUs. To keep the logging at a minimum level, task_group_2 has been filtered out (we know that during scale up/scale down it will not contribute any load).
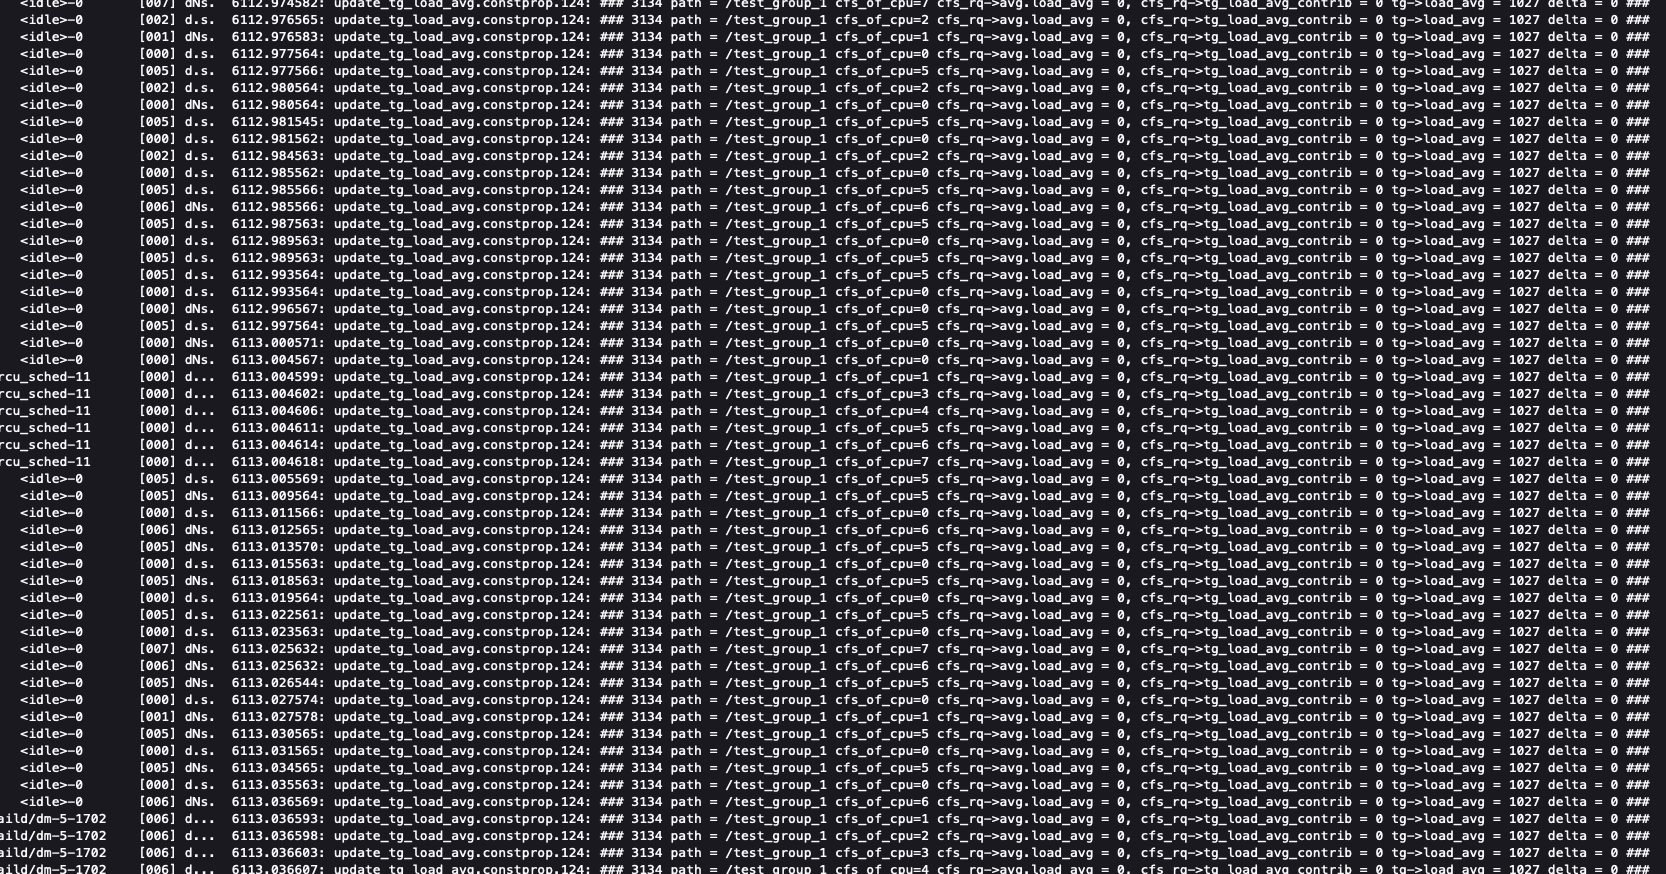
We can see in the above snippet that even though test_group_1’s load at each of the remaining 8 CPUs has become 0 (cfs_rq→avg.load_avg = 0), its overall load average (i.e tg->load_avg) is still quite high.
If we recall, from the CFS group scheduling blog, a task_group’s load_avg is approximately the same as the sum of loads at its runqs. So a task_group (in this case test_group_1) ending up with high load_avg, when load at each of its owned CFS runqs is 0, is not correct. Under this situation if a task starts running under this cgroup, the task would add its own load but the load avg at task group will not be a correct reflection of it. This is what was happening with my test cgroups as well. After scale down the task group containing systemd-udevd was ending up with a high (though differing) amount of load averages even though systemd-udevd had last run, a long time back. Now when CPU hoggers were launched under both of these cgroups the one with systemd-udevd was ending up with a high load average due to the load average of CPU hogger getting added to task group’s residual load average.
Fix for this issue
It was evident that there was some race where the load of task(s), at an offlined CPU, was not getting deduced from the load of task group.
Since a task group with 0 runnable tasks should have 0 load average, I suggested this thischange upstream but the involved atomic operations in my patch were pointed out as overhead. I was asked to provide some more traces and after looking at those traces Vincent Guittot (Upstream sched maintainer) suggested this change which fixed the issue.
Conclusion
This blog described one of the bugs, in CFS group scheduling, that was present in the upstream kernel till the point of patch (mentioned in this blog) submission. The unique nature of this bug, where locating the main source of the issue was challenging, made debugging really interesting. I have described my debugging methodology and tools that were used here. Hopefully it will be useful for others who run into similar issues.