| Updated with changes introduced by the 23.10 release! |
We are excited to announce the general availability of Analytics in OCI Process Automation (OCIPA/OPA). Although we have big plans for analytics, we are starting out by providing operational-level visibility into process execution workloads. This capability will provide insight into process demand, execution, and duration trends. OCI Process Automation Analytics is available in all versions (Fusion Applications, Standalone, and OIC) of our product and is offered at no additional cost.
This blog will cover what we are trying to achieve, who our target audience is, and what features are introduced in this inaugural release.
Our Vision:
Let’s start with the questions we are trying to help customers answer with OCIPA Analytics.
First and foremost, we want our customers to be able to understand their current process performance, including:
- Identify process demand trends:
- How many new requests am I receiving for each process?
- What are my busiest processes?
- Is there a time-based pattern to demand trends?
- Understand where errors are occurring and their frequency:
- Which processes (or applications) are seeing the most errors?
- Where are these errors occurring?
- Why are these errors occurring, and is there any pattern that can be observed?
- Understand how long processes take to complete and why:
- Which processes (or applications) take the most time to complete?
- Where is that time being spent (at which process/activity)?
Additionally, we want to provide our users with an understanding of stakeholder workloads involved in process tasks. Here, we will be focused on answering questions such as:
1. How many tasks are assigned to a user or role (stakeholder workload)?
2. What is the average time it takes assignees to action these tasks?
3. How many tasks are in various life-cycle stages (completed/open/over-due)?
4. What actions are people taking on these tasks?
By answering the above questions and providing our users with an understanding of current and past process and task performance, we hope to empower them to identify process trends and bottlenecks. This knowledge can ultimately lead to process improvements and a better experience for process stakeholders.
To execute our vision to provide visibility into operational data for both process and task-based workloads, we will be delivering Analytics functionality across multiple releases, with the initial releases focused on providing insight into process execution workloads.
Target Audience:
With the above definition of what we are trying to accomplish in place, let’s take a quick look at our target audience:
- Process Administrators: Oversee the OCI Process Automation environment, configure system-level settings, and see analytics for all process instances. They want to see overall transaction volumes, errors, and process performance.
- Process Operators: Oversee the day-to-day operations of one or more process applications within the OCIPA system (sub-section of the administrator role). Can configure process application-level settings and see all analytics for their application(s). They are interested in identifying bottlenecks, monitoring demand trends, and understanding where and why errors occur.
- Process Designers: These are responsible for modeling and designing process applications to meet the needs of business users. They are interested in viewing analytics for the applications they have helped deploy to understand their current performance and identify areas for improvement. They also often compare one version of an application against another to see if incremental changes are improving the overall experience.
Overview of Process Analytics:
Let’s now look at how to access this new capability, discuss some critical characteristics around data collection, and provide an overview of the analytics features.
Accessing Analytics:
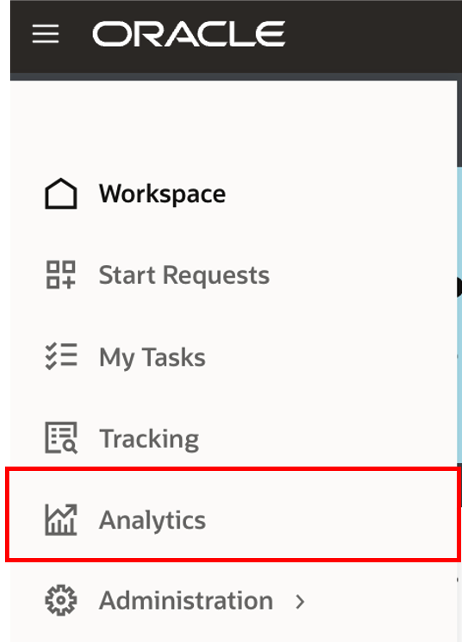
You must have MANAGE permission on at least one process application to gain access to analytics. This access ensures that users can only see analytics data for the application to which they have been explicitly granted access. Access for Process Operators and Designers to some, but not all, applications are governed through this approach.
Process Administrators who should see all process applications can be granted access to the seeded Process Application Administrator role, which would automatically grant them the MANAGE privilege on all applications.
Furthermore, for you to see data in Analytics, ensure that:
- You have MANAGE access to at least one process application.
- The process application(s) are activated.
- Some charts (e.g., Average Time) depend on process instance completion data. These will only show data once you have instances in a completed state.
Data Collection & Retention:
Data collection for Process Analytics was enabled in 23.04. This means that any instances created before April ’23 will only contain analytics data as far back as this point.
OCIPA utilizes a near real-time approach for collecting and surfacing Analytics data. This ensures that there are no long delays between process transactions and their visibility in analytics.
New Features:
The following section presents an overview of the Analytics features.
Search and Filter:
Process Analytics supports a simple search based on the following:
- Time period: search based on Past Week, Past Month, Past Year, or a Custom Data Range. The period filter is applied to all visualizations, meaning the data shown is based on your selection here. For instance, selecting Past week would ensure that all subsequent visualizations are based on data from the last week.
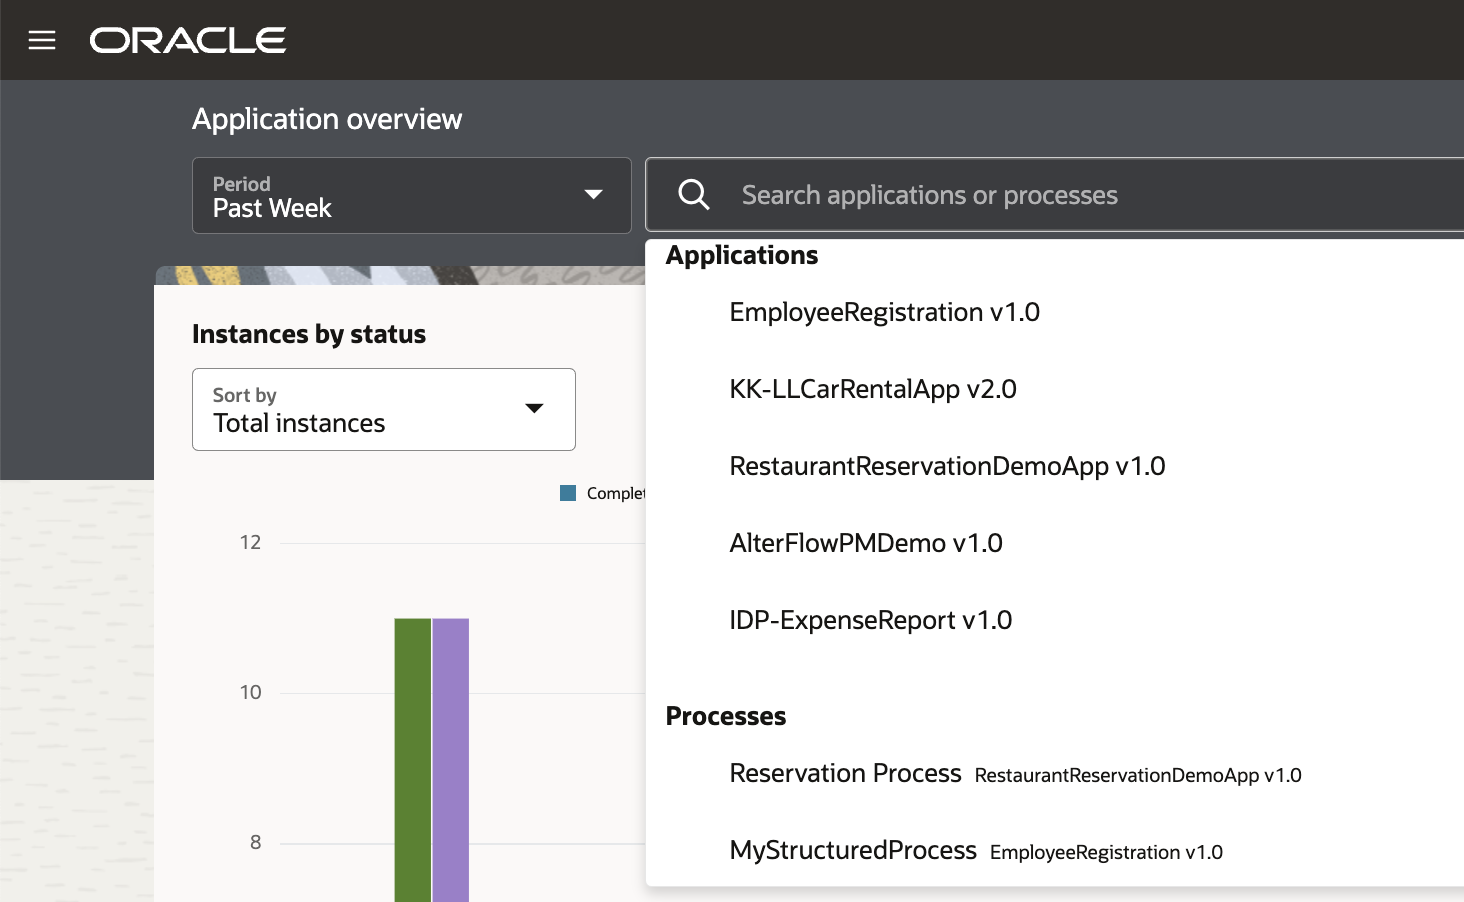
- Application/Process: This search allows you to navigate directly to an application or process. You can also navigate back by clearing your filter selection.
Application Overview
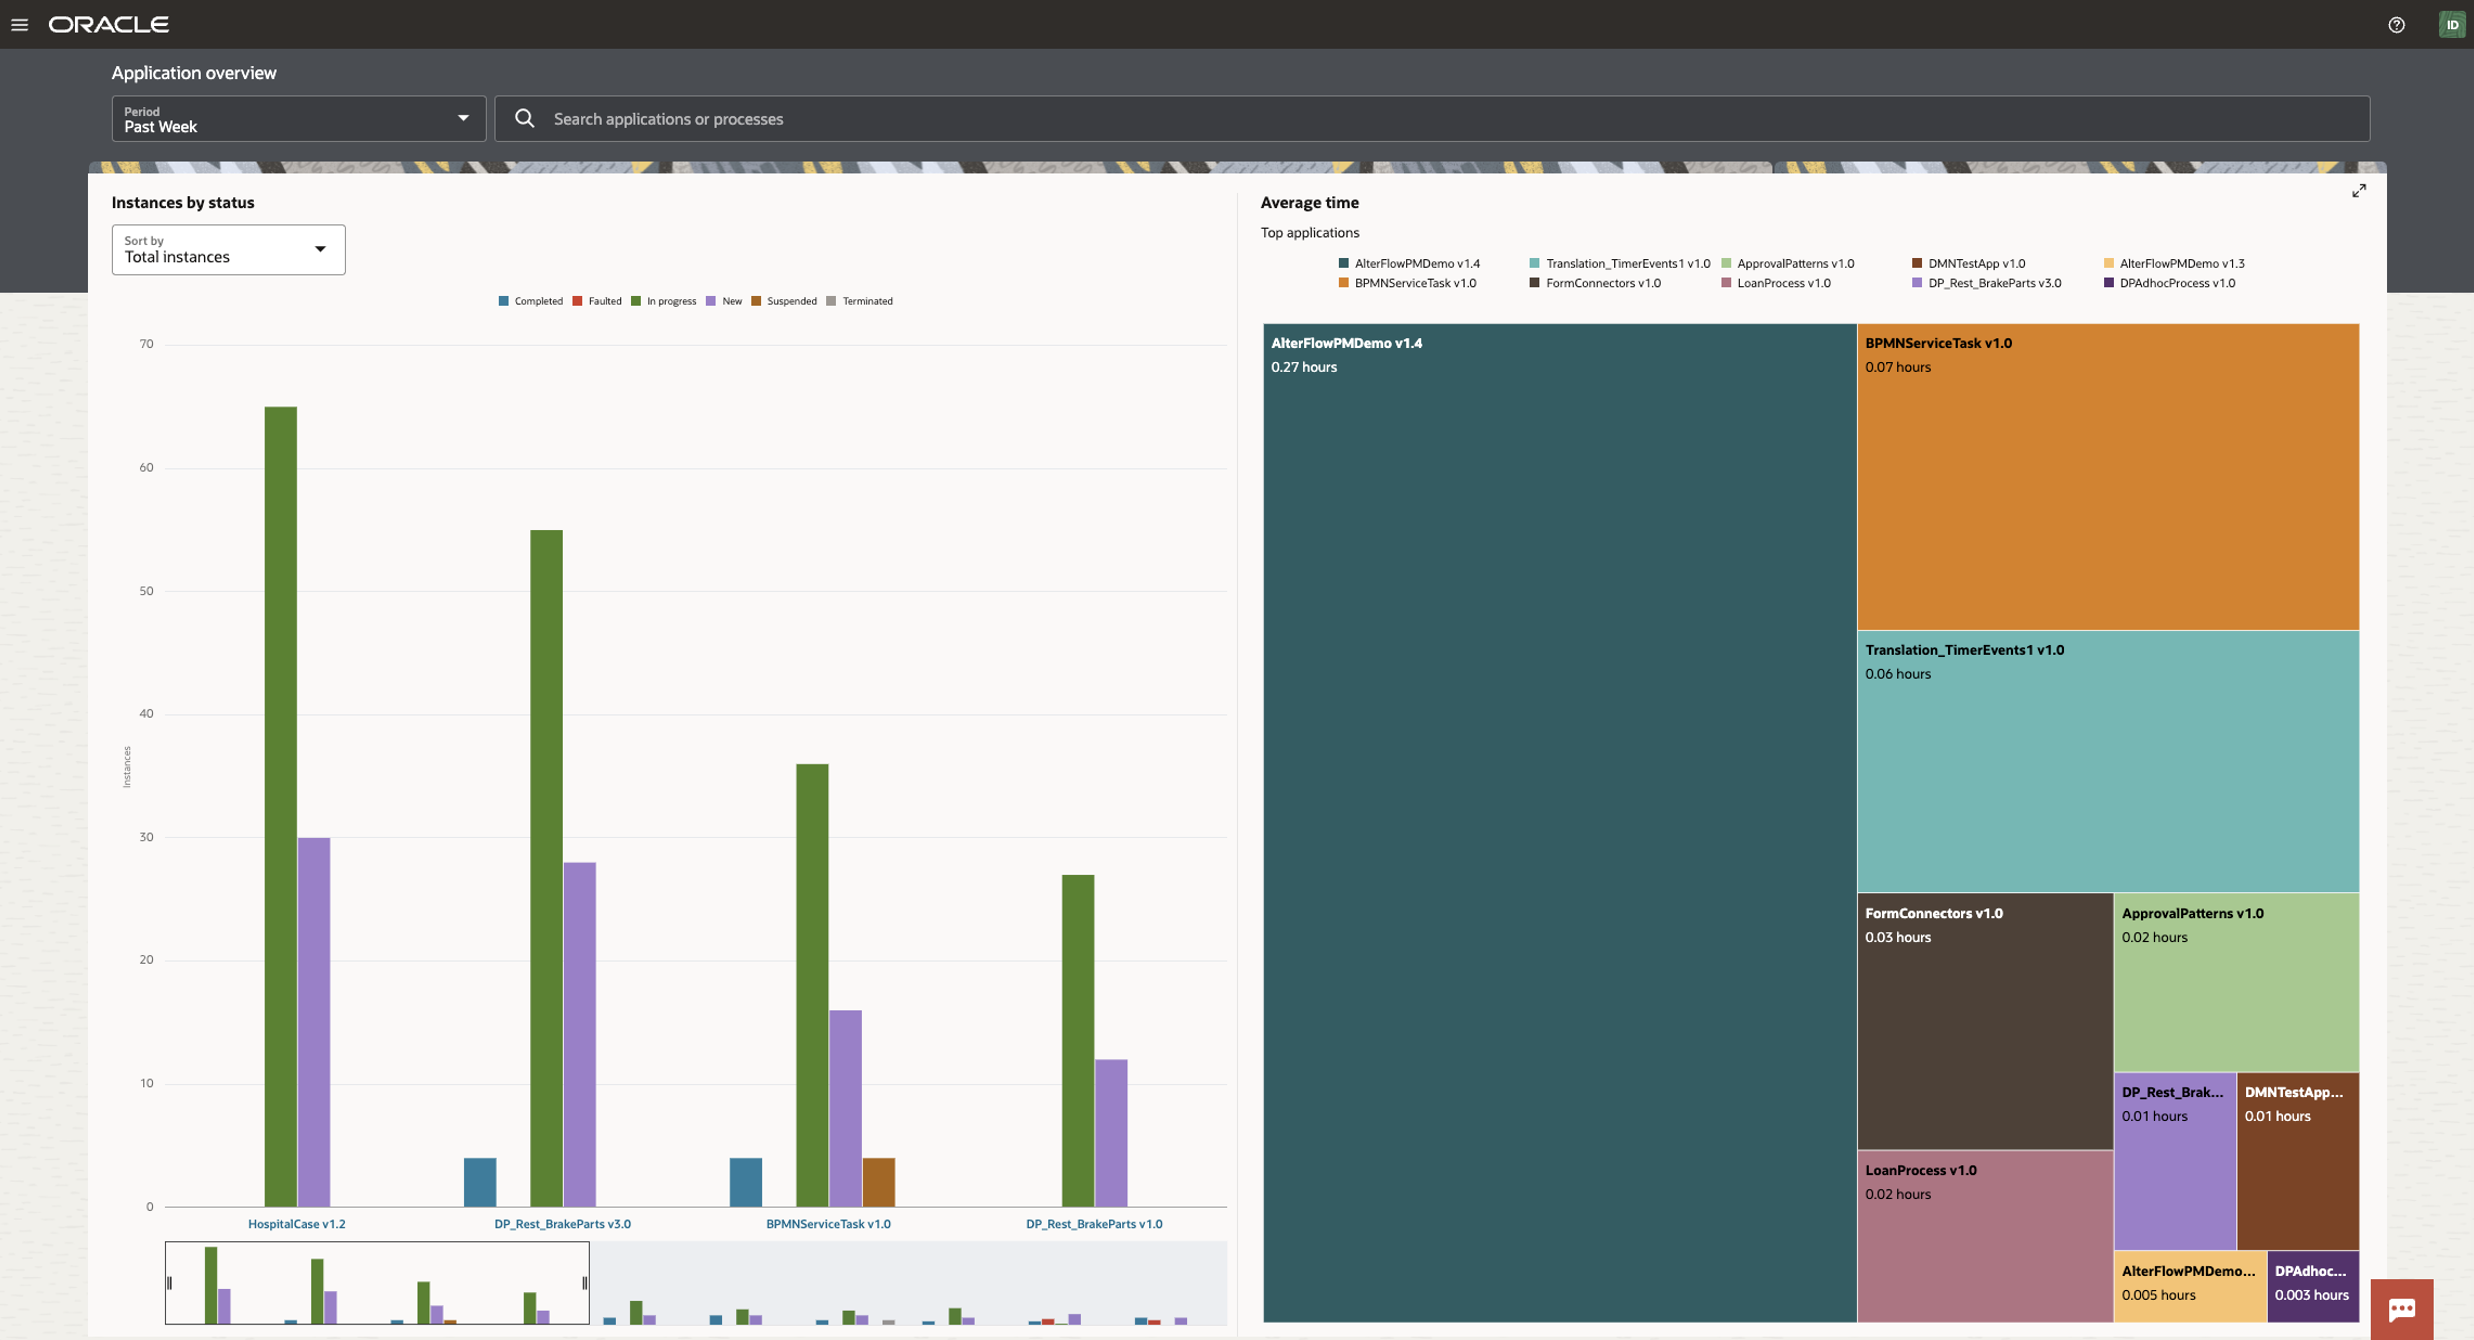
The application overview page summarizes your process instances by application (a container for process artifacts). Its purpose is to provide state and time-based indicators upon which you may want to drill down further. Here, you can see two main visualizations:
- Instances by status: this can show you which applications see the highest volume of transactions, the most demand for new instances, or have encountered the most errors. You can sort or filter this visualization based on the available process statuses. The intention here is to provide a flexible way to identify process state trends or issues you may want to investigate further.
- Average time: shows the top applications in terms of time taken to complete. This graph can help you identify long-running processes that may need attention and allows you to drill in further to answer any time-based questions.
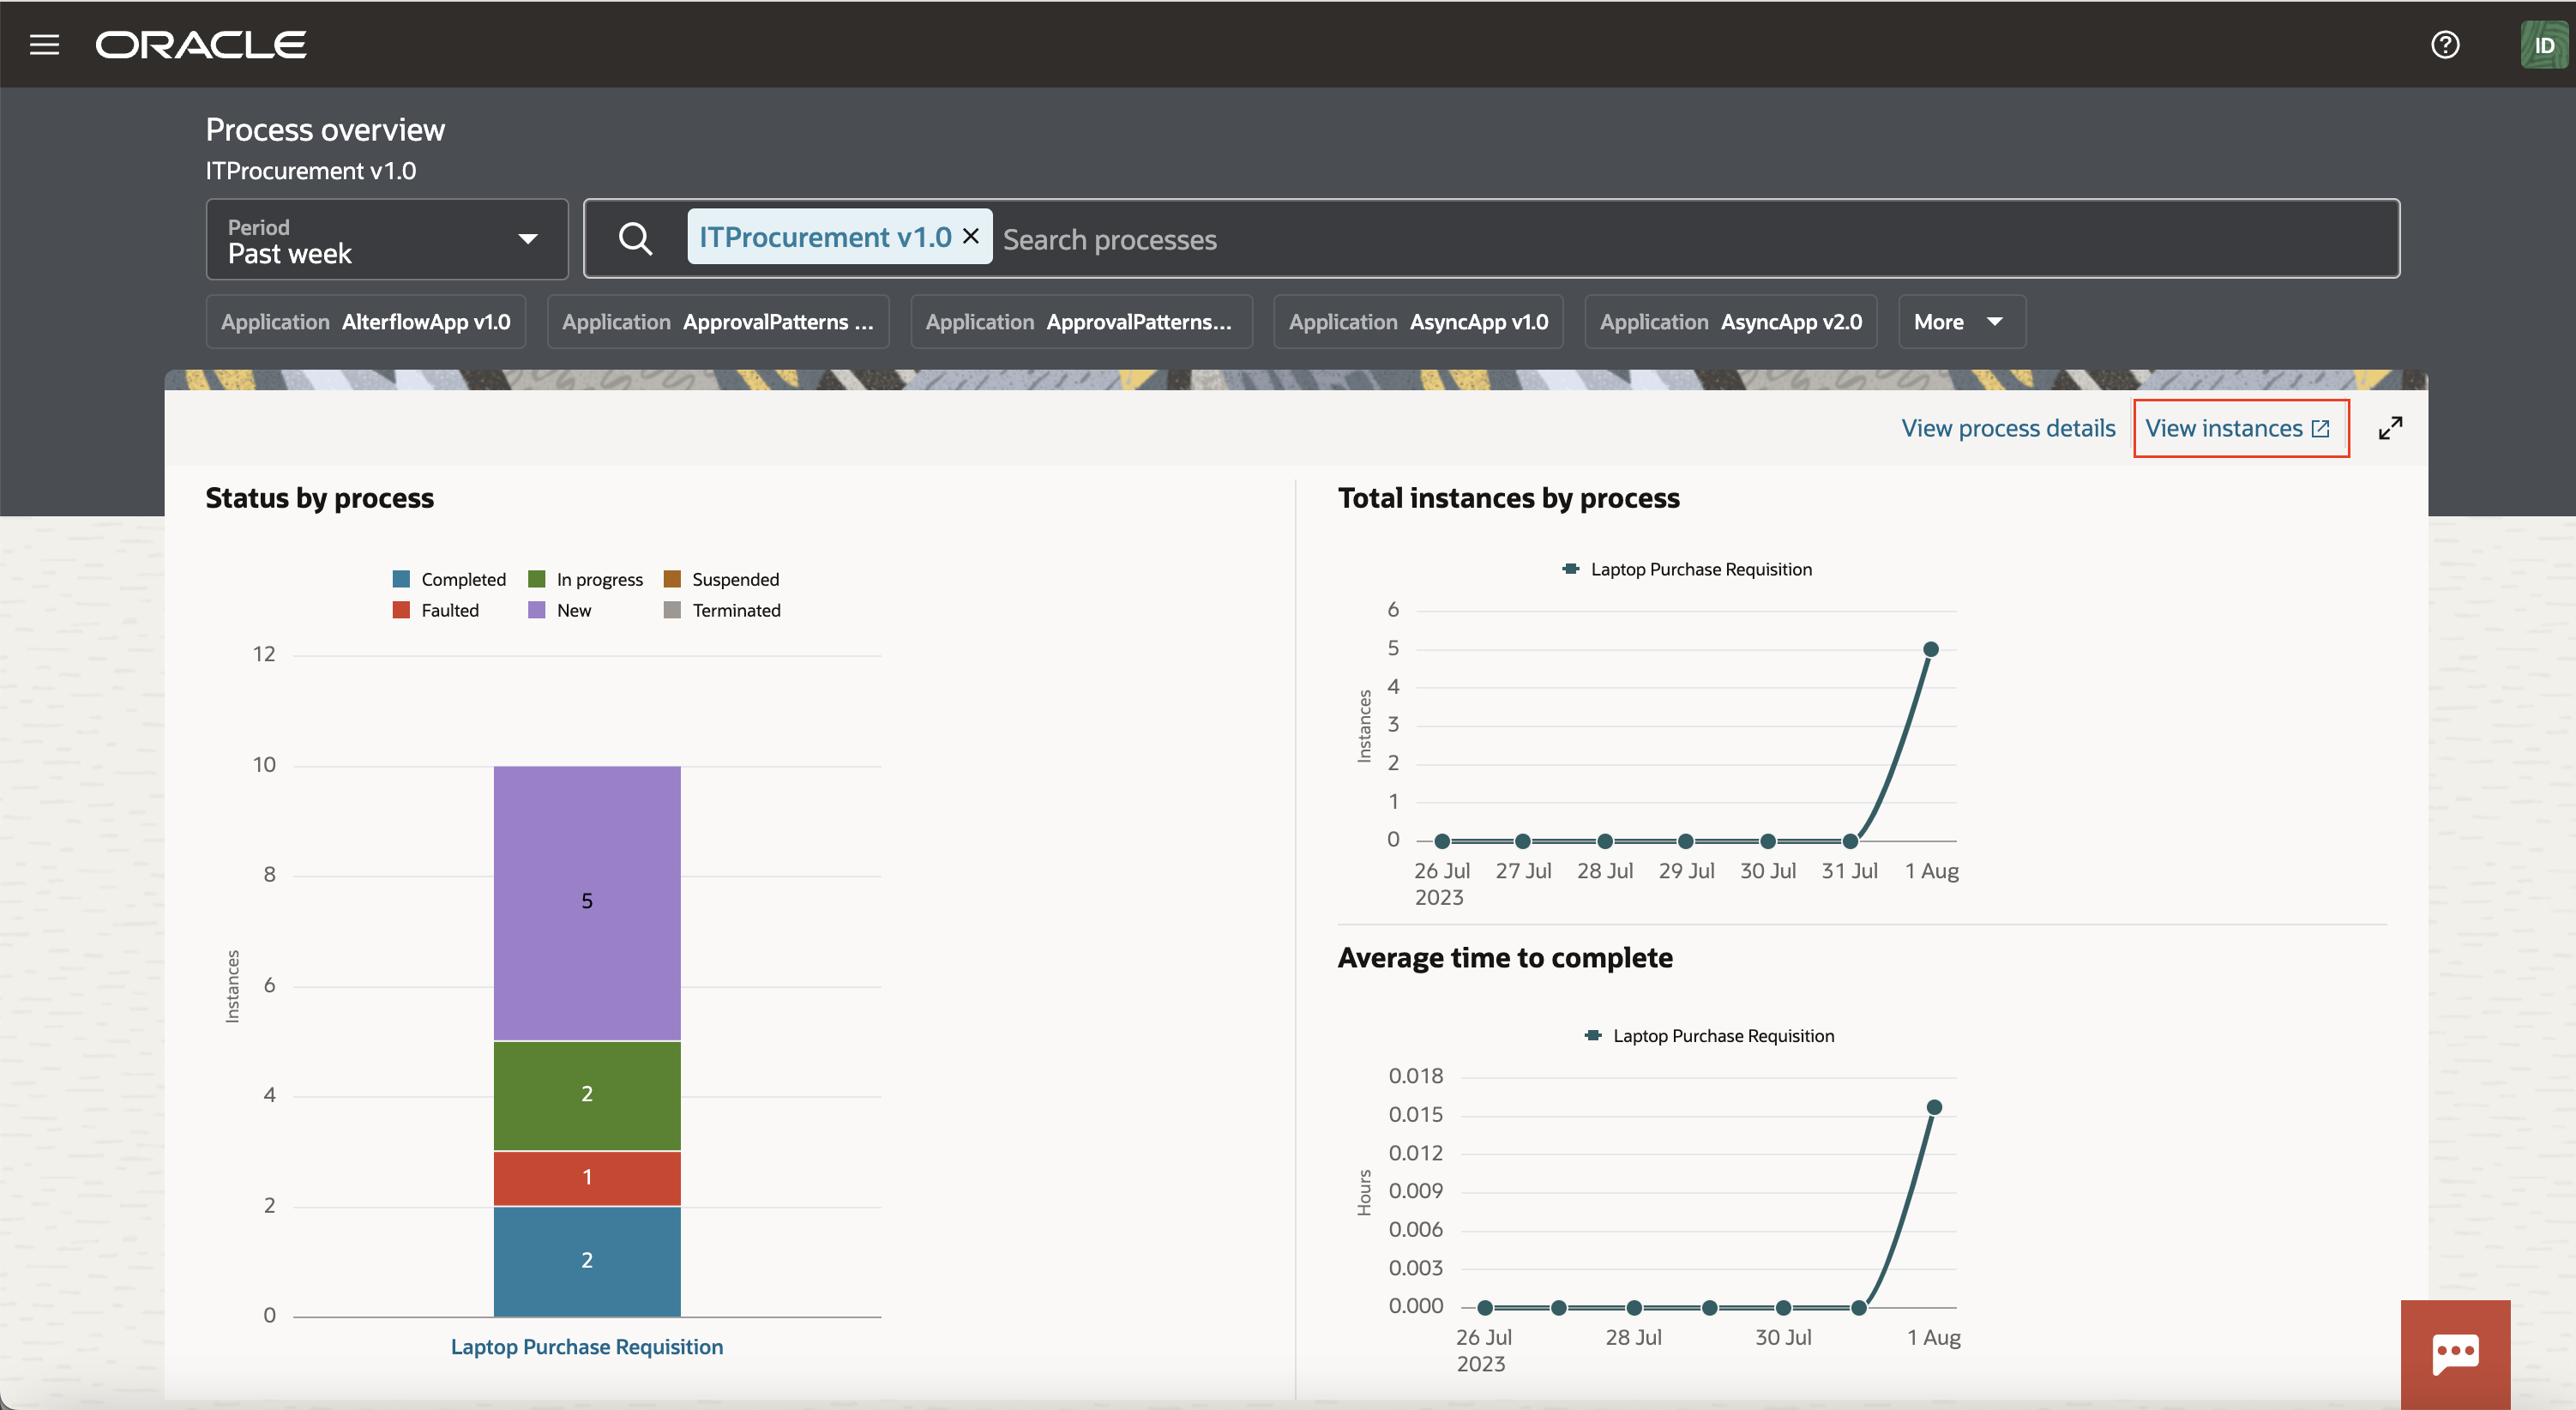
View Analytics for an Application
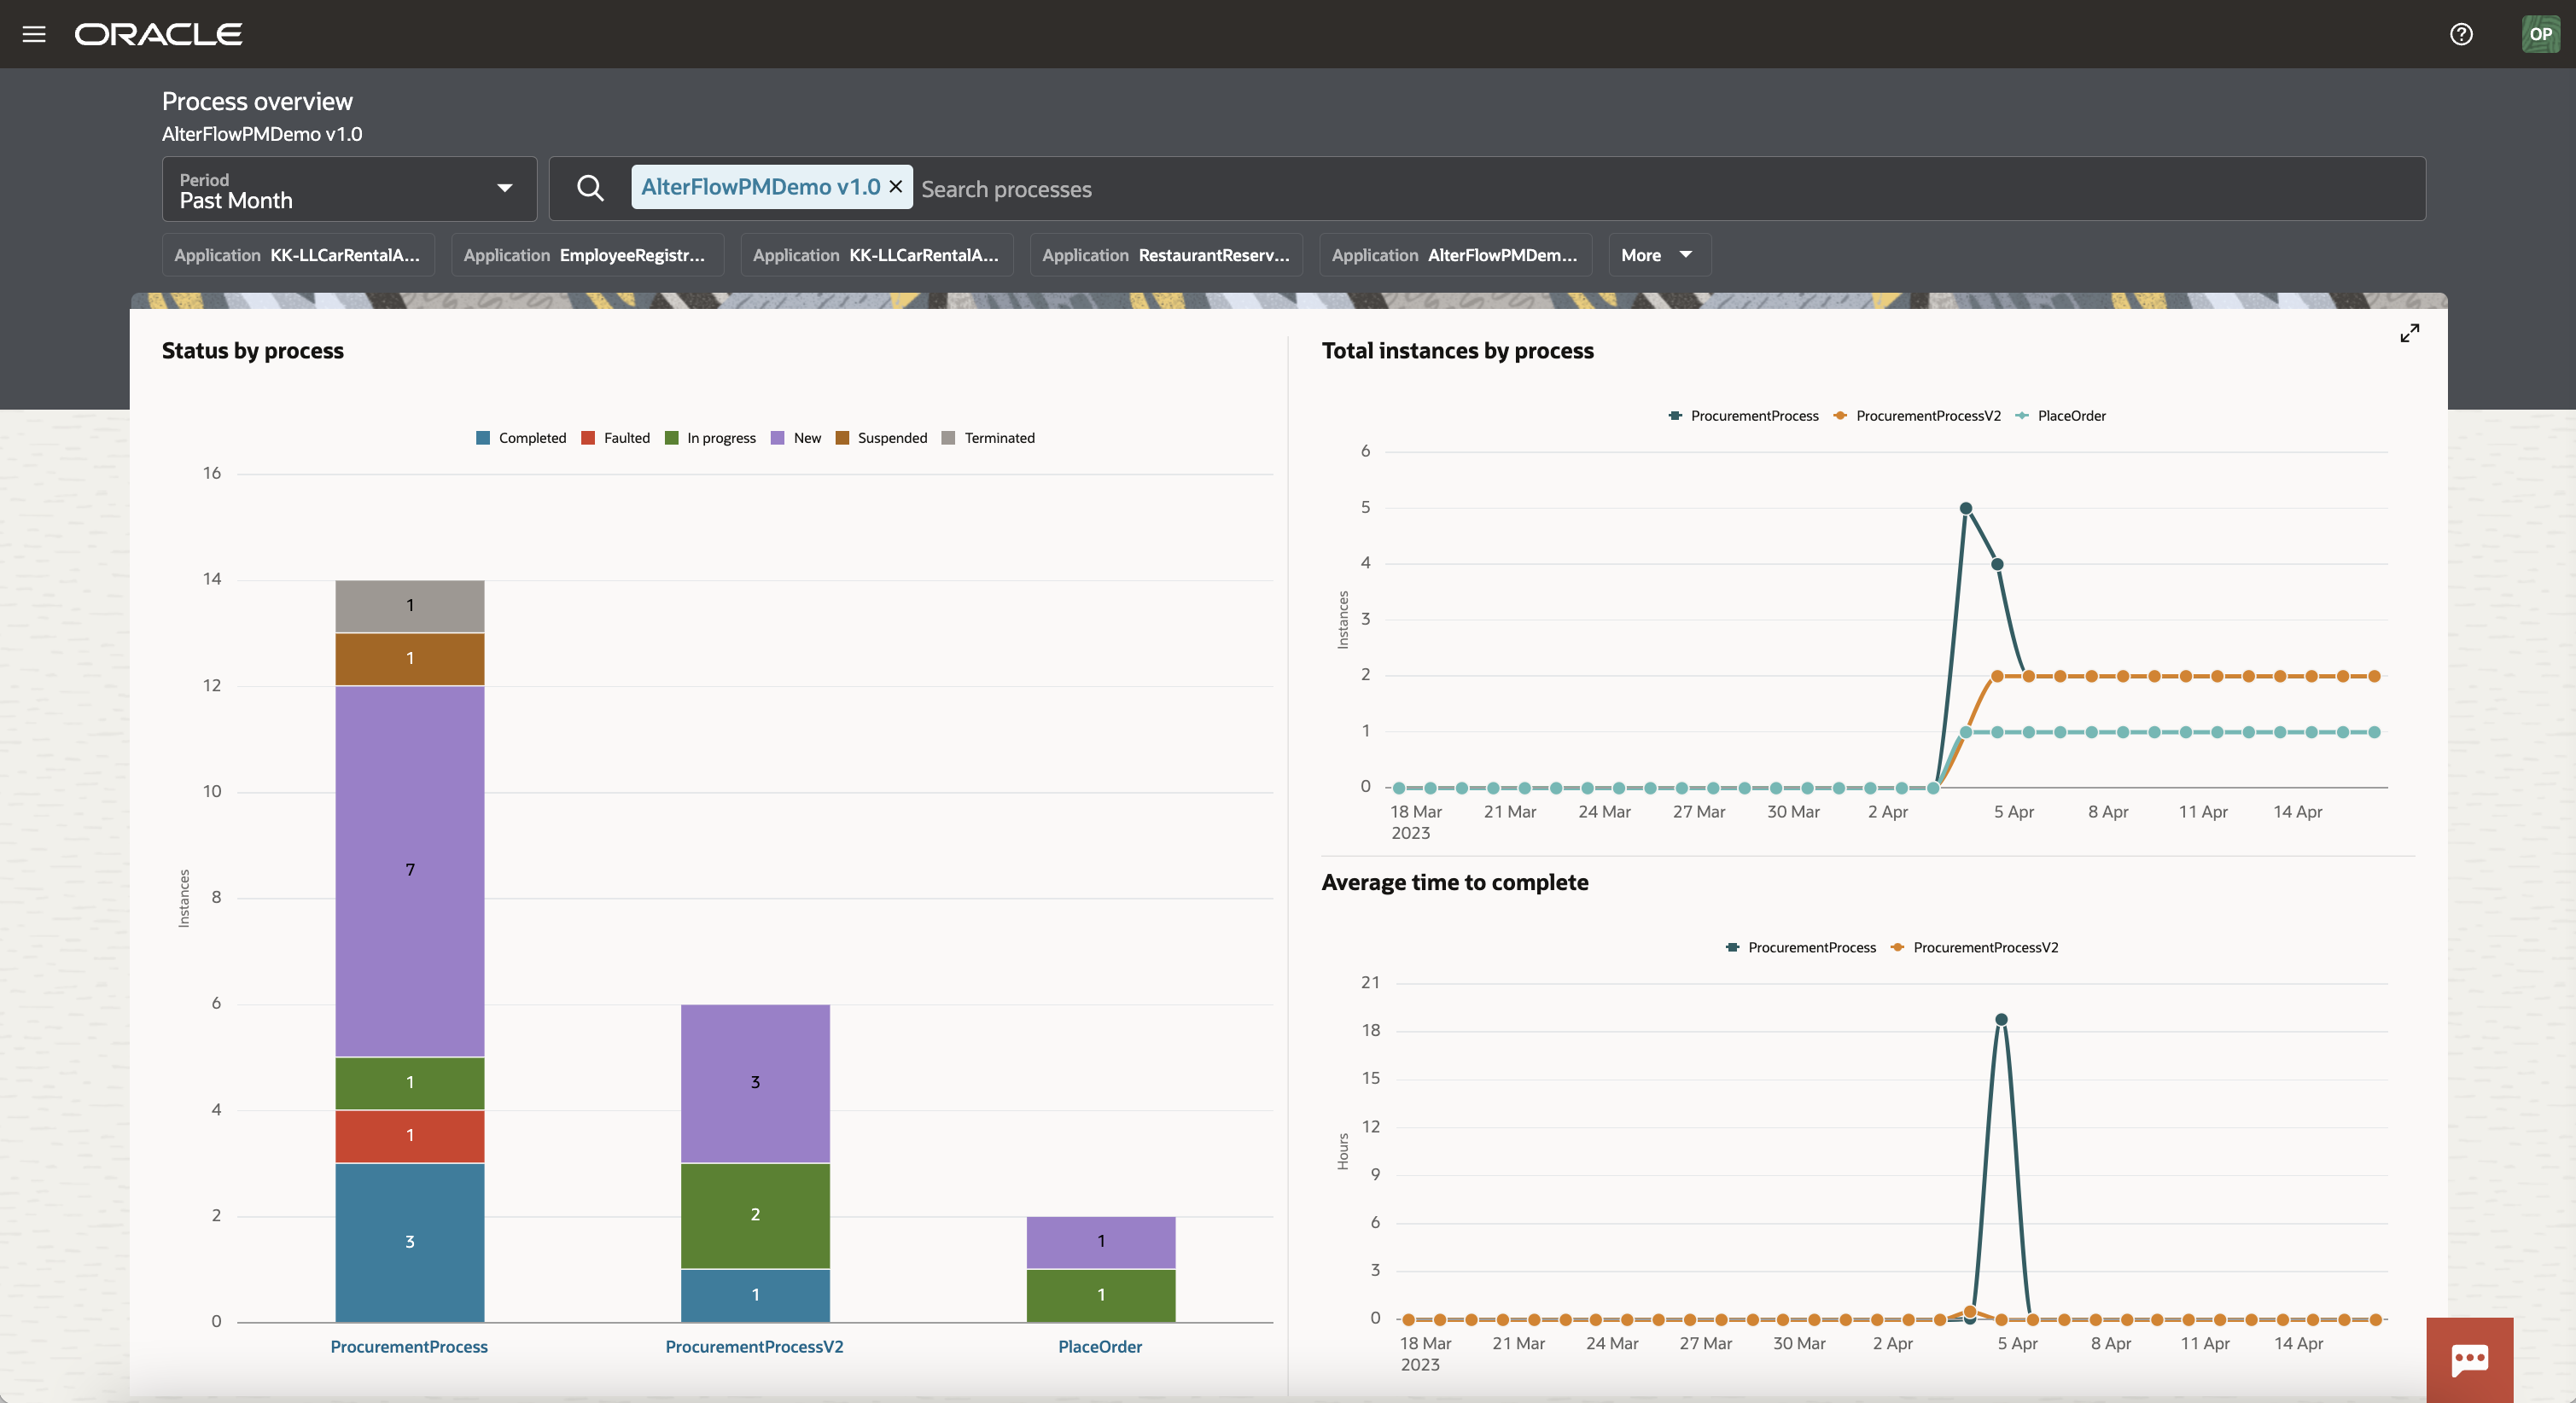
The process overview page presents a summary view of what is going on within a process application. Here, you can see the following visualizations:
- Status by process can show you which processes in the selected application are seeing the most amount of demand, overall transactional volume, or errors. It is a level down from the application view on the previous page and shows you the distribution of the previously summarized application data by process.
- Total Instances by process show you the total number of instances/transactions for each process in the selected application. The idea here is that you can see the demand for a particular process over time (based on your selected duration) to get insight into the behavior of a process.
- Average time to complete represents the time taken for each process to complete over time (based on your selected duration). It allows you to identify which process is experiencing high wait times. It serves as a more detailed view of the application-level Average Time chart we saw on the Application Overview page.
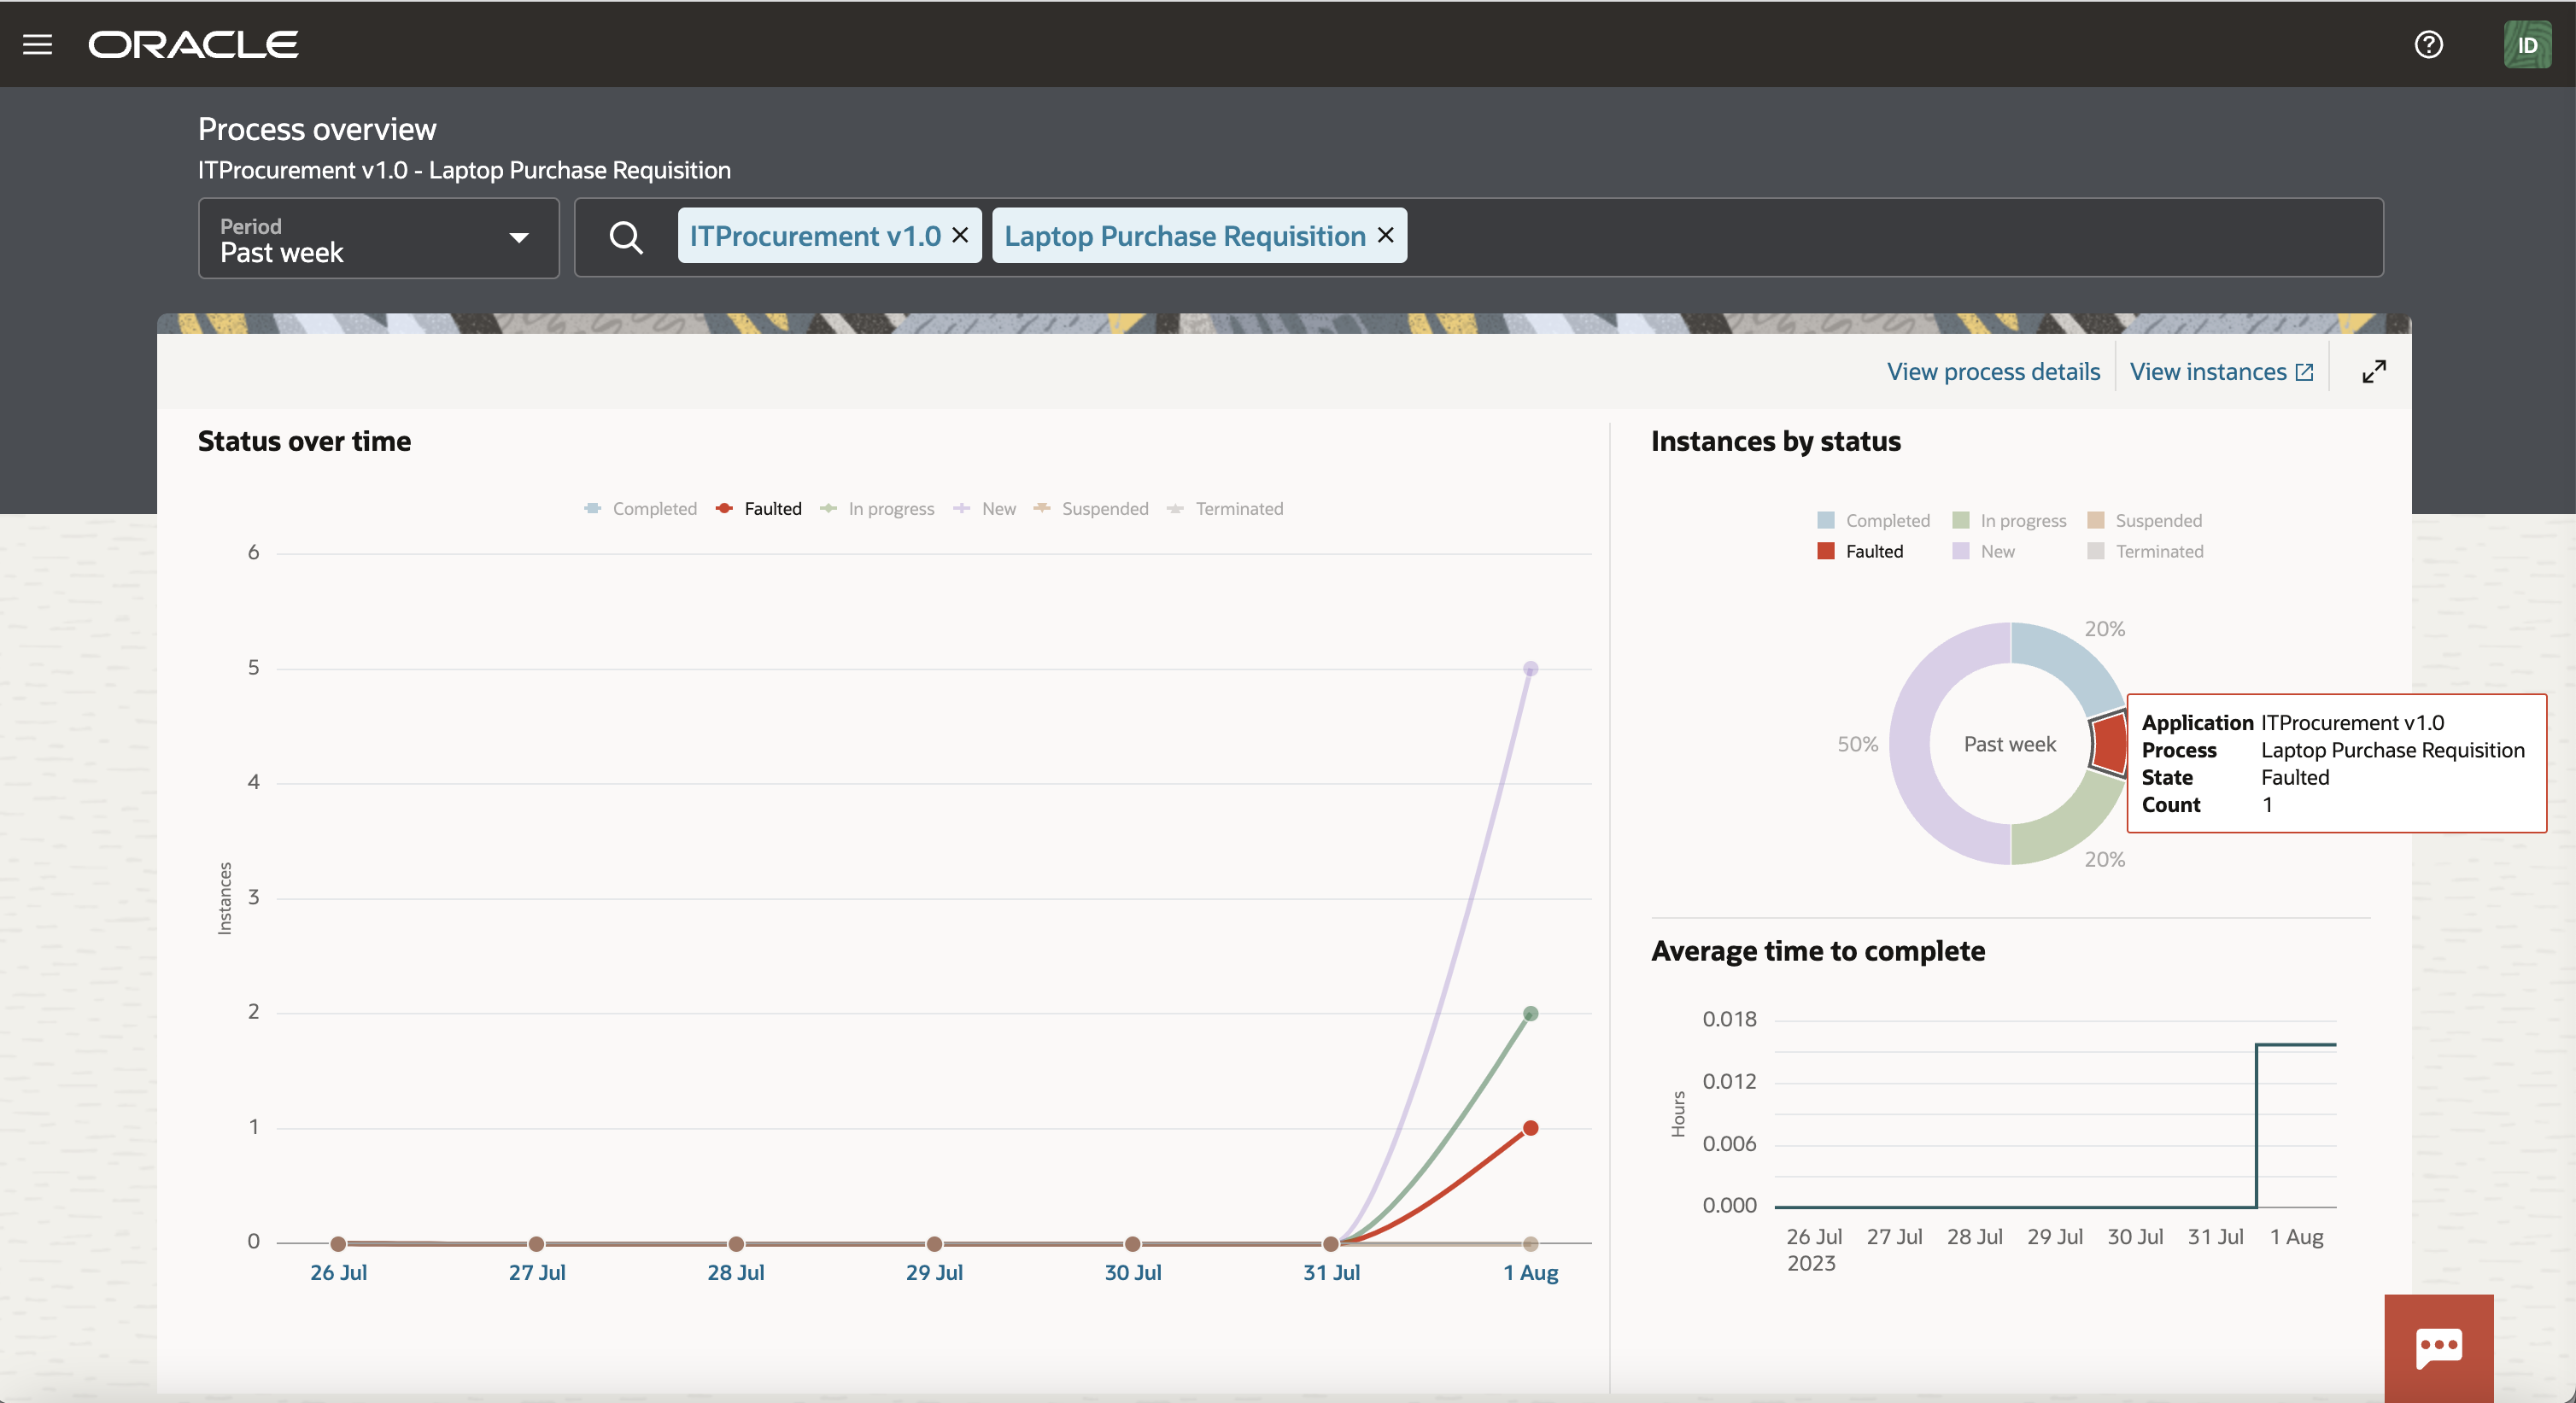
View Analytics for a Process
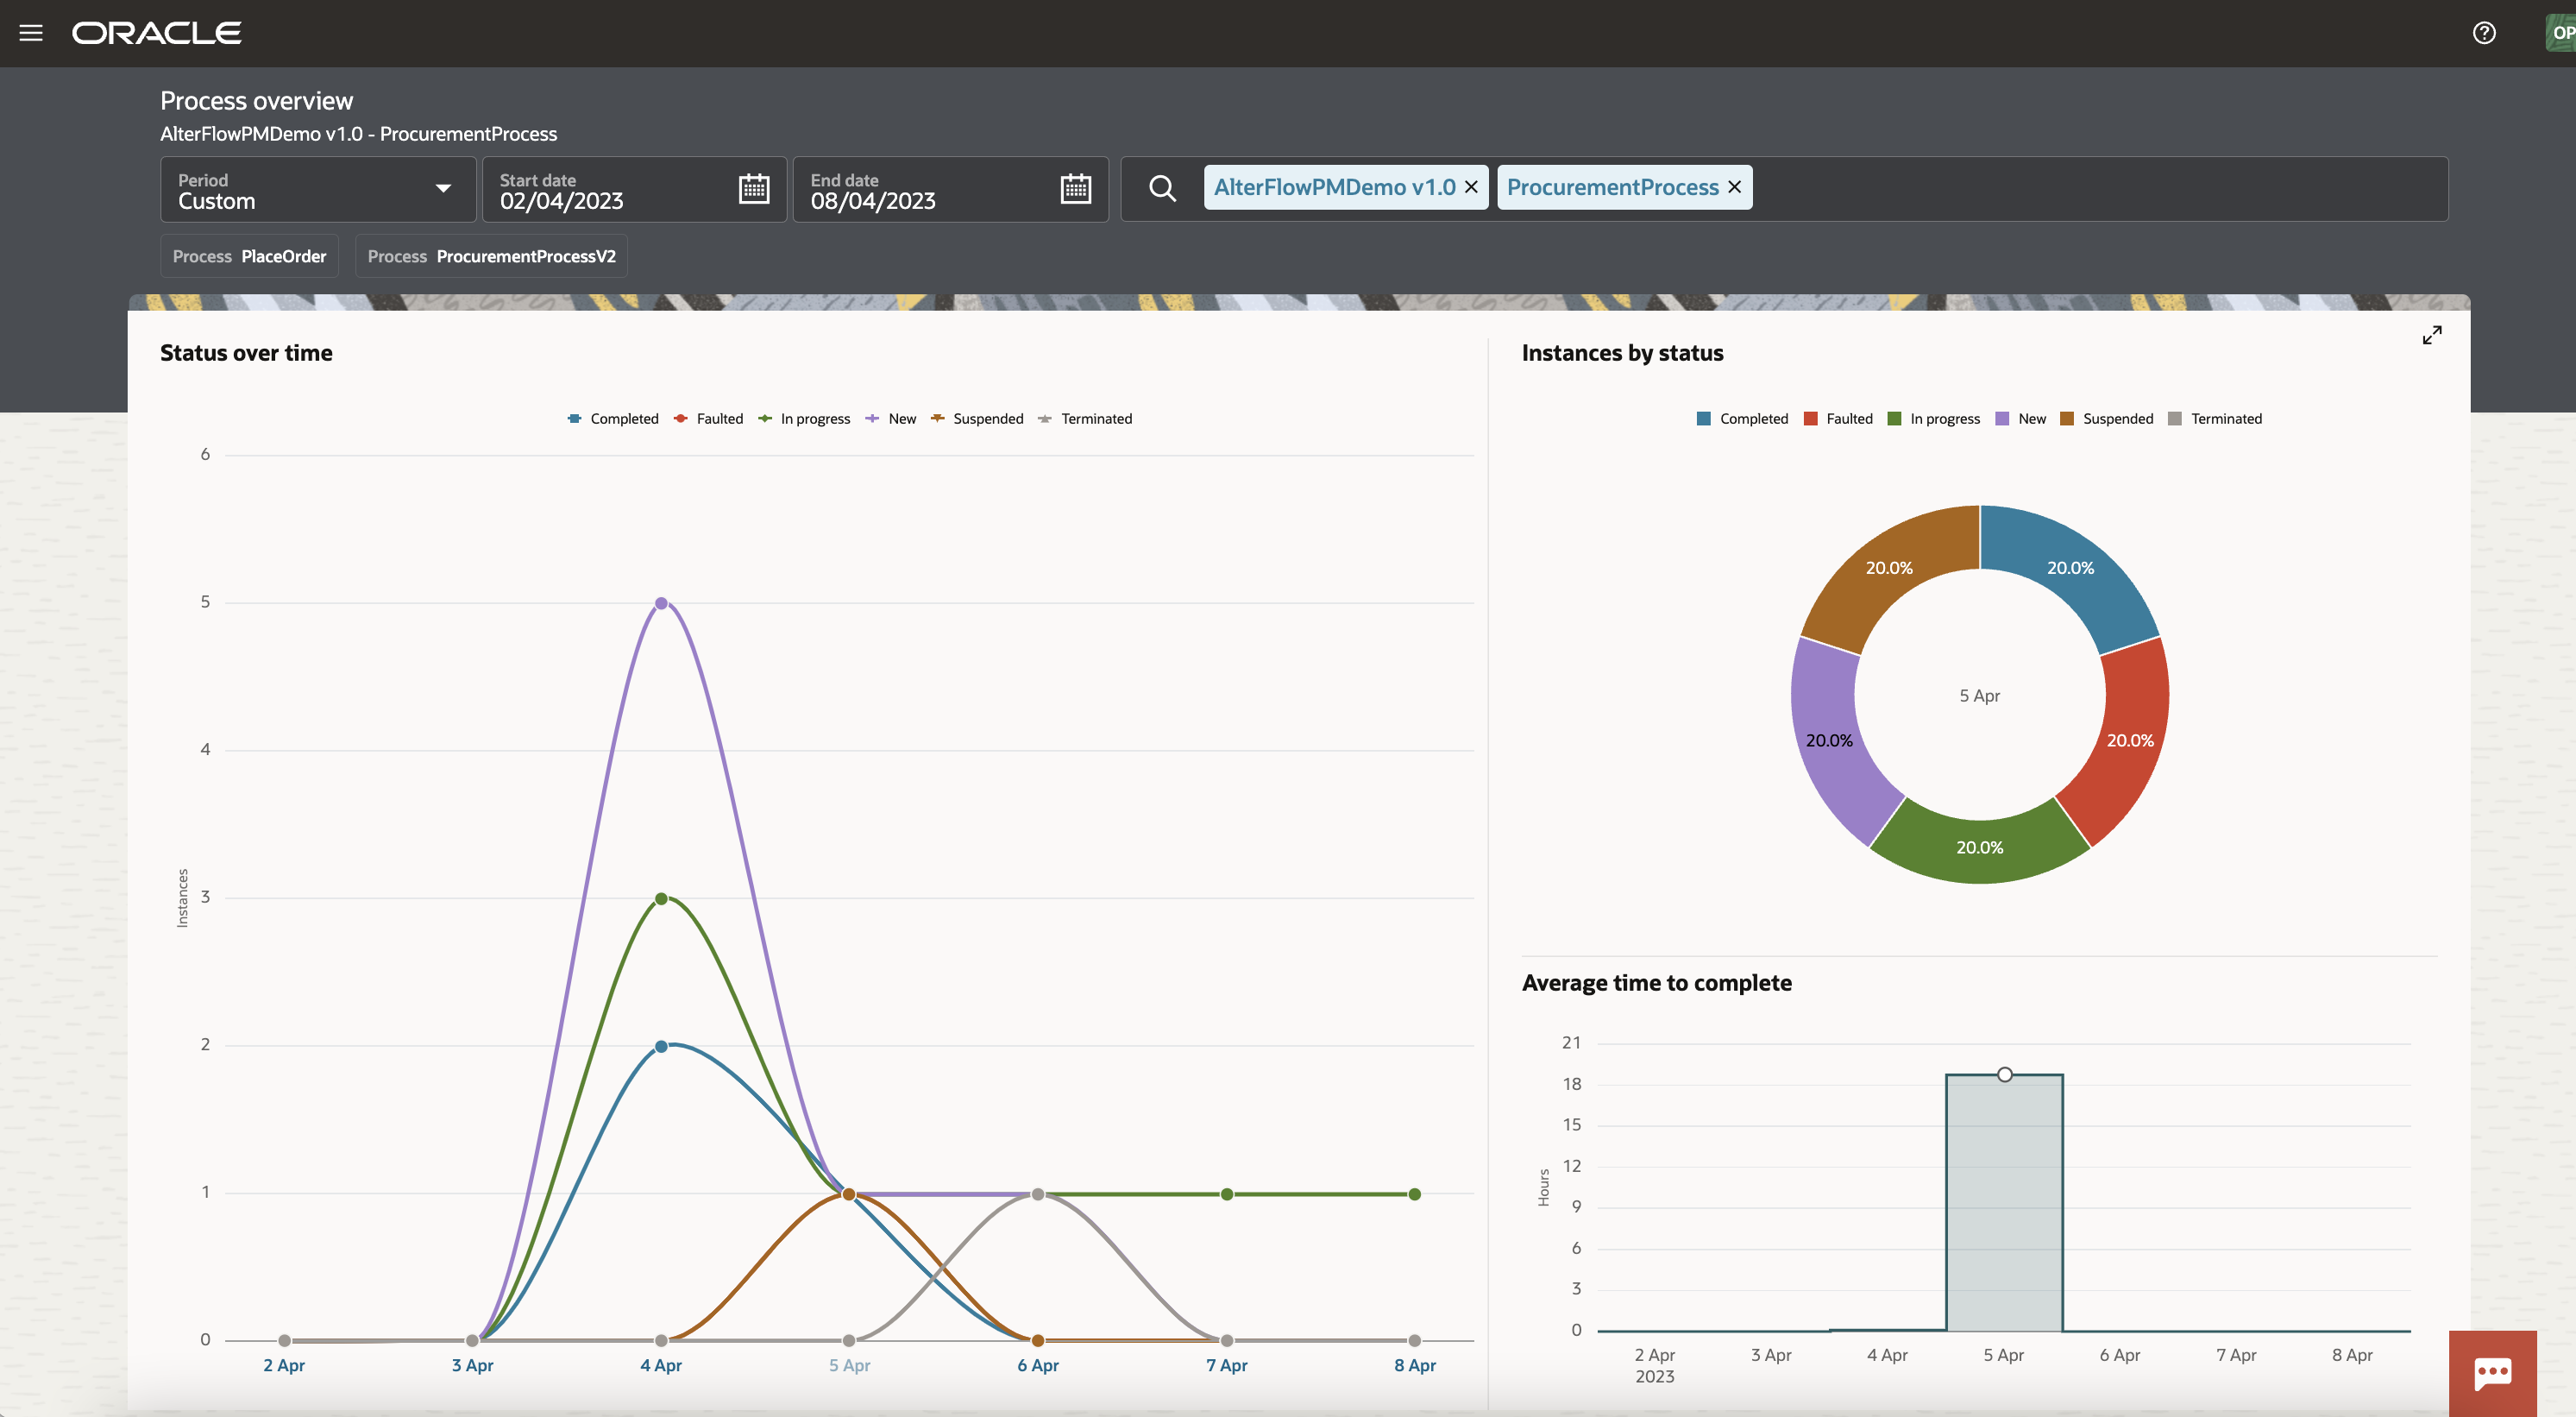
This process overview page presents a summary view of what is going on within one selected process. Here, you can see the following visualizations:
- Status over time shows the distribution of process instances by state over time (based on the selected duration). The intent of this visualization is to show you the correlation between the number of instances that were in various stages. It allows you to answer questions related to process states, such as “Are all my processes failing?”, “When is demand for my process high?” and “How many of my processes need manual intervention?”
- Instances by status: by default, it shows the distribution of process instances by state over the selected period. When a date is selected in the Status over time chart, however, the donut chart changes to show you a summary of process instances for the selected date. It serves as an easy way to answer questions such as “What is the status of this process today?” or “What was the status of this process on a particular date?”
- Average time to complete represents the average time taken for the selected process to complete over time (based on your selected duration). It allows you to identify when the process is experiencing high wait times by showing a trend over the selected time range.
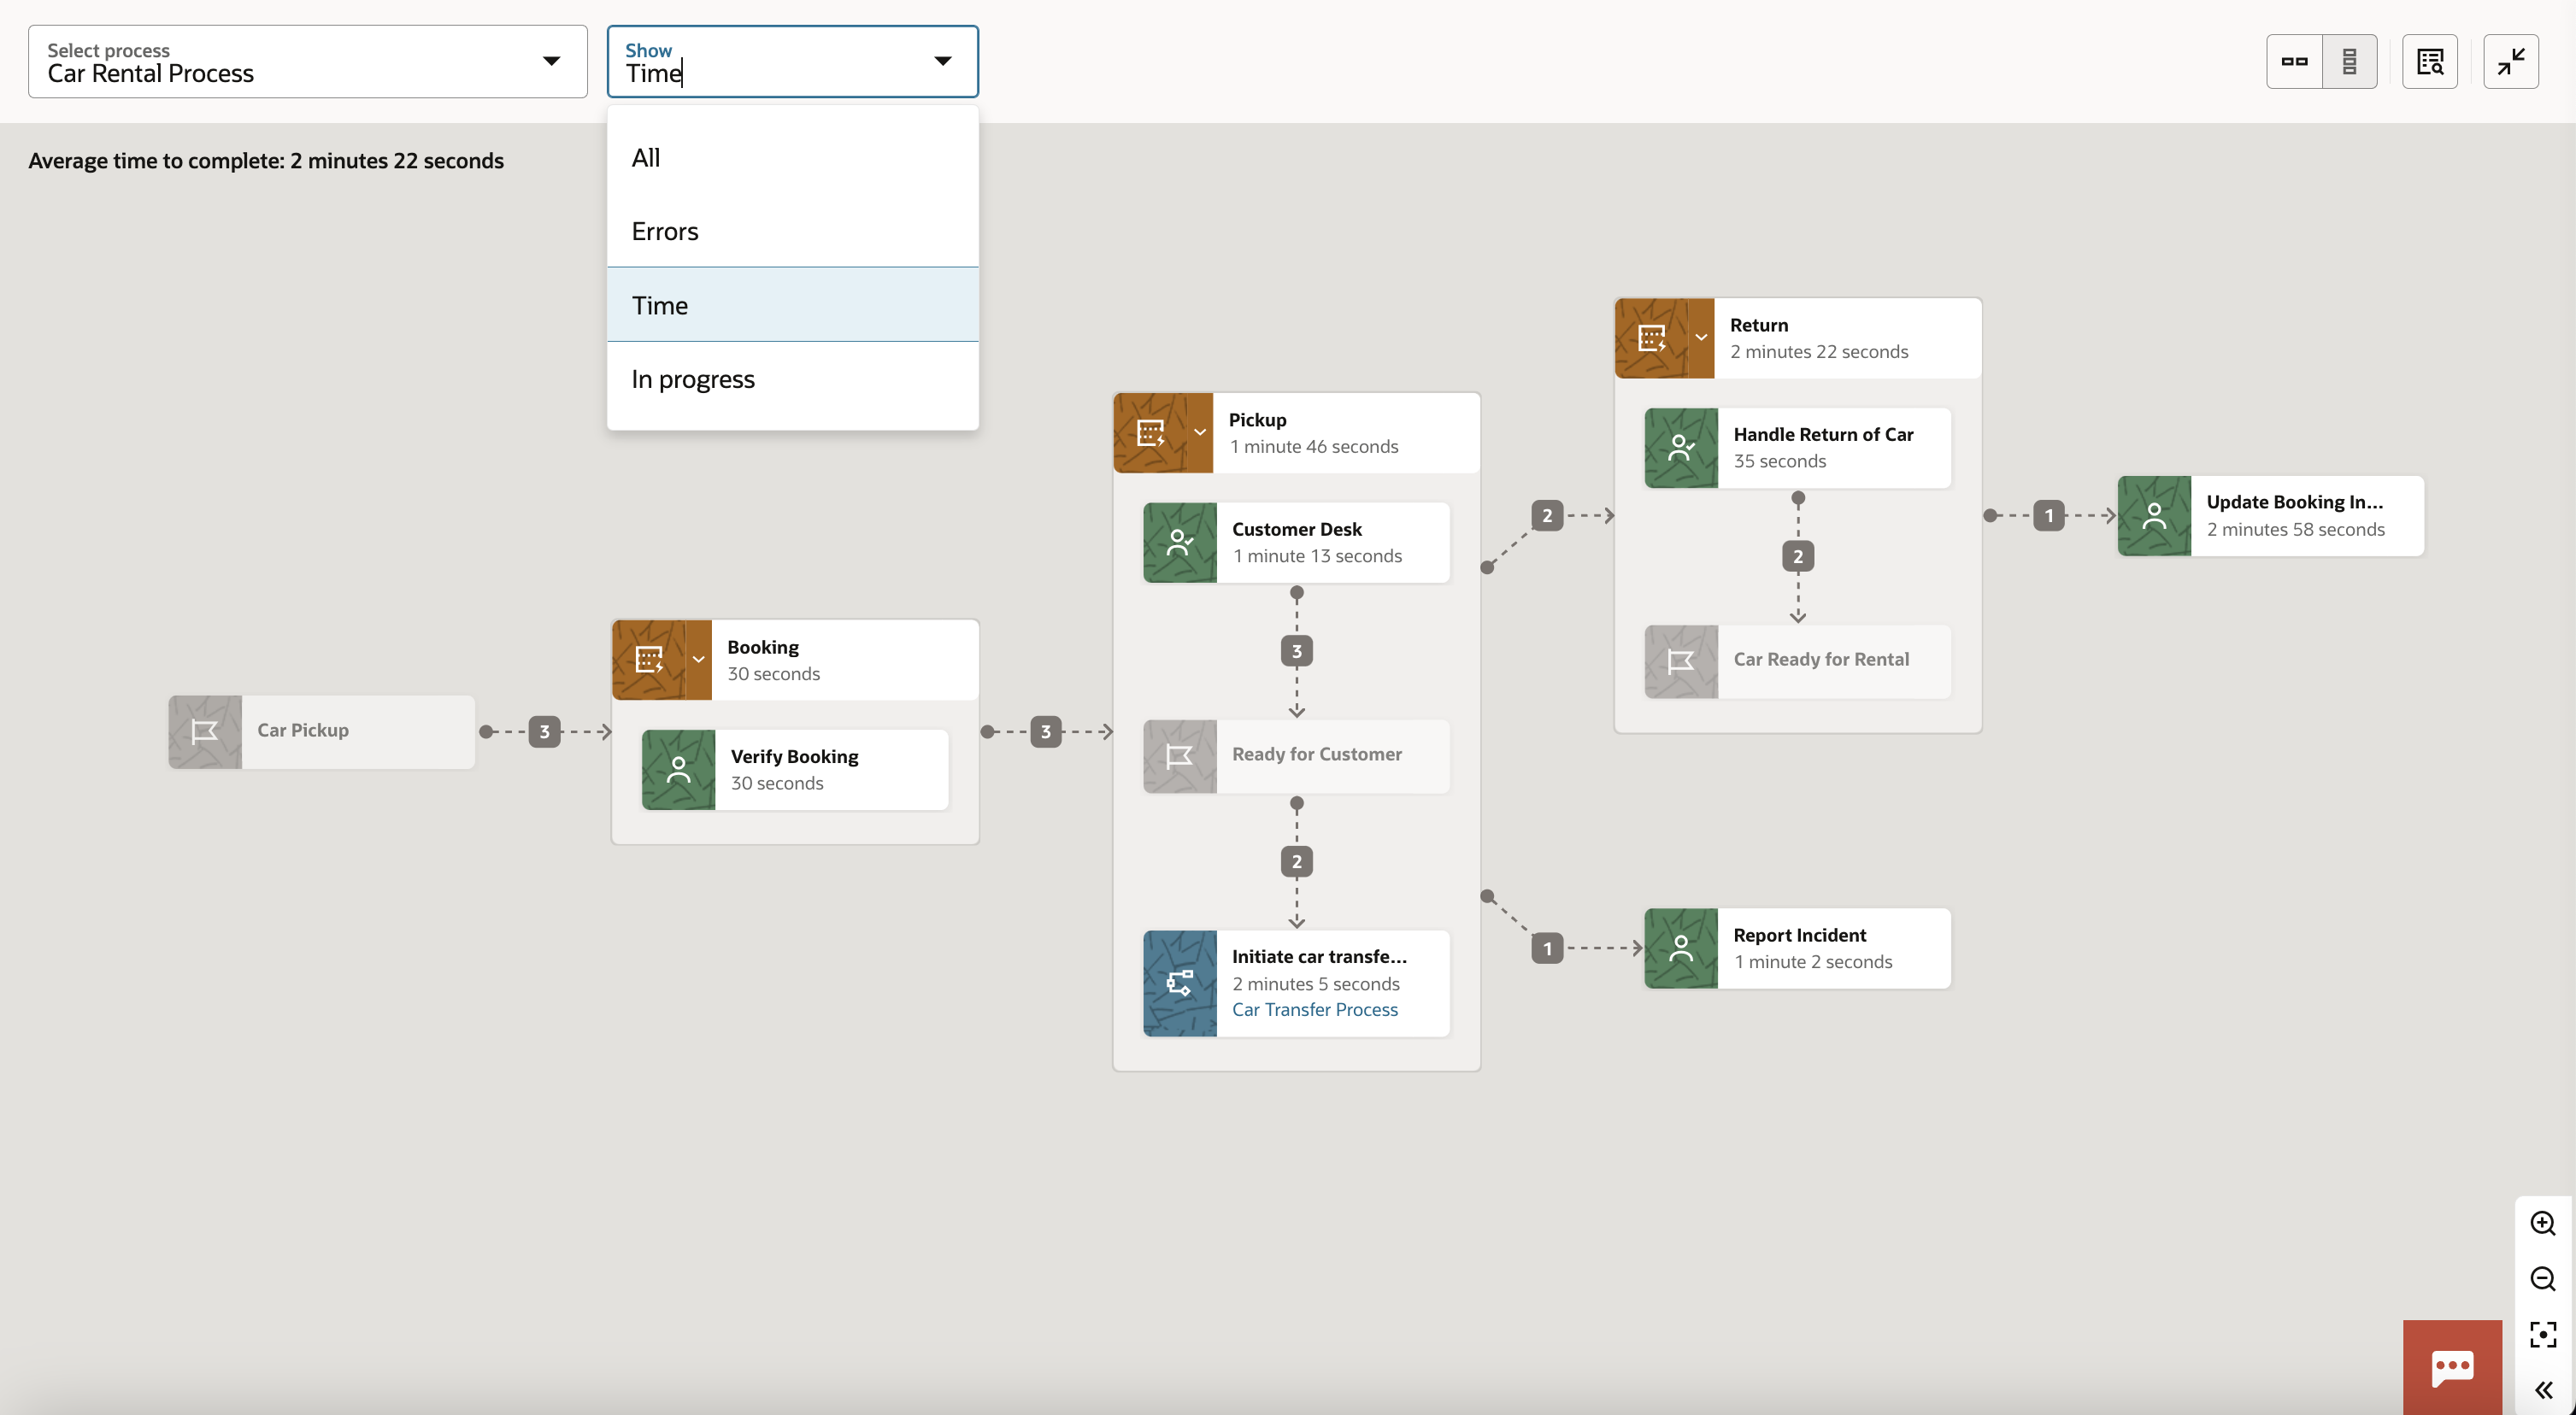
View Analytics for Activities within a Process (NEW in 23.06/23.10)
The Process Details view lets you see what happens within a selected process through data we collect from related instance executions. You can use this view to:
- Monitor the current state of process executions:
- This allows you to see where in-flight instances are currently by presenting the activities that hold in-progress transactions. This is useful when users need to understanding the current state of a process.
- Understand the flow or paths that process instances take:
- This lets you see the activities that have been executed, their relationships to other activities, and the frequencies of each traversed path. In other words, the process flow. This helps you see patterns that could cause inefficiencies, introduce bottlenecks or bypass compliance and organizational requirements.
- Understand the average time taken for activities to complete:
- This allows you to see exactly which tasks contribute to the average duration time of a process and by how much. This information can be used to identify potential problems with actioning tasks assigned to human actors.
- Understand where errors occur and why:
- You can now see where errors are occurring and how often. This view is a great indicator to prompt further drill-down to determine root cause.
As of the 23.10 release, the Process Details view offers two visualization options: a graphical view (default) and a list view. Although they present the same activity information, they both have specific usage patterns. The graphical view focuses on showing context around activity relationships, while the list view adopts a tabular style representation, which makes it easier to sort through a large number of activities to find something that you are looking for (e.g., sort by errors or average execution time). You can toggle between these views at any point.
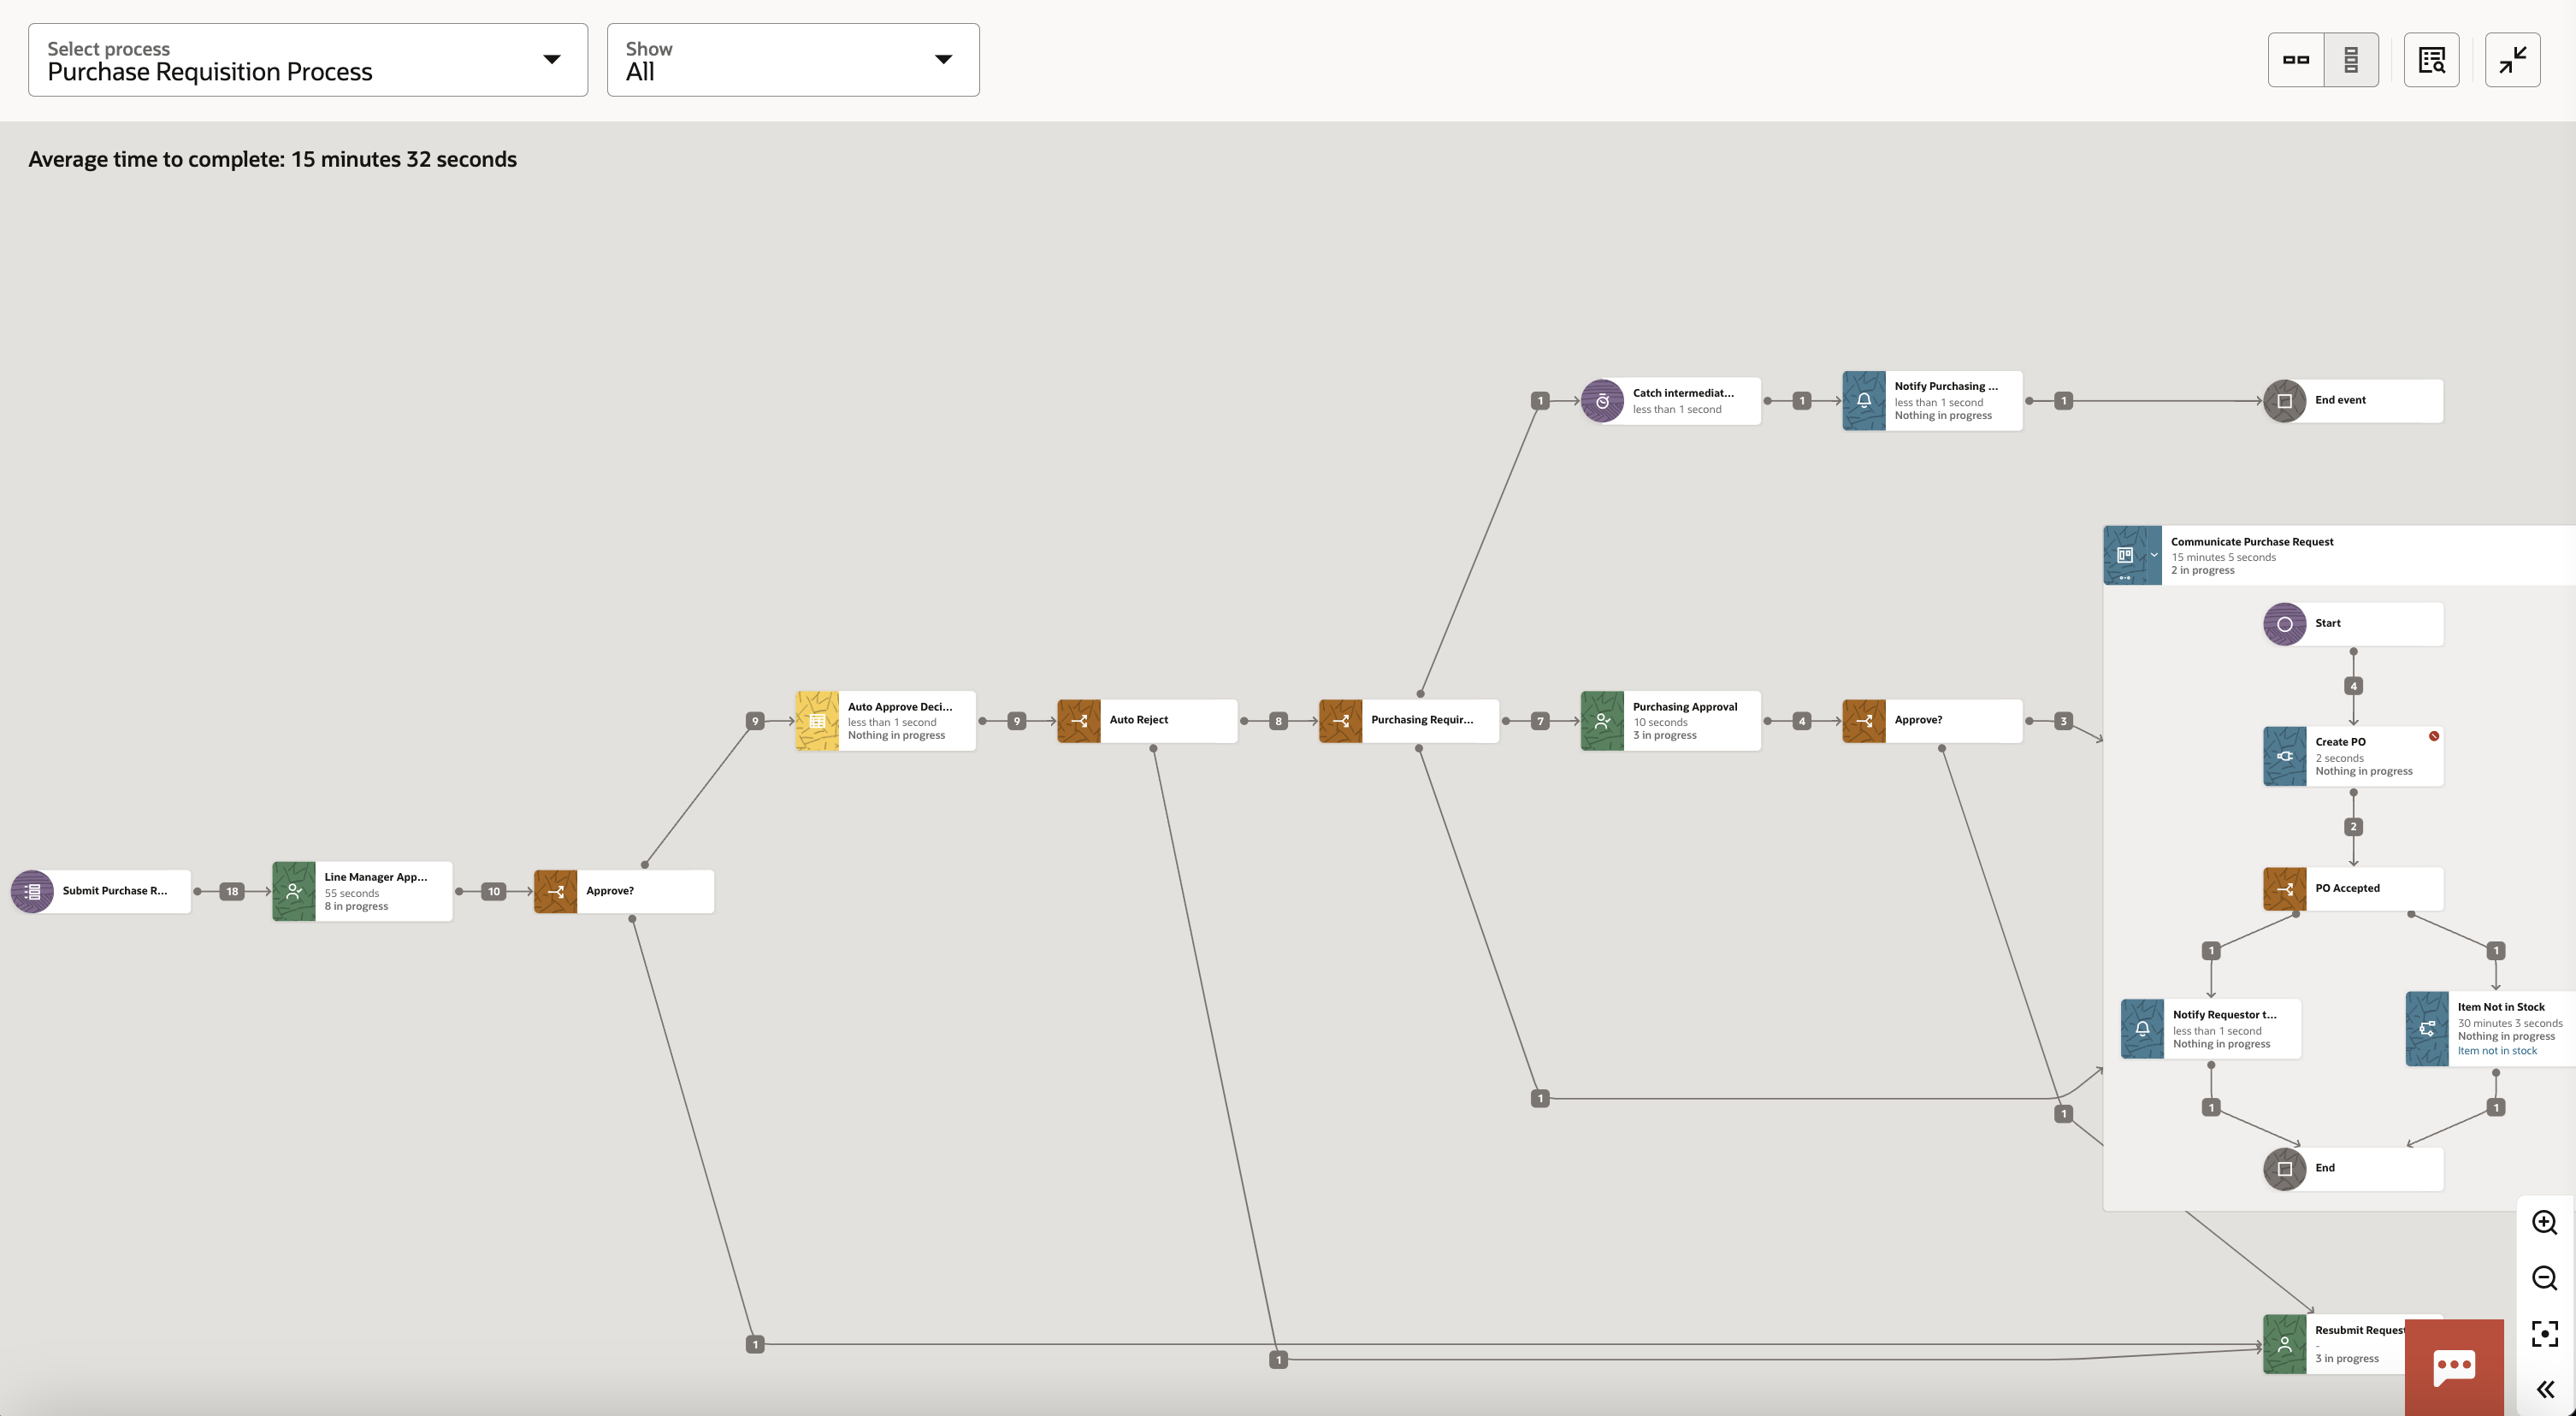
The Process Detailed view supports both Structured and Dynamic processes, so no matter which design pattern you adopt, you can rest assured that analytics data will be available.
Additionally, when you want to focus on answering a particular question, and you want the view just to show you the relevant data, you can use our show lens to remove noise:
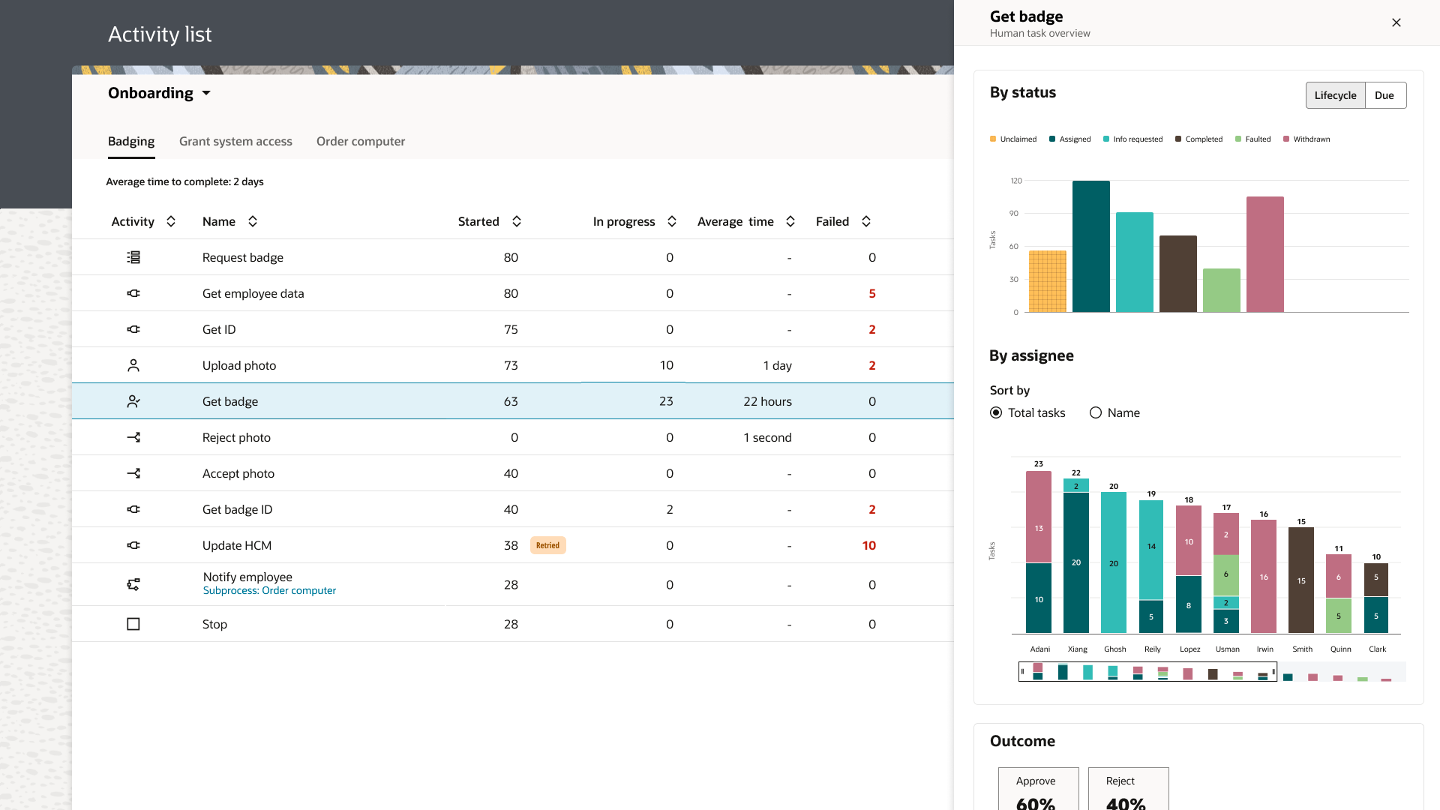
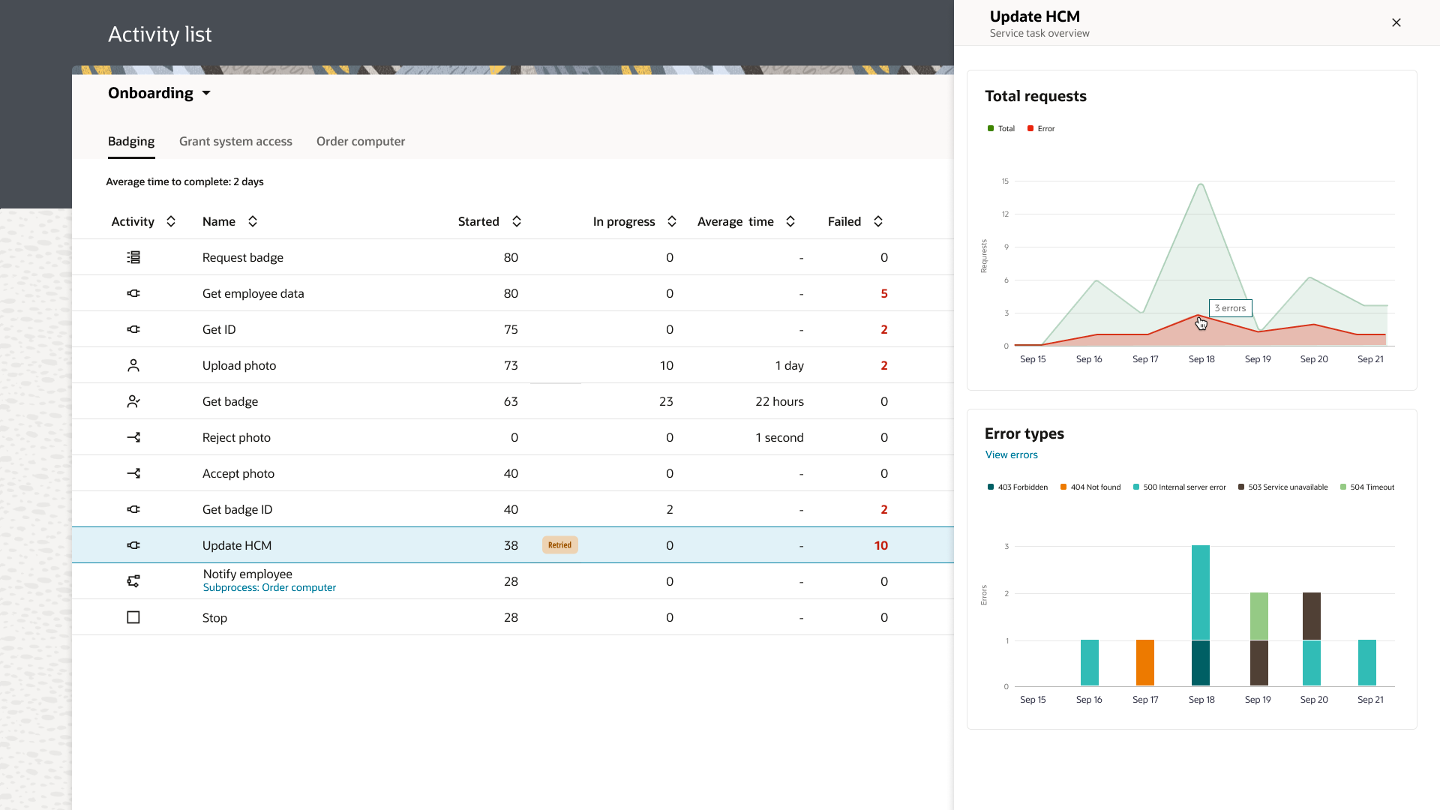
The Process Detailed views (graphical & list) also support activity-based analytics for Human Tasks and Service/Integration activities. By clicking on one of the supported activities within your process, a right-hand draw will provide further insight. Here is what you can expect to see for these activities:
Human Tasks:
- The number of tasks in each lifecycle state (Unclaimed, Assigned, Completed, etc.)
- The number of tasks Due (On Track, Overdue, Expired)
- The assignees (human actors) are involved in actioning these tasks, as well as a breakdown showing the number of tasks they have assigned to them by lifecycle or due state.
- The frequency of outcomes taken on approval tasks
The net-net of this is that we help you answer questions such as:
- How many tasks are not on track, and who are they assigned?
- How many tasks are assigned to a team queue but have not been claimed?
- How many times are we requesting more information?
- What is the workload breakdown by assignees? (who is/is not active)
- What is the outcome people usually take on approval tasks?
Service / Integration Activities:
- A trend analysis of total requests vs. those that resulted in an error
- An HTTP Response breakdown of errors showing you the reason why these API requests have failed
The net-net of this is that we help you answer questions such as:
- How many of my API calls are encountering issues?
- What is the cause of these issues?
- Is there a time-based or error-type pattern to these issues?
The Activity List view can be accessed via view process details links now available on the Process Overview pages.
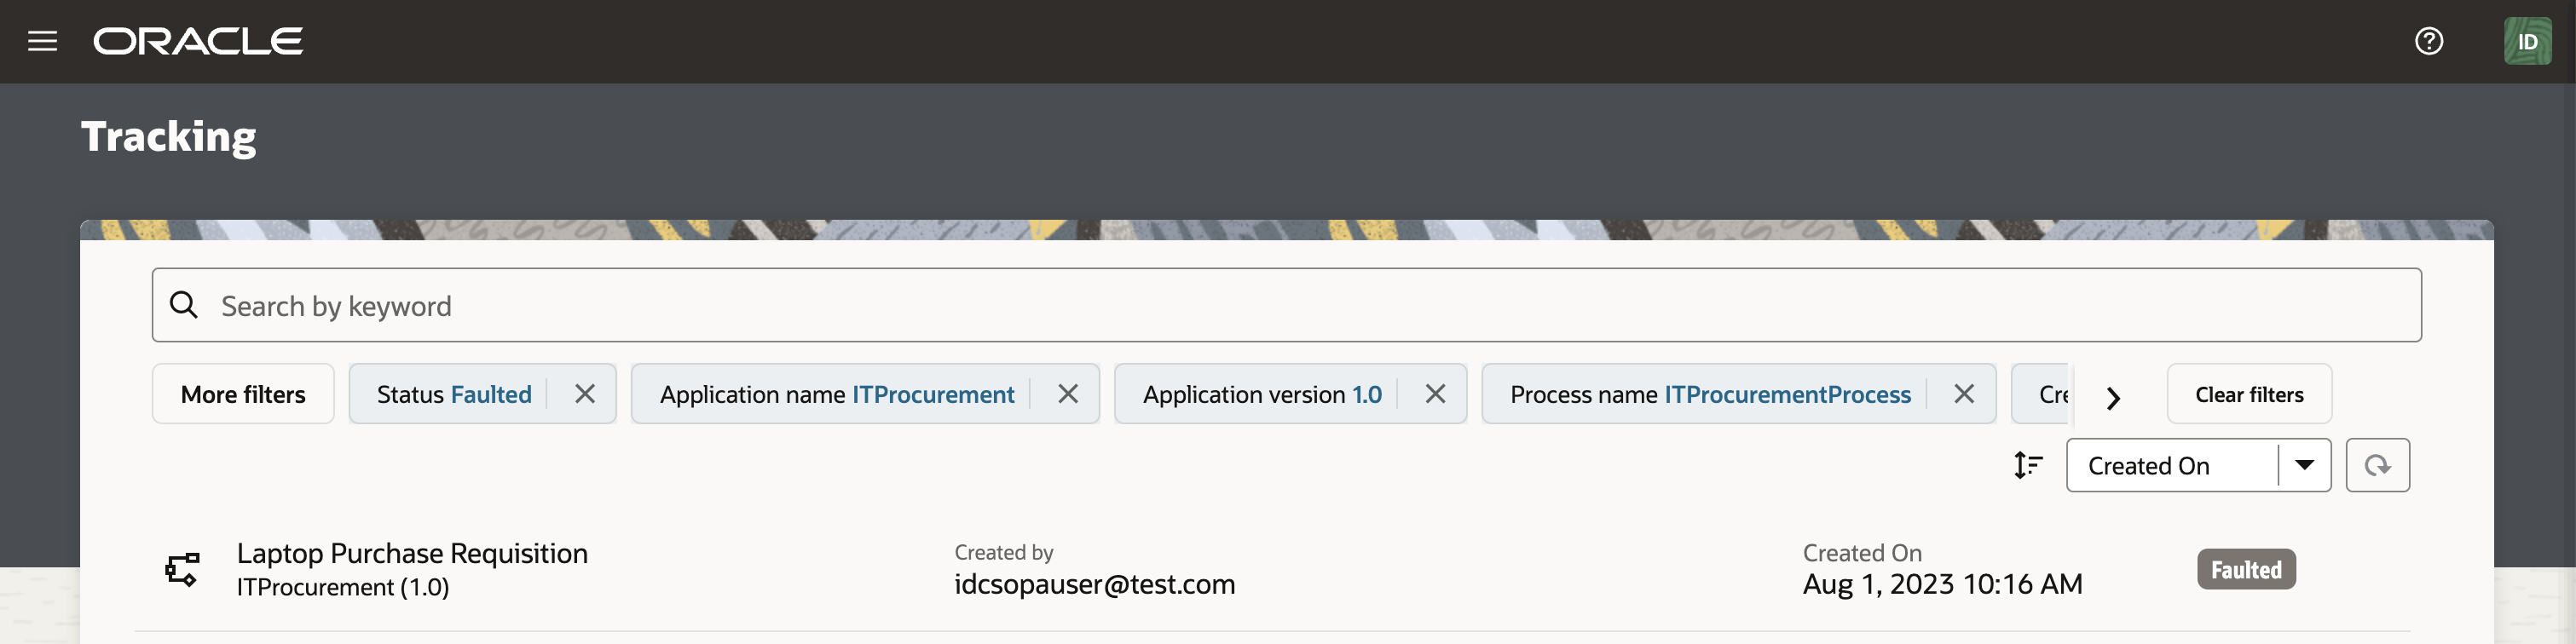
Contextual Drill-Down to Instance tracking (NEW in 23.08)
Viewing analytics data is great, but users often want to see the transaction data behind graphs and charts surfaced by analytics. To address this need, we have introduced the ability to navigate from OPA Analytics to instance tracking contextually. This important feature allows you to take the context of selected analytics filters and apply them to the tracking screen to support drill-down views into individual transactions. We support two interaction patterns here:
- You can take the context of the applied criteria visible in the OCI Process Automation header (period, application, and process) and push it to the tracking page upon selecting the view instances link. This link is available at every level of OPA Analytics, allowing you to navigate from the overview-specific, application-specific, or process-specific pages with the proper context:
- We also support selection by status of any of the visualizations. When this occurs, we take the context of the intended application/process and status and apply it to instance tracking UI:
- The net result of this is that a new browser tab opens that shows you the transactions that match the context you carried from Analytics:
Summary
Analytics is now available in all OCI Process Automation instances deployed in commercial regions (OC1), and we highly encourage you to check it out and share your feedback with us!It provides insight into process demand, execution, and duration trends and enables you to monitor, understand, and optimize processes like never before. As always, please check out our documentation for more information.