Protecting Database Performance using DBRM + Dynamic Scaling
Every database runs in a range of CPU consumption from low to high and CPU consumption typically changes constantly. The amount of CPU provisioned to a Virtual Machine determines how much CPU a database can use, but only if the VM runs a single database isolated from other databases, not consolidated together on a single system. Database consolidation means running 2 or more databases on a Virtual Machine (or bare metal server), which allows those databases to share resources like CPU. Oracle Database Resource Manager (DBRM) brings control over resources (preventing what is called the “Noisy Neighbor” problem), while still taking advantage of the cost savings of consolidation. This article covers the interplay between DBRM and Dynamic Scaling of CPU in Exadata Cloud, showing how to protect database performance from the impact of Noisy Neighbors.
DBRM Settings for CPU (Instance Caging)
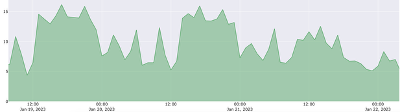
Oracle Database Resource Manager (DBRM) is used to set a limit on CPU consumption for a database using what’s known as Instance Caging, allowing control over CPU when 2 or more databases are consolidated on a single system. While this article talks about a “system” for the sake of simplicity, the same approach applies to Real Application Clusters (RAC) databases. The CPU_COUNT parameter (measured in virtual CPU or vCPU), is enforced when DBRM is enabled by setting a Resource Manager plan for the database. CPU_COUNT should be set high enough to cover “normal” operation of each database on a system running 2 or more databases. CPU consumption above that level is what would be considered abnormal for a particular database and applications using that database. For example, the following database sees a peak of just under 16 vCPU during normal operation.
The peak CPU_COUNT setting (known as Instance Caging) should be monitored to ensure the database never reaches that peak. If a database does hit the peak, the situation needs to be investigated to determine whether the peak limit (CPU_COUNT) needs to be increased, or if the situation is “abnormal” and fixes are required to address it. For example, an errant SQL statement, dropped index, new application code, or influx of new users might cause a database to consume more CPU than expected. In order to ensure a database stays within the expected range of CPU consumption, the approach to take for each database is this:
- Monitor to determine peak CPU consumption
- Enable DBRM and set CPU_COUNT (limit) for each instance
- Monitor for DBRM CPU Throttling or exceeding an established CPU threshold
- Increase or decrease CPU_COUNT when needed
What’s Normal?
What is “normal” for a database? That is a point of discussion between Database Administrators, application teams, and business owners. Evaluating whether CPU consumption is “normal” or not requires knowledge of the application and business process the application supports. Business processes might fluctuate by time of day, day of week, day of month, or even month of the year and businesses experience growth as well. If a database is isolated by itself inside a dedicated Virtual Machine, the size of that VM (and amount of CPU) would be the limiting factor. When databases are consolidated together, the CPU_COUNT setting in Oracle plays the same role as VM shape/size does for isolated databases, but it’s dynamic and easily changeable.
CPU Consumption Thresholds
In some cases, CPU_COUNT for a database might be too high and possibly needs to be lowered. For example, if the database never reaches approximately 60% of the limit, the limit (CPU_COUNT) might be too high. Decreases in CPU_COUNT limits should be evaluated on a longer time scale such as yearly, based on regular fluctuations in consumption for the database (driven by the application running on that database).
On the other hand, it’s often desirable to set an upper threshold to ensure a database never experiences throttling under normal conditions. For example, if a database exceeds 80% of its intended peak but doesn’t hit 100% (and doesn’t experience CPU throttling), the CPU_COUNT should be increased as long as that database is operating normally.
Monitoring can be done several ways, such as by querying v$con_sysmetric_history and related views looking at CPU Usage per Second metrics. Monitoring can also be done by evaluating DB CPU Seconds Per Second in AWR reports, AWR history, Oracle Enterprise Manager and other monitoring tools.
CPU Throttling
When a database hits the configured Database Resource Manager (DBRM) Instance caging (CPU_COUNT) limit, the database will encounter CPU throttling. CPU throttling by Resource Manager is shown as waiting for a quantity of CPU time which will be shown as “resmgr:cpu quantum” waits. This wait event is displayed in performance monitoring tools such as Oracle Enterprise Manager, the Oracle Cloud Control Plane, and in AWR reports. DBRM is throttling the database when this occurs, which means performance of that database is being impacted in favor of other databases on the system.
If any database hits the configured CPU_COUNT limit and encounters CPU throttling, investigation should be conducted to determine if the limit should be revised. The database might be hitting the limit due to new application code changes, growth in processing volumes, or an application defect. The good news is that other databases aren’t being impacted and CPU_COUNT for the affected database can be increased dynamically. Of course there are cases where a database is expected to reach the configured limit based on application behavior or business decisions made regarding costs. Each case is unique, but Oracle can handle them all.
Sum of CPU Peaks (Isolation or Partitioning)
CPU consumption plots for the following 3 databases show that peaks occur at different times. One approach is to compute the sum of peaks (for ALL databases on a system) and size the system large enough to handle that sum. However, the system will be much larger than needed because these peaks don’t occur at the same time. We typically measure CPU consumption in terms of virtual CPU (vCPU), and CPU_COUNT in Oracle Database represents vCPU as well.
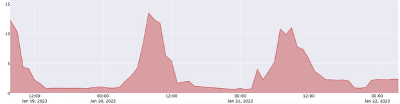
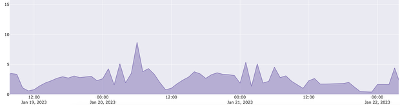
The sum of peaks for these 3 databases is 38 (16+14+8). If each database was placed on a dedicated server or Virtual Machine, the sum would be 38 vCPU. If these same 3 databases are consolidated onto a single server configured with 38 vCPU, the resources are said to be “partitioned” as long as the amount of vCPU available at the system level is higher than sum-of-peaks. It’s also possible to take advantage of the peaks and valleys of CPU consumption by consolidating these databases onto the same system.
Consolidating Databases
Database consolidation is when 2 or more databases run on a single server or cluster (whether bare metal or virtualized). Customers run tens or even hundreds of databases consolidated into a single Exadata system in Oracle Cloud. Consolidating databases reduces management effort and allows databases to share resources including CPU, system memory, I/O, and O/S processes. The most challenging resource to manage is CPU, and Oracle Database Resource Manager (DBRM) firmly addresses that challenge. DBRM Instance Caging (CPU_COUNT) will address unusual activity of a single database and prevent it from becoming a “nosy neighbor” by imposing a CPU limit, but doesn’t address shifts in the timing of activity (such as patterns of user behavior) as we shall see below.
Sum of Time-Aligned Peaks
When databases are consolidated together, they can reside in a system with less CPU configured because the peaks occur at different times. We refer to the result as the sum of time-aligned peaks. The example below shows the same 3 databases from above, but sharing CPU via consolidation.
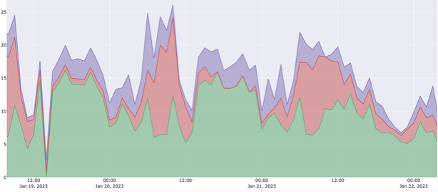
It is critically important to understand the fundamental difference between the sum of peaks versus the sum of time-aligned peaks. In the examples above, we showed 3 databases with peaks that occur at different times, so there is a dramatic difference between the sum of peaks and sum of time-aligned peaks. If these databases were each isolated onto dedicated Virtual Machines (or Bare Metal Servers), each database would have dedicated CPU assigned to each VM, so the overall CPU consumption is equal to the CPU allocated. In other words, the sum of peaks. However, if those databases were consolidated onto a single VM, the time WHEN those peaks occur determines the overall CPU consumption. This is what we call the sum of time-aligned peaks. Below is the effect on CPU consumption of isolation (sum of peaks) versus consolidation (sum of time-aligned peaks):
- Sum of Peaks = 16 + 14 + 8 = 38
- Sum of Time-Aligned Peaks = 26
If these databases are considered individually, the sum of peak CPU consumption will be 38. However, if they can share those CPU resources, the sum of time-aligned peaks will be just 26. As long as those processing patterns stay consistent, the system doesn’t need more than 26 vCPU. Processing patterns are driven by user activity or automated (batch) processing jobs and when those peaks occur. While this example shows 31% resource savings, database consolidation has been shown to reduce resource needs by as much as 6 times, resulting in much greater cost-efficiency. It’s possible to simply allocate CPU for each database and partition the system (that is, use a sum of peaks approach), but that will result in higher costs in a Cloud environment. The more cost-effective approach is to deploy with Dynamic Scaling.
Dynamic Scaling Protects Performance
We often think about Dynamic Scaling in terms of resource and cost savings, meaning hitting the valley of consumption to achieve lower hourly charges in Oracle Cloud. However, Dynamic Scaling also has a protective effect. Customers set CPU_COUNT for each database (using Instance Caging) to catch abnormal activity and ensure the database stays within its intended range of CPU consumption. Dynamic Scaling then allows the system to adapt when time-alignment drifts from what is normally expected, such as users becoming active at different times or batch jobs running on a different schedule than expected. While each database is configured to stay under its CPU_COUNT limit, the system as a whole can consume more than expected if CPU consumption patterns change. In other words, Instance Caging should be used to ensure each database stays within the “normal” range of CPU consumption, while Dynamic Scaling handles changes in the timing of when processing peaks occur.
Summary
Exadata Dynamic Scaling combined with Oracle Database Resource Manager (DBRM) reduces OCI costs but also protects databases against noisy neighbor problems. Exadata makes it easy to set appropriate CPU limits for each database, use a low OCPU/ECPU setting, then use Dynamic Scaling to protect performance.
References
Dynamic Scaling: https://docs.oracle.com/en/learn/dynamic_scaling_oeci/index.html#introduction
Instance Caging: https://docs.oracle.com/en/database/oracle/oracle-database/23/admin/managing-resources-with-oracle-database-resource-manager.html