Tell me if this sounds familiar.
You’re sitting at your desk, minding your own business, working feverishly away with a developer to write a fantastic piece of SQL for their latest application enhancement request – an absolutely killer piece of functionality – when your phone starts buzzing… and buzzing… and buzzing…
You come crashing out of zen mode, fearing the worst, a problem in production.
And it is. End users are reporting poor performance, KPIs are being missed, hair is being pulled out, customers are frustrated and no one knows what’s going on. Is it the application, the network, the database, or the gravitational pull of the sun? Someone helpfully points in your direction and states the issue is due to some background process that they read somewhere on a random blog which results in lots of I/O. Maybe it’s that!!!! It MUST be that!!!
Nope – that’s not it…
Alright, this is a little dramatic, but I suspect we’ve all been there at one time or another. Performance is suffering, and you need to triage and resolve the problem. Or you need a provable defense that the problem exists elsewhere in the environment? My point is that customers regularly ask me and the other PMs what tools are available to help triage and resolve issues.
I’m glad you asked! Oracle Database and Exadata emit vast amounts of performance wait events and metrics – and we provide many tools to collect and analyze this information, including Automatic Workload Repository (AWR) Reports, Enterprise Manager, Exawatcher, and Exadata Management Server (MS) alerts. The Exadata documentation covers each of the tools and information sources at your disposal so I won’t go over these in detail here Generally, these are excellent at helping to identify and resolve issues after the fact. For example, Why was my SQL running slow? Was there a rebalance taking place?
But what tools can I use to identify problems in real-time? How can I see what’s going on in the DB and Storage Servers this very second?
It turns out, I neglected to mention one tool in the list above… Exadata Real-Time Insight.
As the name suggests, Real-Time Insight gives Exadata admins real-time monitoring of their systems. We introduced Real-Time Insight in 2022 in the Exadata System Software 22.1 release. It’s worth taking some time to read the blog post in full, but let me paraphrase some of the key points.
Exadata emits metrics that are typically viewed using the dbmcli or cellcli list metrichistory command. Exadata Real-Time Insight streams over 200 unique metrics directly from the Exadata Database and Storage Servers to a centralized time-series database, which is typically overlayed with dashboards for easy viewing.
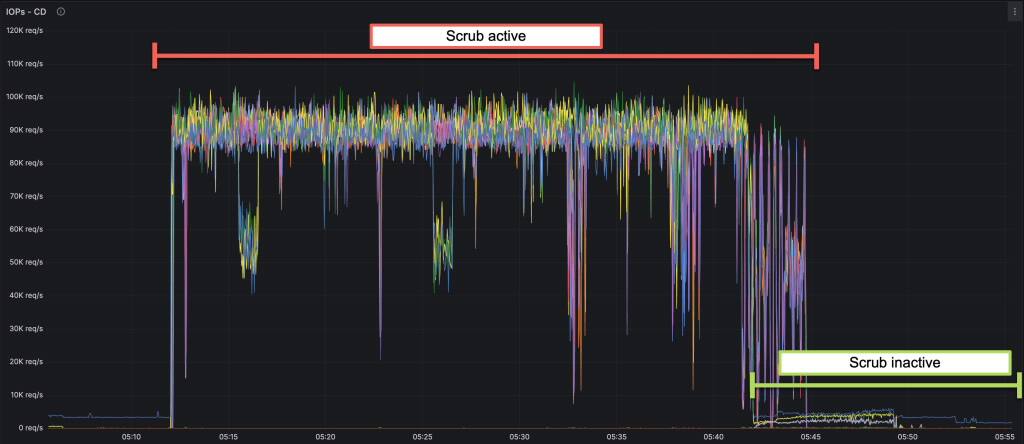
For example, in a recent post on Exadata Disk Scrubbing, I used the following snippet from a dashboard to illustrate that the Scrub process automatically backs off as the real database workload increases.
All this sounds great, but what do you need to do to start benefiting from Real-Time Insight?
I’m glad you asked – we designed Exadata Real-Time Insight to be useful to all organizations. In practice, that means that we support common time-series databases (e.g., Prometheus, InFlux) and dashboarding applications (e.g., Grafana). We also support Splunk, which can act as a data store and a dashboard application.
Architecture
Now that we’ve set the scene and decided to implement Real-Time Insight, we should summarize what we are about to build.
I’ve decided to use Prometheus and Grafana as my time-series database and graphing application, respectively. I’ll be putting both of these in a container, but you could, of course, install these on any server supported by these projects.
Prometheus recommends that data be pulled into it rather than being pushed (or streamed) from the Database and Storage Servers. The outcome is the same – real-time metric data that we can observe and act on.
Grafana is straightforward. It’s a graphing engine that queries the Prometheus database and generates easily readable charts and graphs.
Finally, our Exadata Database and Storage Servers need to be configured to enable metric streaming.
Putting that in a simple graphic, we can see our Exadata servers on the left, with Prometheus pulling metrics into itself and Grafana providing the graphical front end.

Ok, enough beating around the bush. Let’s get Prometheus and Grafana installed and configured. I’ll use Podman to install and configure both Prometheus and Grafana. The Containerfiles, configuration files, dashboards, etc., are all available in the Real-Time Insight directory in the Oracle GitHub repo.
1. Do not use the Exadata database servers to host your Prometheus and Grafana environments. Sure, Podman is available, but if the DB server is under high load and you’re trying to work out what it’s doing, you don’t want the additional noise your containers may add, or worse, not be able to access the metrics you’ve been collecting!
2. Exadata Real-Time Insight is available for use on Exadata Cloud Service (ExaDB-D) and Exadata Cloud@Customer (ExaCC) however, only the VM Guests can be monitored in such deployments.
Exadata Database and Storage Servers
Much of the configuration for Real-Time Insight is provided out-of-the-box. We ship Exadata System Software with a selection of metrics already configured for “fine-grained” collection. Of the 82 defined metrics in the database servers, 48 of them are already defined as fine-grained. On the storage servers, 192 of the 902 metrics are defined as fine-grained right from the get-go! Fine-grained collection refers to the per-second collection of a particular metric and is what makes Real-Time Insight real-time.
So, how do you find and understand which metrics have been enabled by default? Let’s start by looking at the definition of a metric using cellcli to ‘describe metricdefinition’.
CellCLI> describe metricdefinition
    name                                 Unique name of the metric definition
    description                          Description of the metric
    fineGrained            modifiable    Specifies if the metric is enabled for fine-grained collection
    metricType                           Indicates how the statistic was created or defined, either 'cumulative', 'instantaneous', 'rate', or 'transition'
    objectType                           Type of object being measured, such as 'CELL', 'GRIDDISK', 'FLASHCACHE', and so on
    retentionPolicy        modifiable    Amount of time metric values are stored
    streaming              modifiable    Specifies if the metric is enabled for streaming to a collection endpoint
    unit                                 Unit for the metric explicitly, and is related to the metric collected
Each metric has a name, a description, a type, the object it relates to, a unit of measurement, and a retention policy. They also have two fields that pertain to Real-Time Insight – ‘fineGrained’ and ‘streaming’.
Regardless of the upstream database, FineGrained controls if the metric is collected on a per-second basis. Streaming is useful if you are using Splunk or tools that prefer data to be pushed to them rather than pulled. We won’t cover the streaming or push use case in this post but the documentation shows how to configure this.
Now we understand how metrics are defined, lets have a look at a few.
In this example, we use dbmcli to see the CPU utilization per second of the database server.
DBMCLI> list metrichistory DS_CPUT
     DS_CPUT     exapm01dbadm01     3.7 %     2024-03-12T23:00:10-07:00
     DS_CPUT     exapm01dbadm01     3.4 %     2024-03-12T23:01:10-07:00
     DS_CPUT     exapm01dbadm01     3.3 %     2024-03-12T23:02:10-07:00
     DS_CPUT     exapm01dbadm01     3.4 %     2024-03-12T23:03:10-07:00
     DS_CPUT     exapm01dbadm01     3.4 %     2024-03-12T23:04:10-07:00
     DS_CPUT     exapm01dbadm01     3.3 %     2024-03-12T23:05:10-07:00
     DS_CPUT     exapm01dbadm01     3.5 %     2024-03-12T23:06:10-07:00
     DS_CPUT     exapm01dbadm01     3.3 %     2024-03-12T23:07:10-07:00
     DS_CPUT     exapm01dbadm01     3.3 %     2024-03-12T23:08:10-07:00
     DS_CPUT     exapm01dbadm01     3.4 %     2024-03-12T23:09:10-07:00
     DS_CPUT     exapm01dbadm01     3.3 %     2024-03-12T23:10:10-07:00
     DS_CPUT     exapm01dbadm01     3.5 %     2024-03-12T23:11:10-07:00
     DS_CPUT     exapm01dbadm01     3.4 %     2024-03-12T23:12:10-07:00
In this example, the metric collects DB Server CPU Utilization per second.
CellCLI> list metricdefinition DS_CPUT detail
     name:                   DS_CPUT
     description:            "Percentage of time over the previous minute that the system CPUs were not idle."
     fineGrained:            Enabled
     metricType:             Instantaneous
     objectType:             CELL
     retentionPolicy:        Default
     streaming:              Enabled
     unit:                   %
Let’s look at another, this time from a Storage Server.
list metricdefinition FC_IO_BY_R_DW_SEC detail
     name:                   FC_IO_BY_R_DW_SEC
     description:            "Number of megabytes of large reads (DW) per second from flash cache"
     fineGrained:            Enabled
     metricType:             Rate
     objectType:             FLASHCACHE
     retentionPolicy:        Default
     streaming:              Enabled
     unit:                   MB/sec
Looking at the metrichistory for this metric, we might see the following – any guesses as to what this metric relates to?
CellCLI> list metrichistory FC_IO_BY_R_DW_SEC
     FC_IO_BY_R_DW_SEC     FLASHCACHE     0.008 MB/sec     2024-03-12T22:59:37-07:00
     FC_IO_BY_R_DW_SEC     FLASHCACHE     0.013 MB/sec     2024-03-12T23:00:37-07:00
     FC_IO_BY_R_DW_SEC     FLASHCACHE     0 MB/sec         2024-03-12T23:01:37-07:00
     FC_IO_BY_R_DW_SEC     FLASHCACHE     0.013 MB/sec     2024-03-12T23:02:37-07:00
     FC_IO_BY_R_DW_SEC     FLASHCACHE     0.017 MB/sec     2024-03-12T23:03:37-07:00
     FC_IO_BY_R_DW_SEC     FLASHCACHE     0.025 MB/sec     2024-03-12T23:04:37-07:00
     FC_IO_BY_R_DW_SEC     FLASHCACHE     0 MB/sec         2024-03-12T23:05:37-07:00
     FC_IO_BY_R_DW_SEC     FLASHCACHE     0 MB/sec         2024-03-12T23:06:37-07:00
     FC_IO_BY_R_DW_SEC     FLASHCACHE     0.004 MB/sec     2024-03-12T23:07:37-07:00
     FC_IO_BY_R_DW_SEC     FLASHCACHE     0.004 MB/sec     2024-03-12T23:08:37-07:00
     FC_IO_BY_R_DW_SEC     FLASHCACHE     0.008 MB/sec     2024-03-12T23:09:37-07:00
     FC_IO_BY_R_DW_SEC     FLASHCACHE     0 MB/sec         2024-03-12T23:10:37-07:00
     FC_IO_BY_R_DW_SEC     FLASHCACHE     0.008 MB/sec     2024-03-12T23:11:37-07:00
     FC_IO_BY_R_DW_SEC     FLASHCACHE     0.004 MB/sec     2024-03-12T23:12:37-07:00
     FC_IO_BY_R_DW_SEC     FLASHCACHE     0.004 MB/sec     2024-03-12T23:13:37-07:00
Take note of a given metric’s metricType. I’ve used two ‘instantaneous’ metrics as examples, but there are other types of metrics you may find interesting. Knowing what kind of metric you are collecting and viewing helps you build the most appropriate chart.
If you want to enable a metric in either the database or storage server, you simply need to use dbmcli or cellcli, respectively, and execute ‘alter metricdefinition <metric name> finegrained=enabled’. Disabling a metric is just as simple. But the point I want to reiterate is that we enable a selection of really useful metrics, so you don’t have to. You just need to start collecting them and looking at pretty graphs to interpret them.
The final step on the database and storage servers is to create a user on each of the database and storage servers for Prometheus to connect to.
Use the following script in DBMCLI on Database Servers (including VMs) or CELLCLI on Storage Servers to create a user with the appropriate privileges to consume the metrics..
CREATE ROLE realtime_collector
GRANT PRIVILEGE LIST ON METRICSTREAM ALL ATTRIBUTES WITH ALL OPTIONS TO ROLE realtime_collector
CREATE USER realtime_collector PASSWORD="Sup3rS3cr3tP@ssword" ### Don't forget to change this password
GRANT ROLE realtime_collector to user realtime_collector
You can use the dcli utility to automate the creation of these users across multiple servers. I have included examples of this in the GitHub repo.
Finally, before we move on to the next step, let’s check that the metrics are now visible for collection using the REST interface. Using this URL pattern, https://exadata_server_hostname/metricstream/list?stream=true and the username and password defined in the previous step, you should see the output in your browser similar to the following:
CD_IO_BY_R_LG{objectName="FD_00_exapm01celdm01",unit="MB",server="exapm01celdm01.domain.com",fleet="prod",pod="exapm01",rackName="exapm01",rackID="f0d36120-4a4e-390c-8e1f-c894ed331afb",siteName="RWS",siteID="5e72d887-835e-3628-aefe-6749580ec4bb",nodeType="STORAGE"} 3173.8125 1643385465000
...
CD_IO_BY_R_LG{objectName="FD_01_exapm01celdm01",unit="MB",server="exapm01celdm01.domain.com",fleet="prod",pod="exapm01",rackName="exapm01",rackID="f0d36120-4a4e-390c-8e1f-c894ed331afb",siteName="RWS",siteID="5e72d887-835e-3628-aefe-6749580ec4bb",nodeType="STORAGE"} 3060.4375 1643385465000
This brings us to collecting metrics with Prometheus.
Prometheus
To begin with, we need a simple time-series database to stream our Exadata metrics to. Navigate to the change to the insight/container/prometheus directory and inspect the ‘Containerfile’. You should see the following very simple container build file.
FROM prom/prometheus
VOLUME ["/prometheusdata"]
ADD prometheus.yml /etc/prometheus/
ADD all_exadata_nodes.json /etc/prometheus/
Let’s step through each of these entries
FROM prom/prometheus
This is the name of the image we want to use. I’m assuming we want the latest version of Prometheus, but you may want to specify a version.
VOLUME ["/prometheusdata"]
Prometheus is a database, so we want to persist the data somewhere so it is available between reboots.
ADD prometheus.yml /etc/prometheus/
This line copies the prometheus.yml file into the image’s /etc/prometheus directory. You can inspect the whole file from the GitHub repo, but the scrape_configs section is
scrape_configs:
  # The job name is added as a label `job=<job_name>` to any timeseries scraped from this config.
  - job_name: 'exadata'

    metrics_path: metricstream/list

    scheme: https

    params:
      stream: [true]

    basic_auth:
      username: realtime_collector
      password: Sup3rS3cr3tP@ssword ## Change this to your secure password

    file_sd_configs:
    - files:
      - 'all_exadata_nodes.json'

    tls_config:
      insecure_skip_verify: true

    # Drop cumulative metrics from the stream
    metric_relabel_configs:
    - source_labels: [__name__]
      regex: '(CD_IO_BY_R_LG|CD_IO_BY_R_SM|CD_IO_BY_W_LG|CD_IO_BY_W_SM|CD_IO_RQ_R_LG|CD_IO_RQ_R_SM|CD_IO_RQ_W_LG|CD_IO_RQ_W_SM|CD_IO_TM_R_SM|CD_IO_TM_R_LG|CD_IO_TM_W_SM|CD_IO_TM_W_LG)'
      action: drop
    - source_labels: [__name__]
      regex: '(FC_COL_IO_BY_R|FC_COL_IO_BY_R_ELIGIBLE|FC_COL_IO_BY_SAVED|FC_COL_IO_RQ_W_POPULATE|FC_COL_IO_BY_W_POPULATE)'
      action: drop
    - source_labels: [__name__]
      regex: '(SIO_IO_EL_OF|SIO_IO_OF_RE|SIO_IO_PA_TH|SIO_IO_RV_OF|SIO_IO_RD_FC|SIO_IO_RD_HD|SIO_IO_RD_FC_HD|SIO_SIO_SI_SV)'
      action: drop
    - source_labels: [__name__]
      regex: '(FC_IO_BY_R|FC_IO_BY_R_DISK_WRITER|FC_IO_BY_R_DW|FC_IO_BY_R_MISS|FC_IO_BY_R_SKIP|FC_IO_RQ_R|FC_IO_RQ_R_DISK_WRITER|FC_IO_RQ_R_DW|FC_IO_RQ_R_MISS|FC_IO_RQ_R_MISS_DW|FC_IO_RQ_R_SKIP)'
      action: drop
    - source_labels: [__name__]
      regex: '(FC_IO_RQ_W_DISK_WRITER|FC_IO_RQ_W_METADATA|FC_IO_RQ_W_POPULATE|FC_IO_RQ_W_SKIP|FC_IO_BY_W|FC_IO_BY_W_DISK_WRITER|FC_IO_BY_W_METADATA|FC_IO_BY_W_POPULATE|FC_IO_BY_W_SKIP)'
      action: drop
    # Change disk and flash device metric names for readability
    - source_labels: [objectName]
      regex: '(^nvme.*)'
      replacement: 'flash:$1'
      target_label: objectName
      action:  replace
    - source_labels: [objectName]
      regex: '(^sd.*)'
      replacement: 'disk:$1'
      target_label: objectName
      action:  replace
And finally, in the prometheus.yml configuration, you will see a reference to all_exadata_nodes.json. This file is a register of all the database and storage servers you want Prometheus to pull metrics from. An example of the file format is included in the GitHub repo and looks like this. Note that the storage servers (cells) use port 443 by default, while the database servers use port 7879.
[
    {
      "labels": {
        "job": "exadata"
      },
      "targets": [
        "exadbadm01.domain.com:7879",
        "exadbadm02.domain.com:7879",
        "exadbceladm01.domain.com",
        "exadbceladm02.domain.com",
        "exadbceladm03.domain.com",
        "exadbadm01vm01.domain.com:7879",
        "exadbadm02vm01.domain.com:7879",
        "exadbadm01vm02.domain.com:7879",
        "exadbadm02vm02.domain.com:7879"
      ]
    }
  ]
As you can see, each database server (and VM) and storage server is listed along with the port that Real-Time Metrics are configured with.
Now that we have defined the container, we can build it and start it up.
$ podman build -t realtime_prometheus .
In my case, I’ve already downloaded the Prometheus image so your output may look different from mine.
STEP 1/4: FROM prom/prometheus
STEP 2/4: VOLUME ["/prometheusdata"]
--> Using cache 5331179832b36a2b945e8a411956b37f3dbb35401883e7e1addbd90049a2e3c9
--> 5331179832b3
STEP 3/4: ADD prometheus.yml /etc/prometheus/
--> Using cache 61200cba233a3c70da35400abf6edd084d775adf596615b3181ce7616bf7d48e
--> 61200cba233a
STEP 4/4: ADD all_exadata_nodes.json /etc/prometheus/
--> Using cache fad1303c6f25c93a5fd84cfd50f9bc621b13b4ef6edce5107e7da0724782ce1d
COMMIT realtime_prometheus2
--> fad1303c6f25
Successfully tagged localhost/realtime_prometheus:latest
fad1303c6f25c93a5fd84cfd50f9bc621b13b4ef6edce5107e7da0724782ce1d
Now we can start the container and map in the appropriate ports
$ podman run --name=realtime_prometheus -v prometheusdata:/prometheus -d -p 9090:9090 realtime_prometheus
To test if everything is working as expected, use a browser to connect to the container using the URL http://podman_server_hostname:9090, and you will see something like the below image.

If you query for ‘CD_IO_BY_R_LG_SEC’; you will see that metrics are being collected!
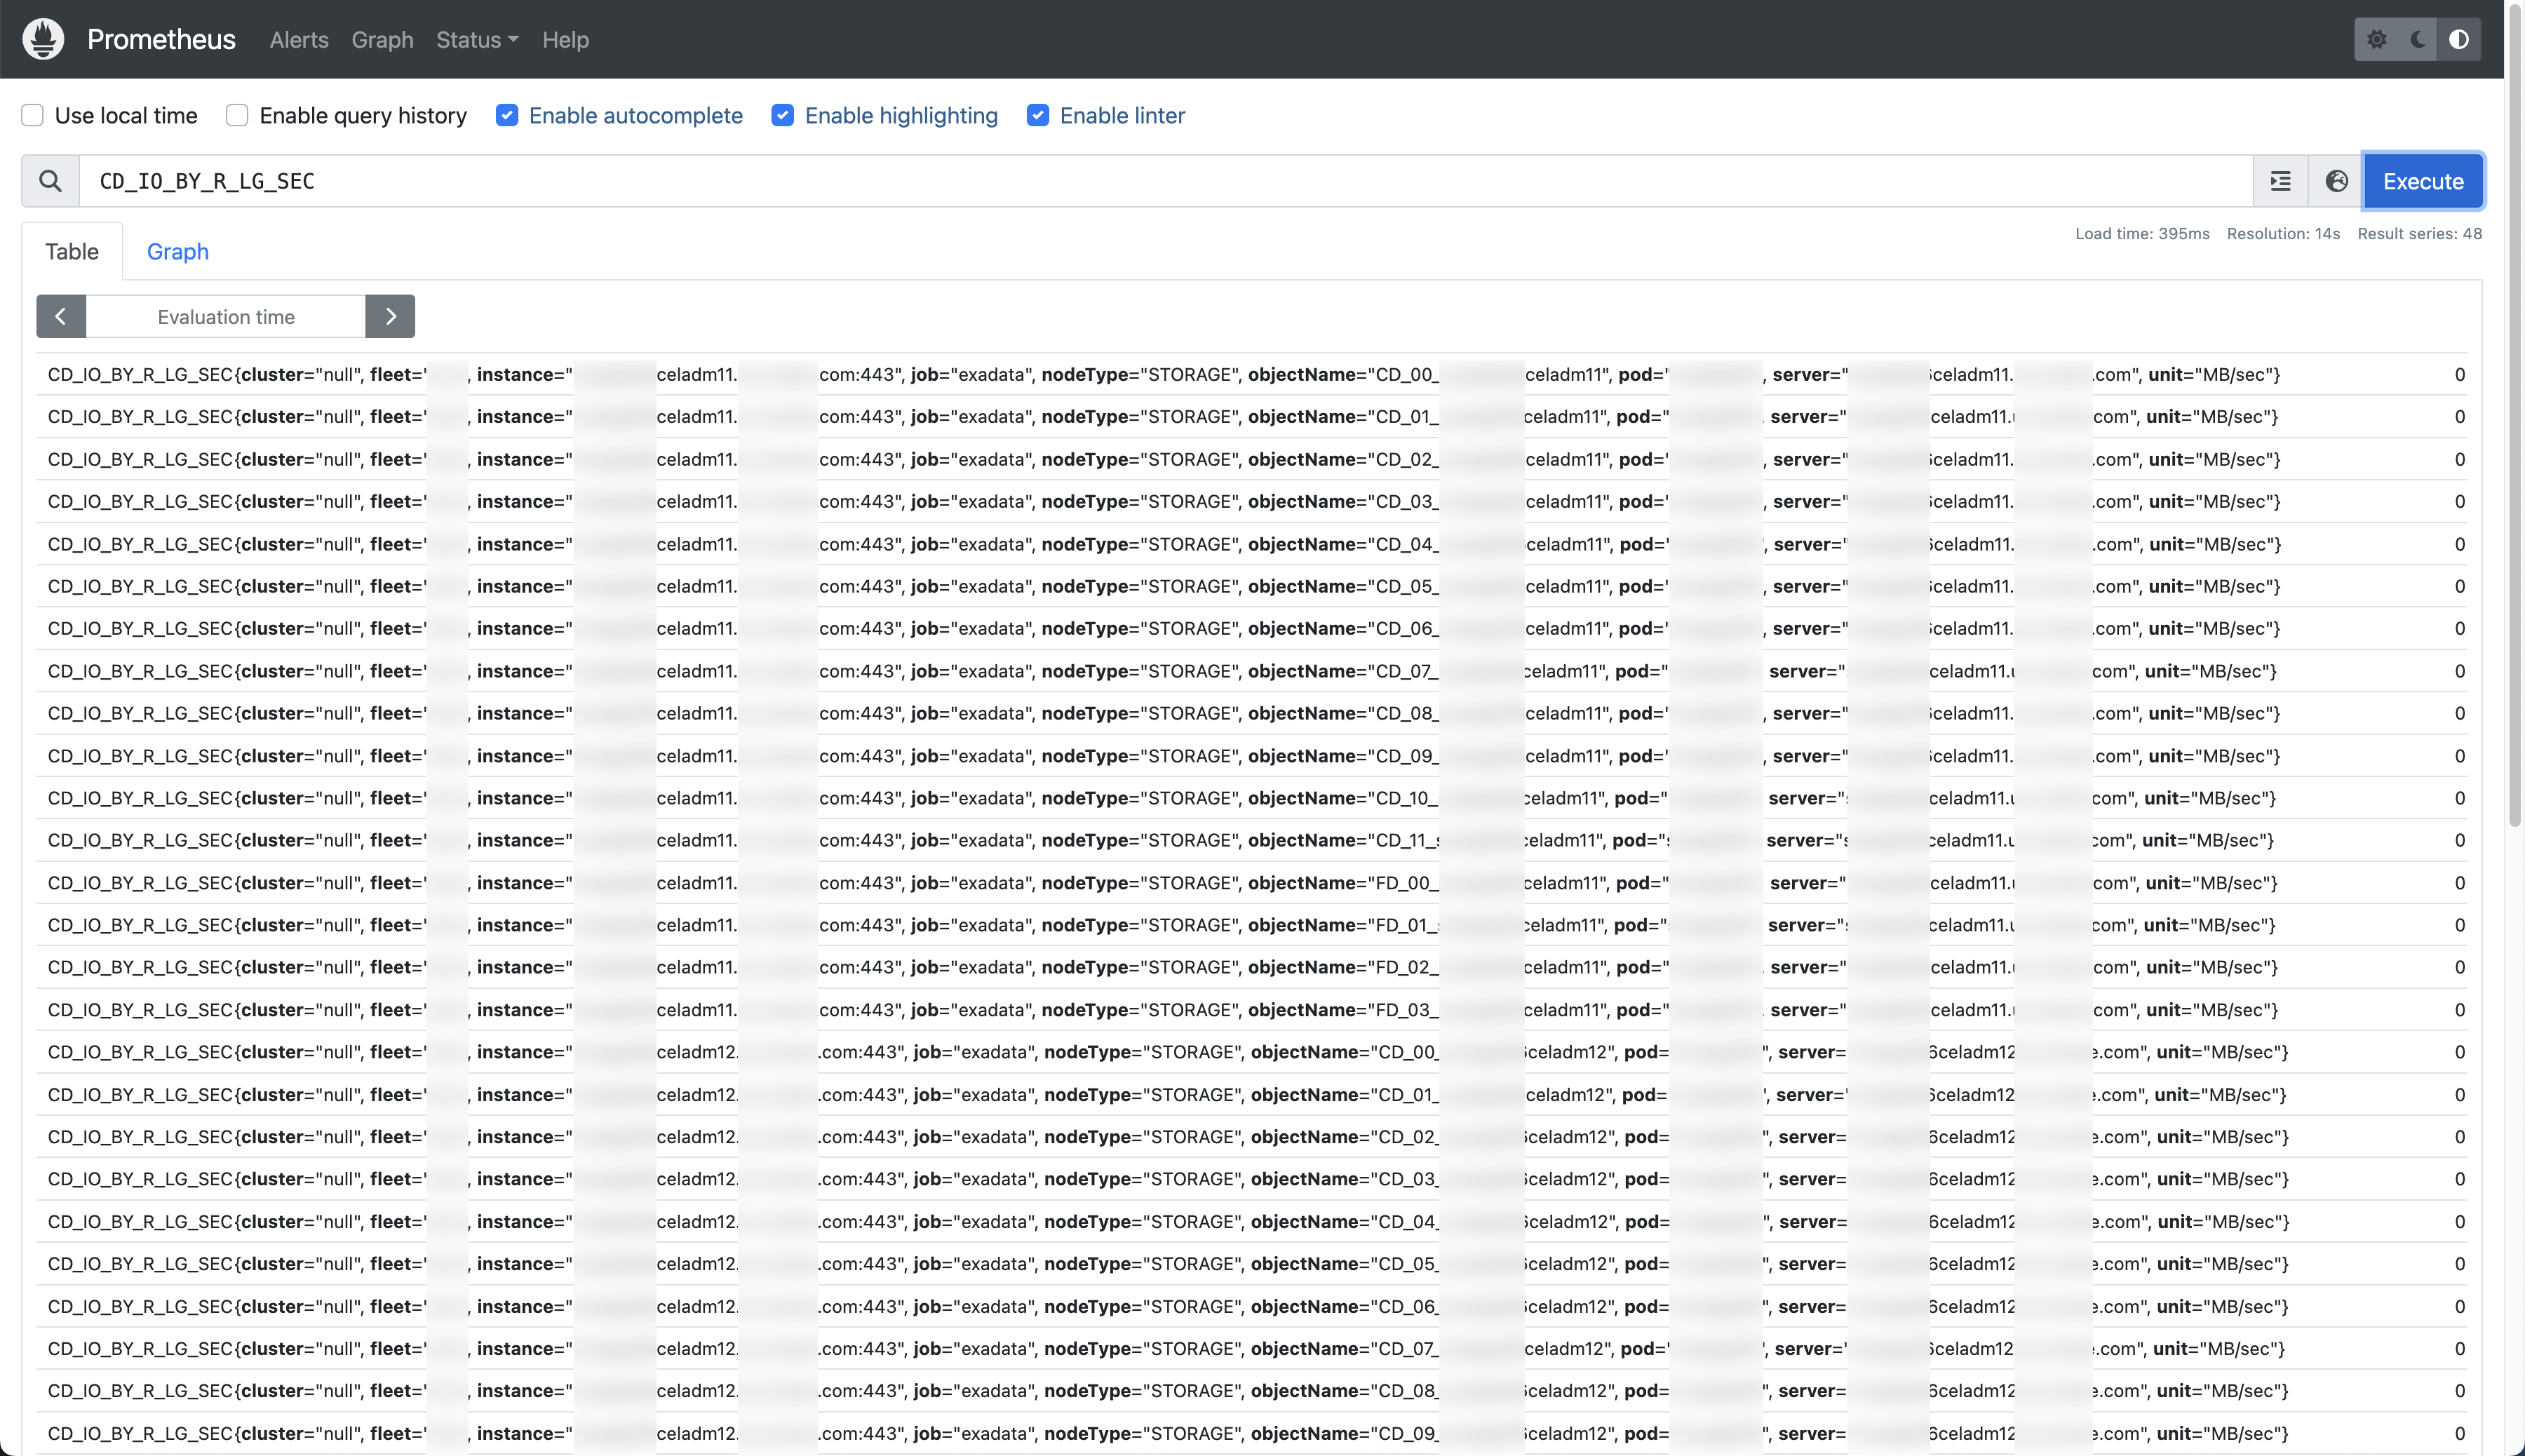
If everything so far has gone well, you should start seeing Exadata metrics being displayed in the console. Feel free to look around but we’ll move on and get Grafana set up so we can get some lovely charts displaying.
Grafana
Like Prometheus, we will get Grafana up and running in a container. So, let’s start by checking out the Containerfile file in the insight/container/grafana directory.
Again, we’re pulling down the latest container image for Grafana. In this case, I’m pulling the OSS release instead of the Enterprise Release.
FROM grafana/grafana-oss
And then we’re injecting some configuration into the container. Specifically, we’re adding a data source to connect Grafana to Prometheus.
ADD ./datasources/*.yaml /etc/grafana/provisioning/datasources
Before you build the container, make sure you update the URL in the exa-real-time-insight-ds.yaml file to point to your Prometheus container. You should also make sure the correct port is specified.
apiVersion: 1

datasources:
  - name: Prometheus
    type: prometheus
    access: proxy
    # Make sure you update the hostname below to that of the hostname your container is running on (and don't forget to remove the {{}}).
    url: http://podman_server_hostname:9090/
    jsonData:
      httpMethod: POST
      manageAlerts: true
      prometheusType: Prometheus
      prometheusVersion: 2.50.0
      cacheLevel: "High"
      disableRecordingRules: false
      incrementalQueryOverlapWindow: 10m
Finally, we will place the Oracle-provided dashboards from the Real-Time Insight repo into the container so they are automatically loaded.
ADD ./dashboards/*.yaml /etc/grafana/provisioning/dashboards
ADD ./dashboards/*.json /etc/grafana/provisioning/dashboards
Now we can build the image.
$ podman build -t realtime_grafana .
To start it we execute the following. Note that we are binding port 3000 on the local machine to port 3000 in the container.
$ podman run -d --name=realtime_grafana -p 3000:3000 realtime_grafana
At this point, we should be ready to check that Grafana is up and running, a data source has been defined, and we can add our supplied dashboards.
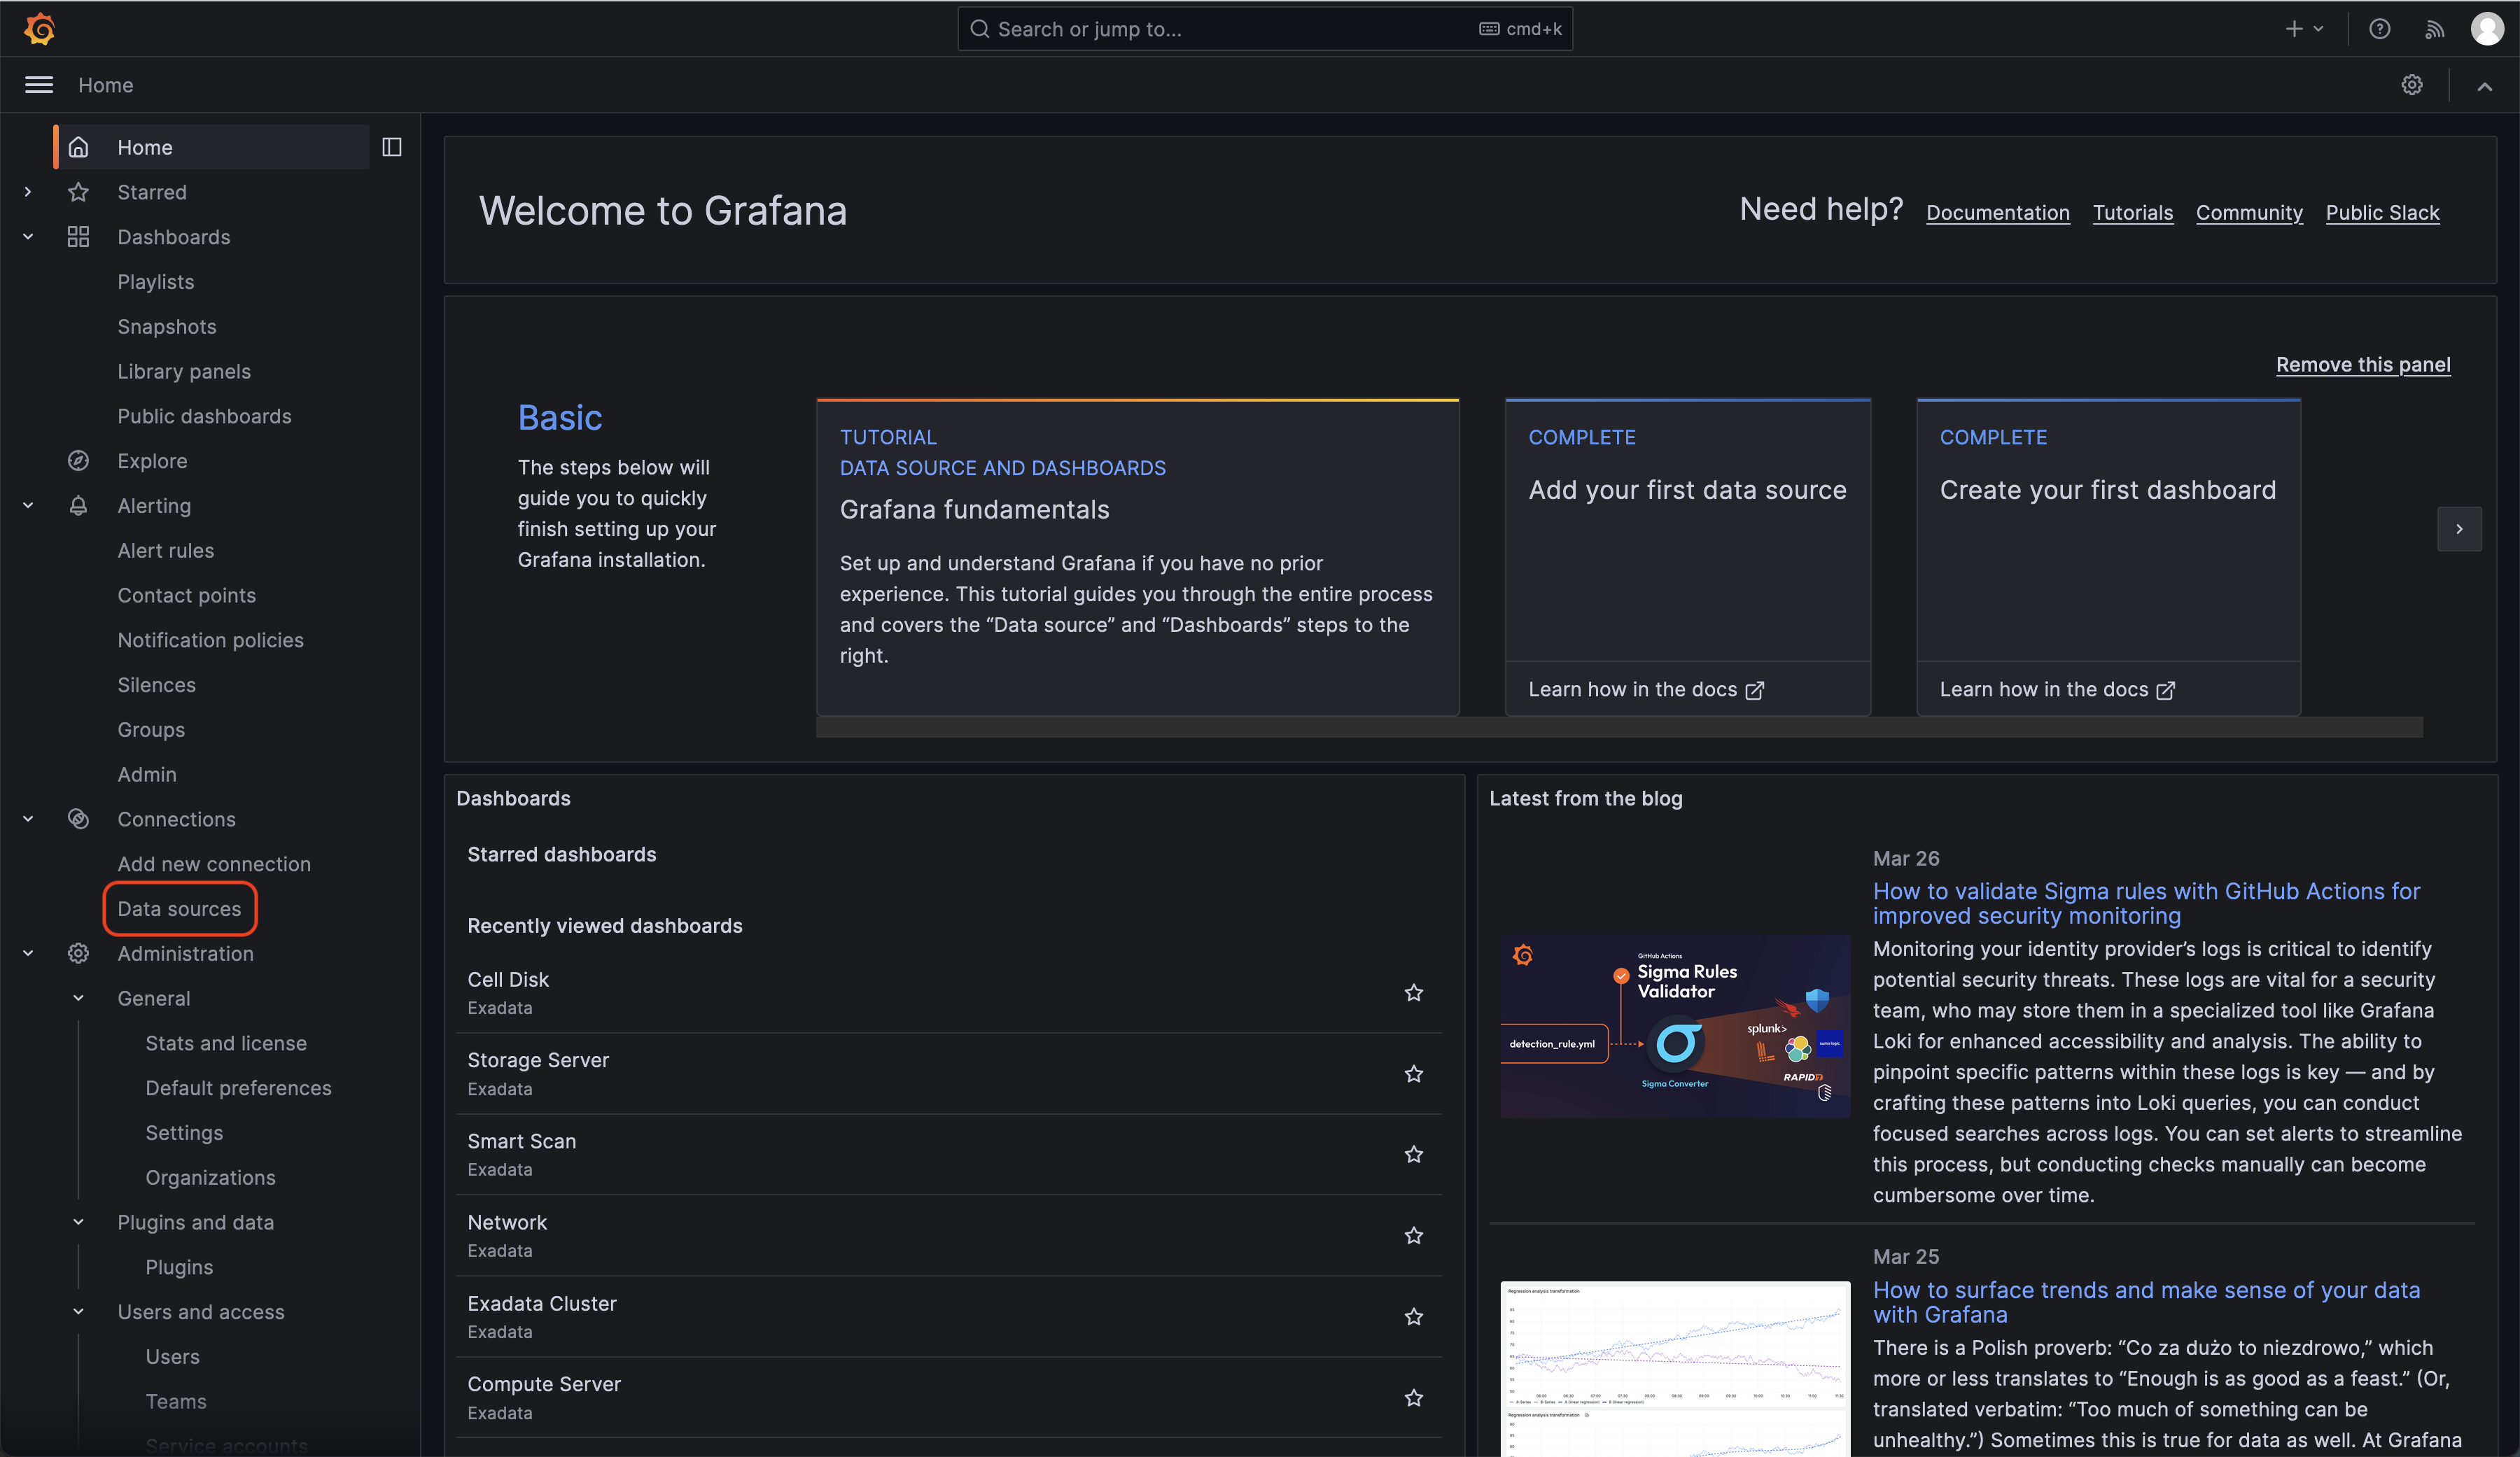
Using your favorite browser, navigate to http://podman_server_hostname:3000, and after you login (using the Grafana default username and password are admin/admin) you will see Grafana’s home page.

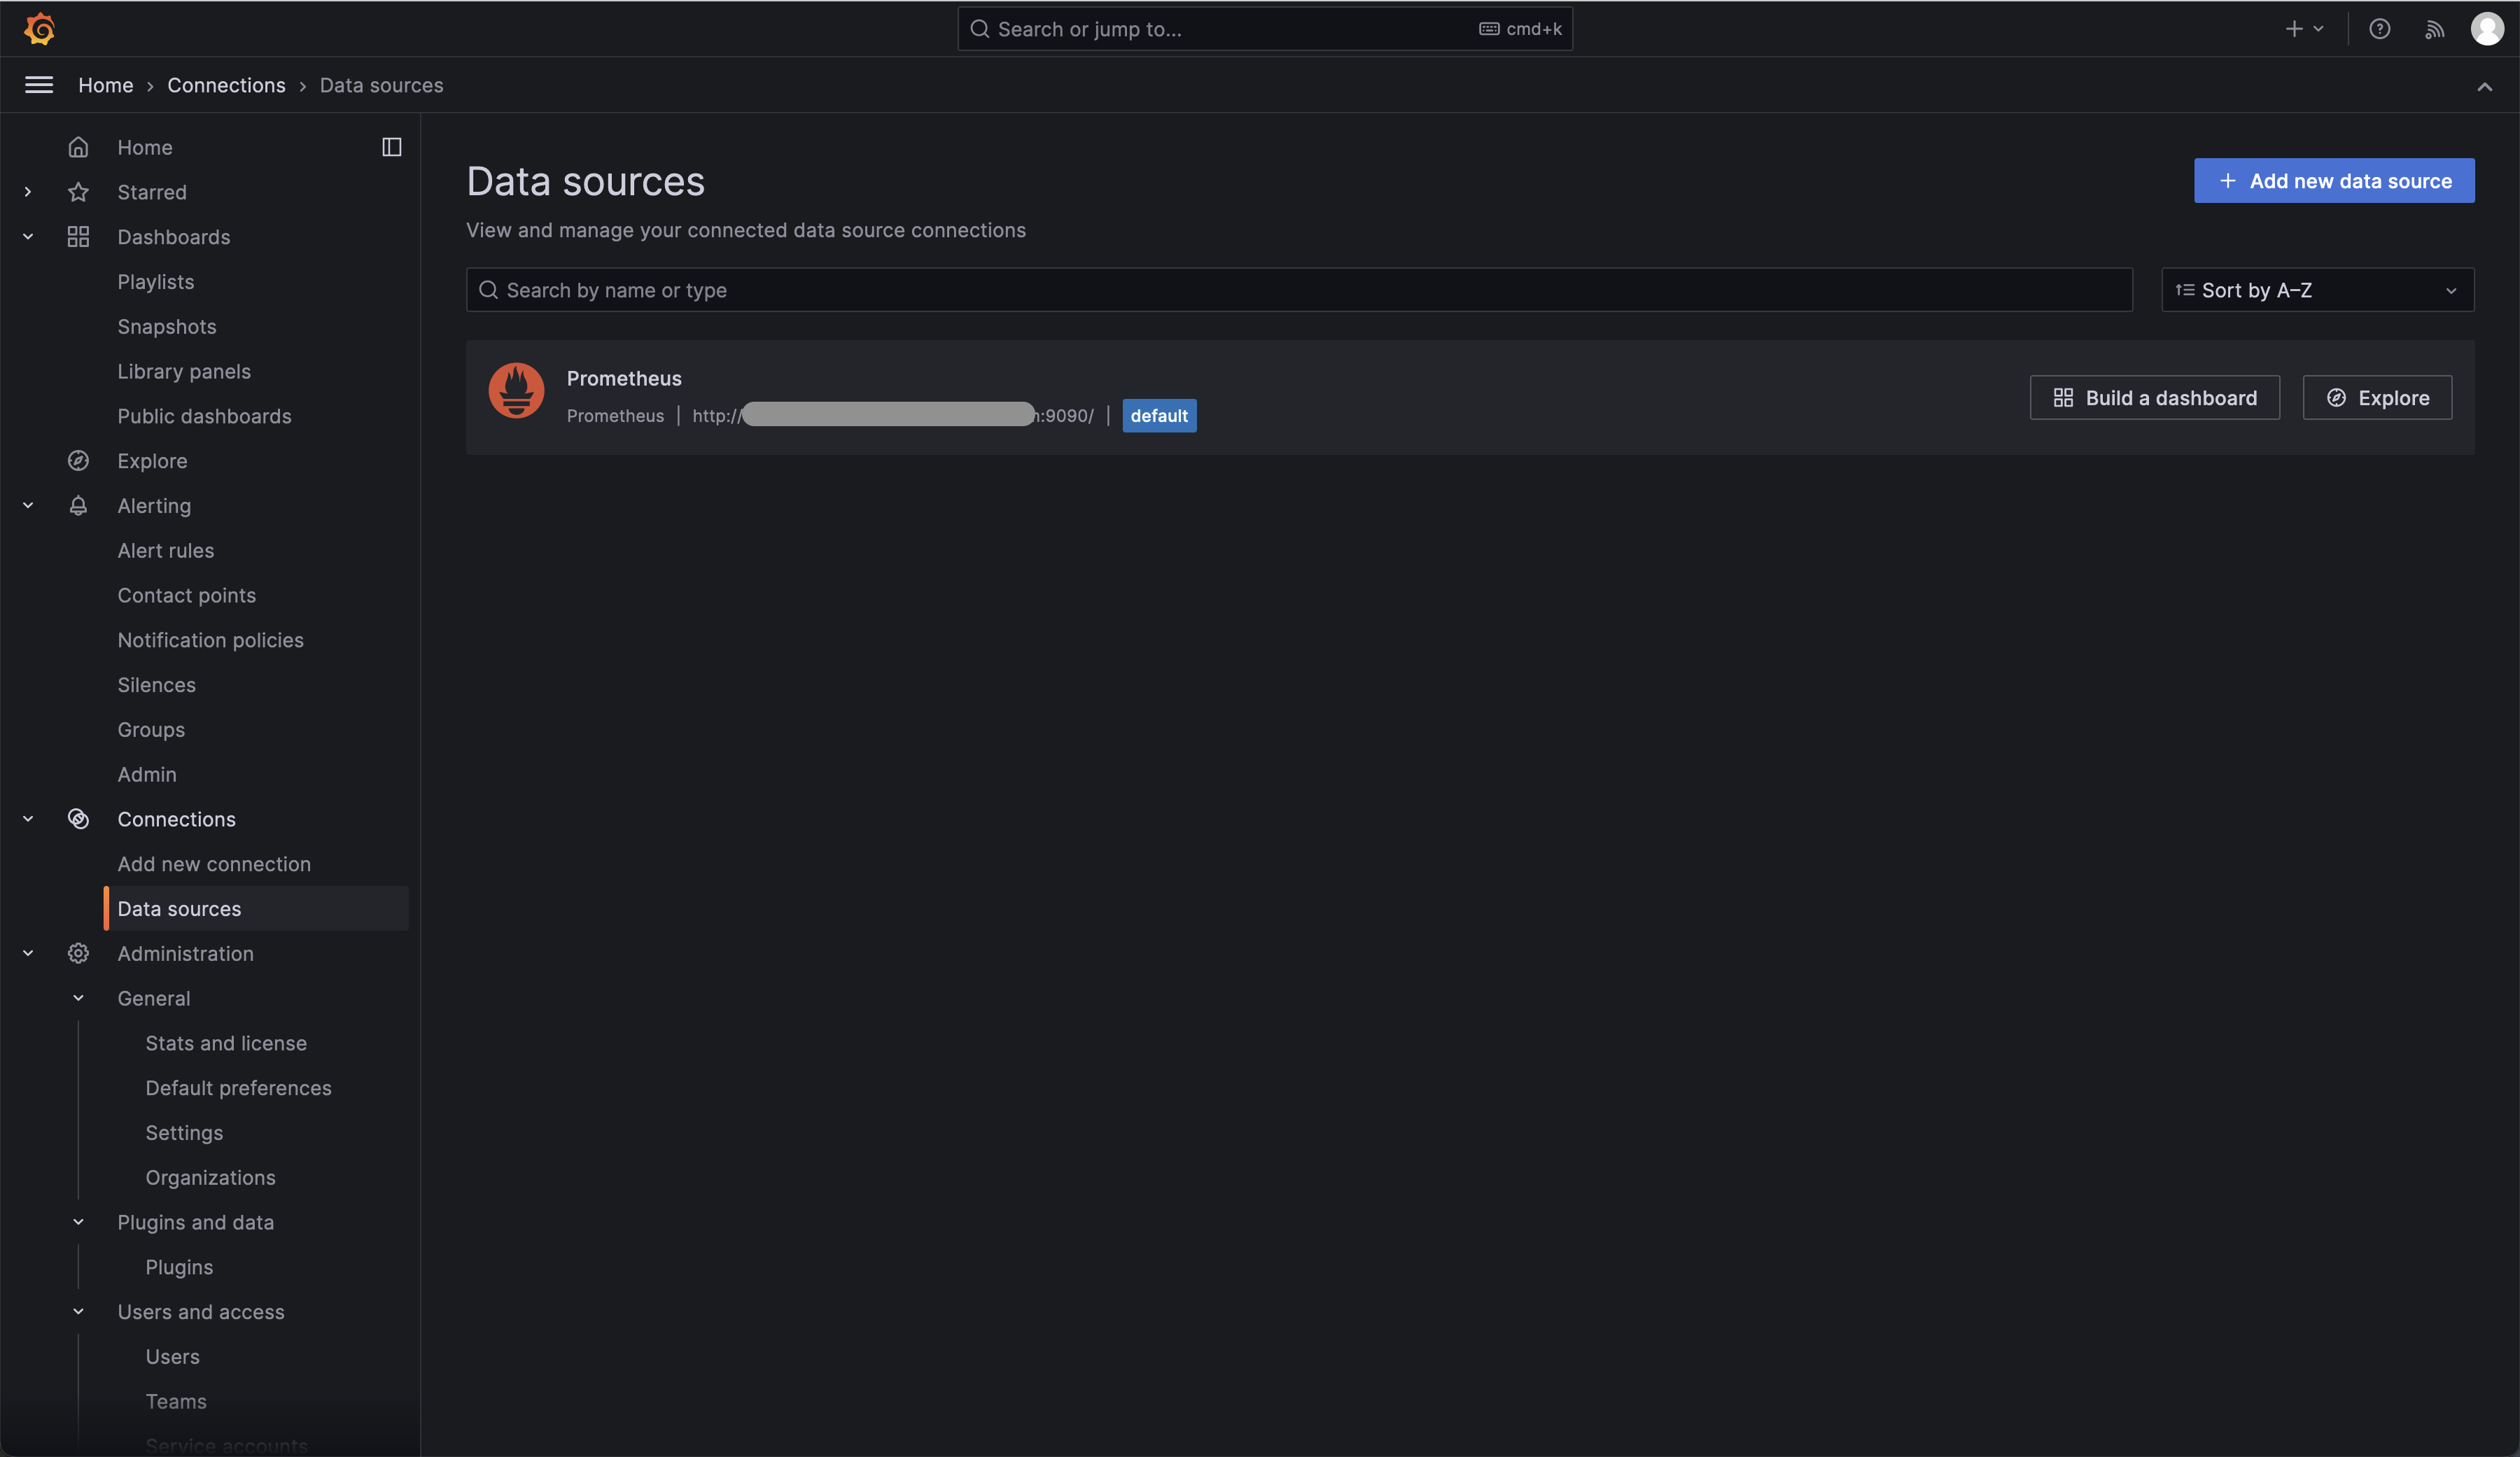
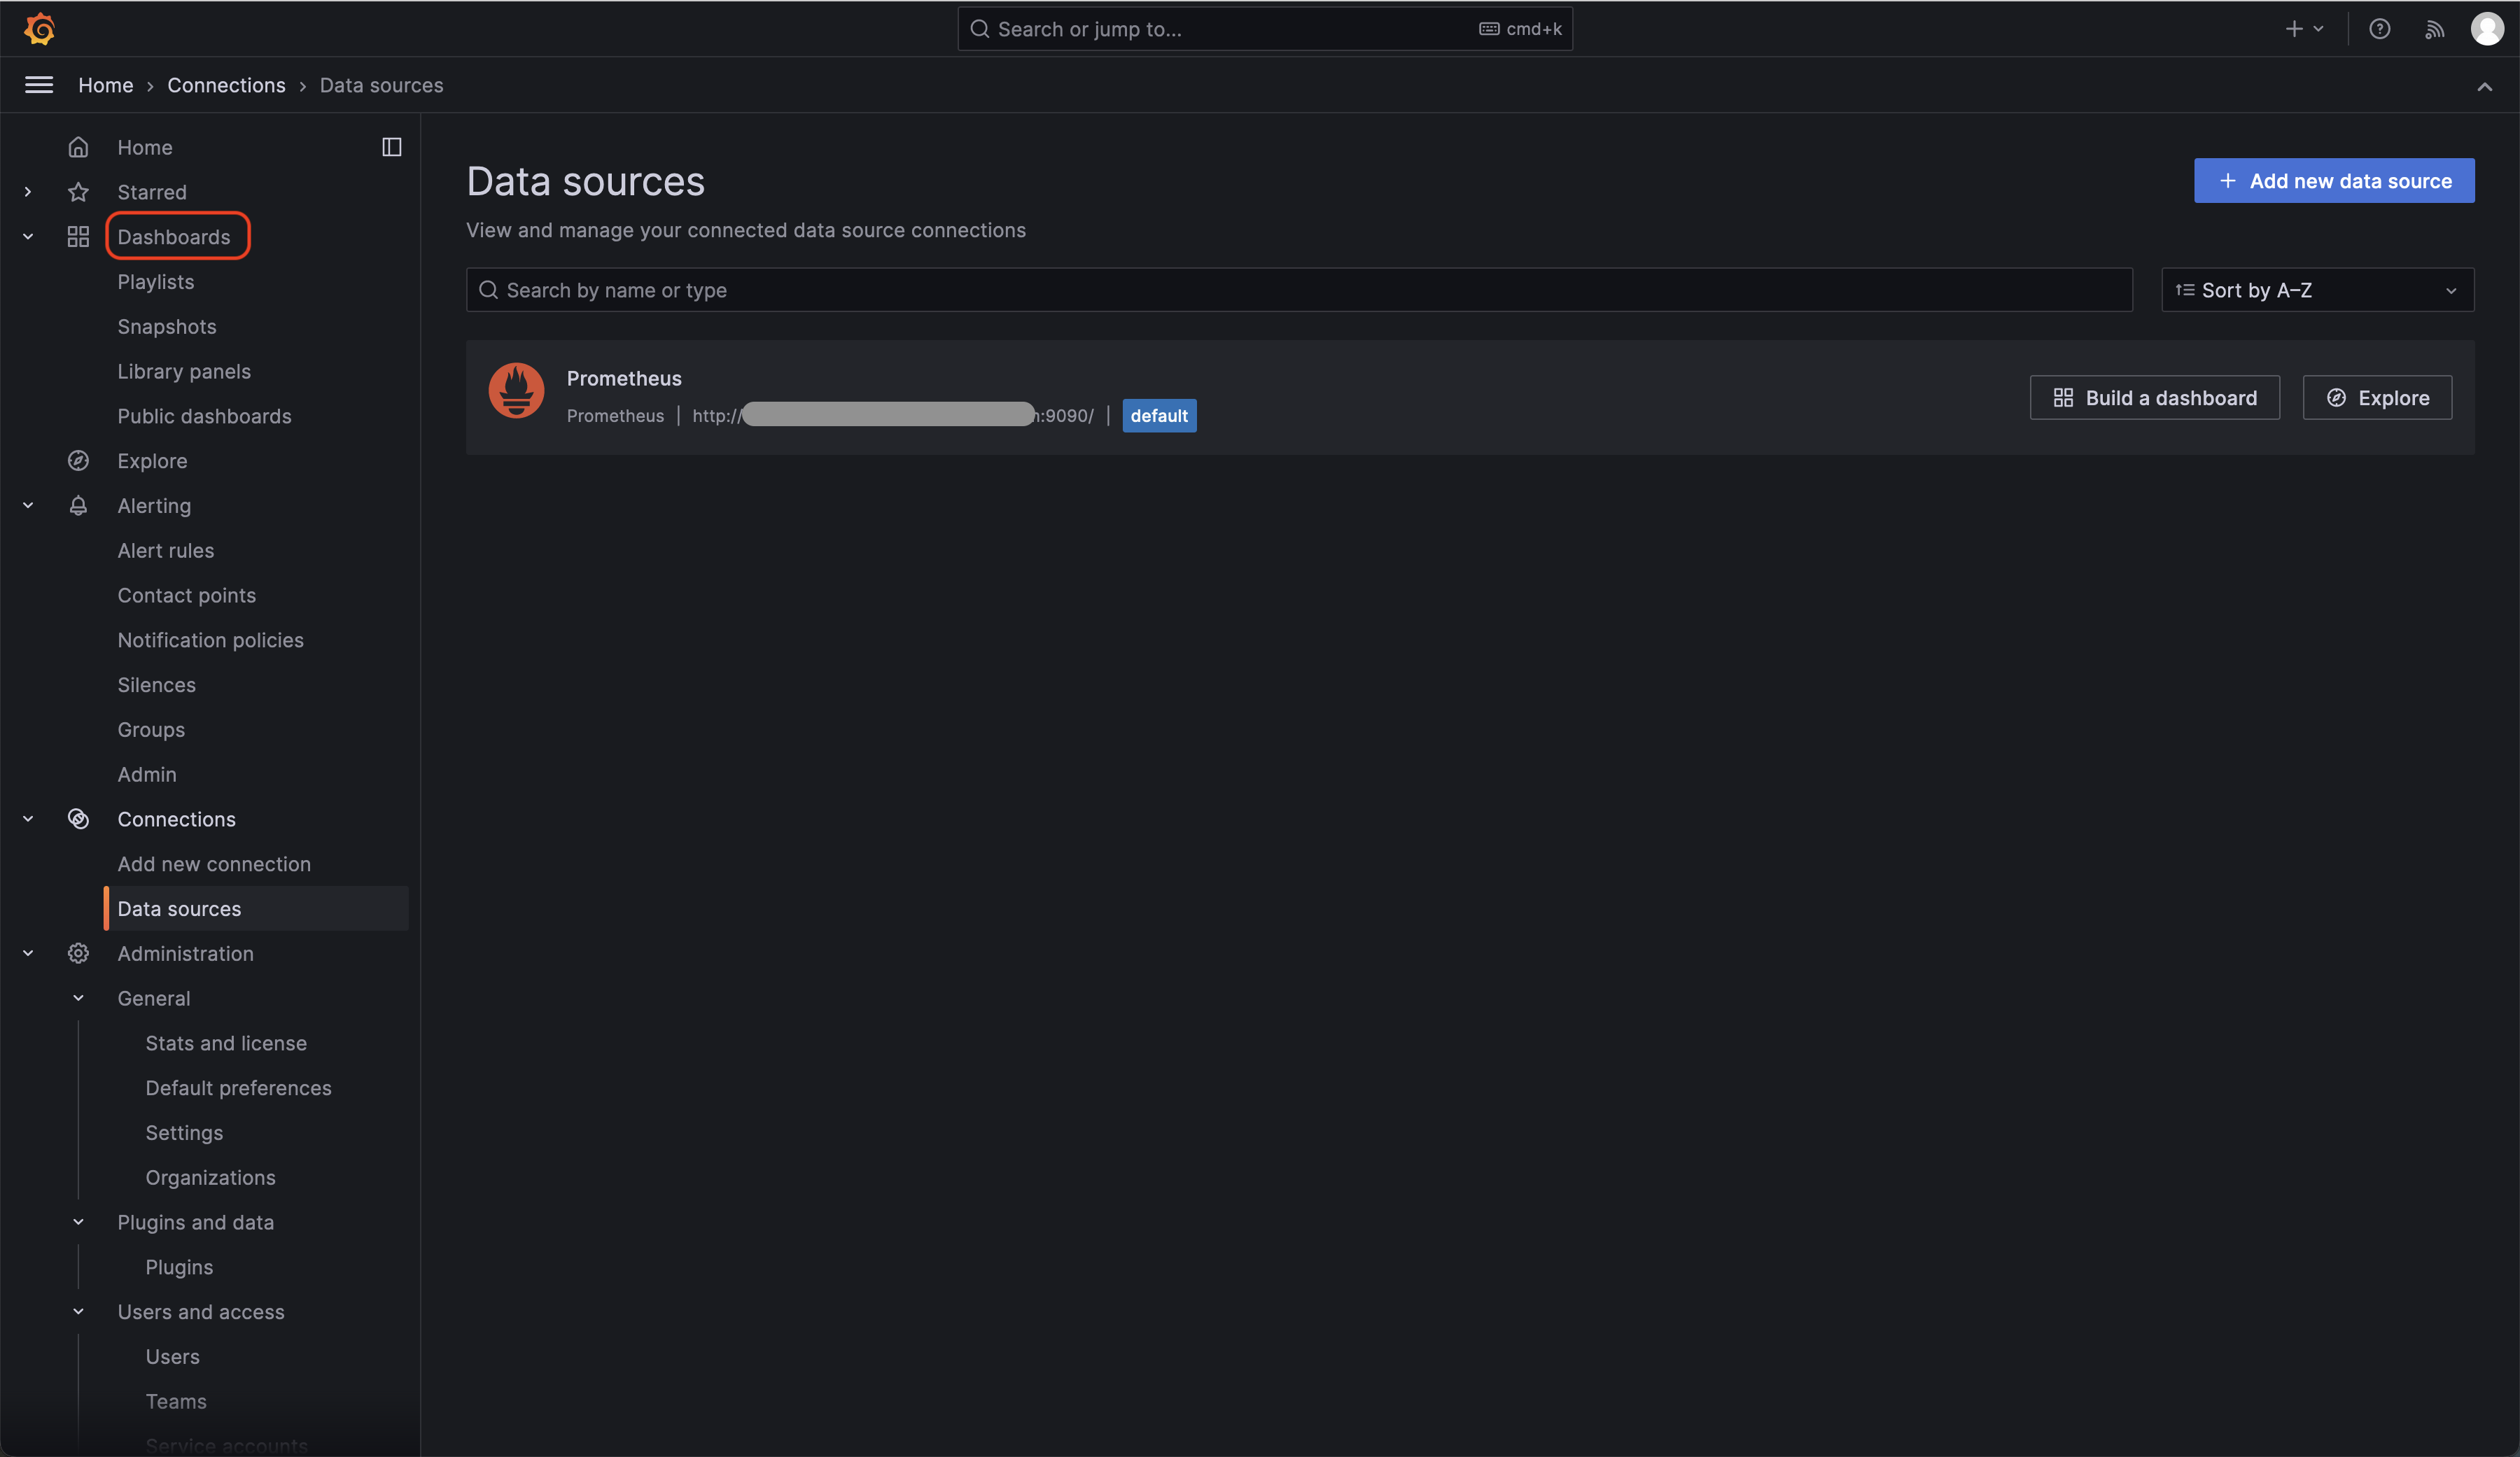
You should double-check that the data source has been created correctly by navigating to the “Data sources” on the left-hand menu.
Which will take you to this page – I’ve redacted the hostname.
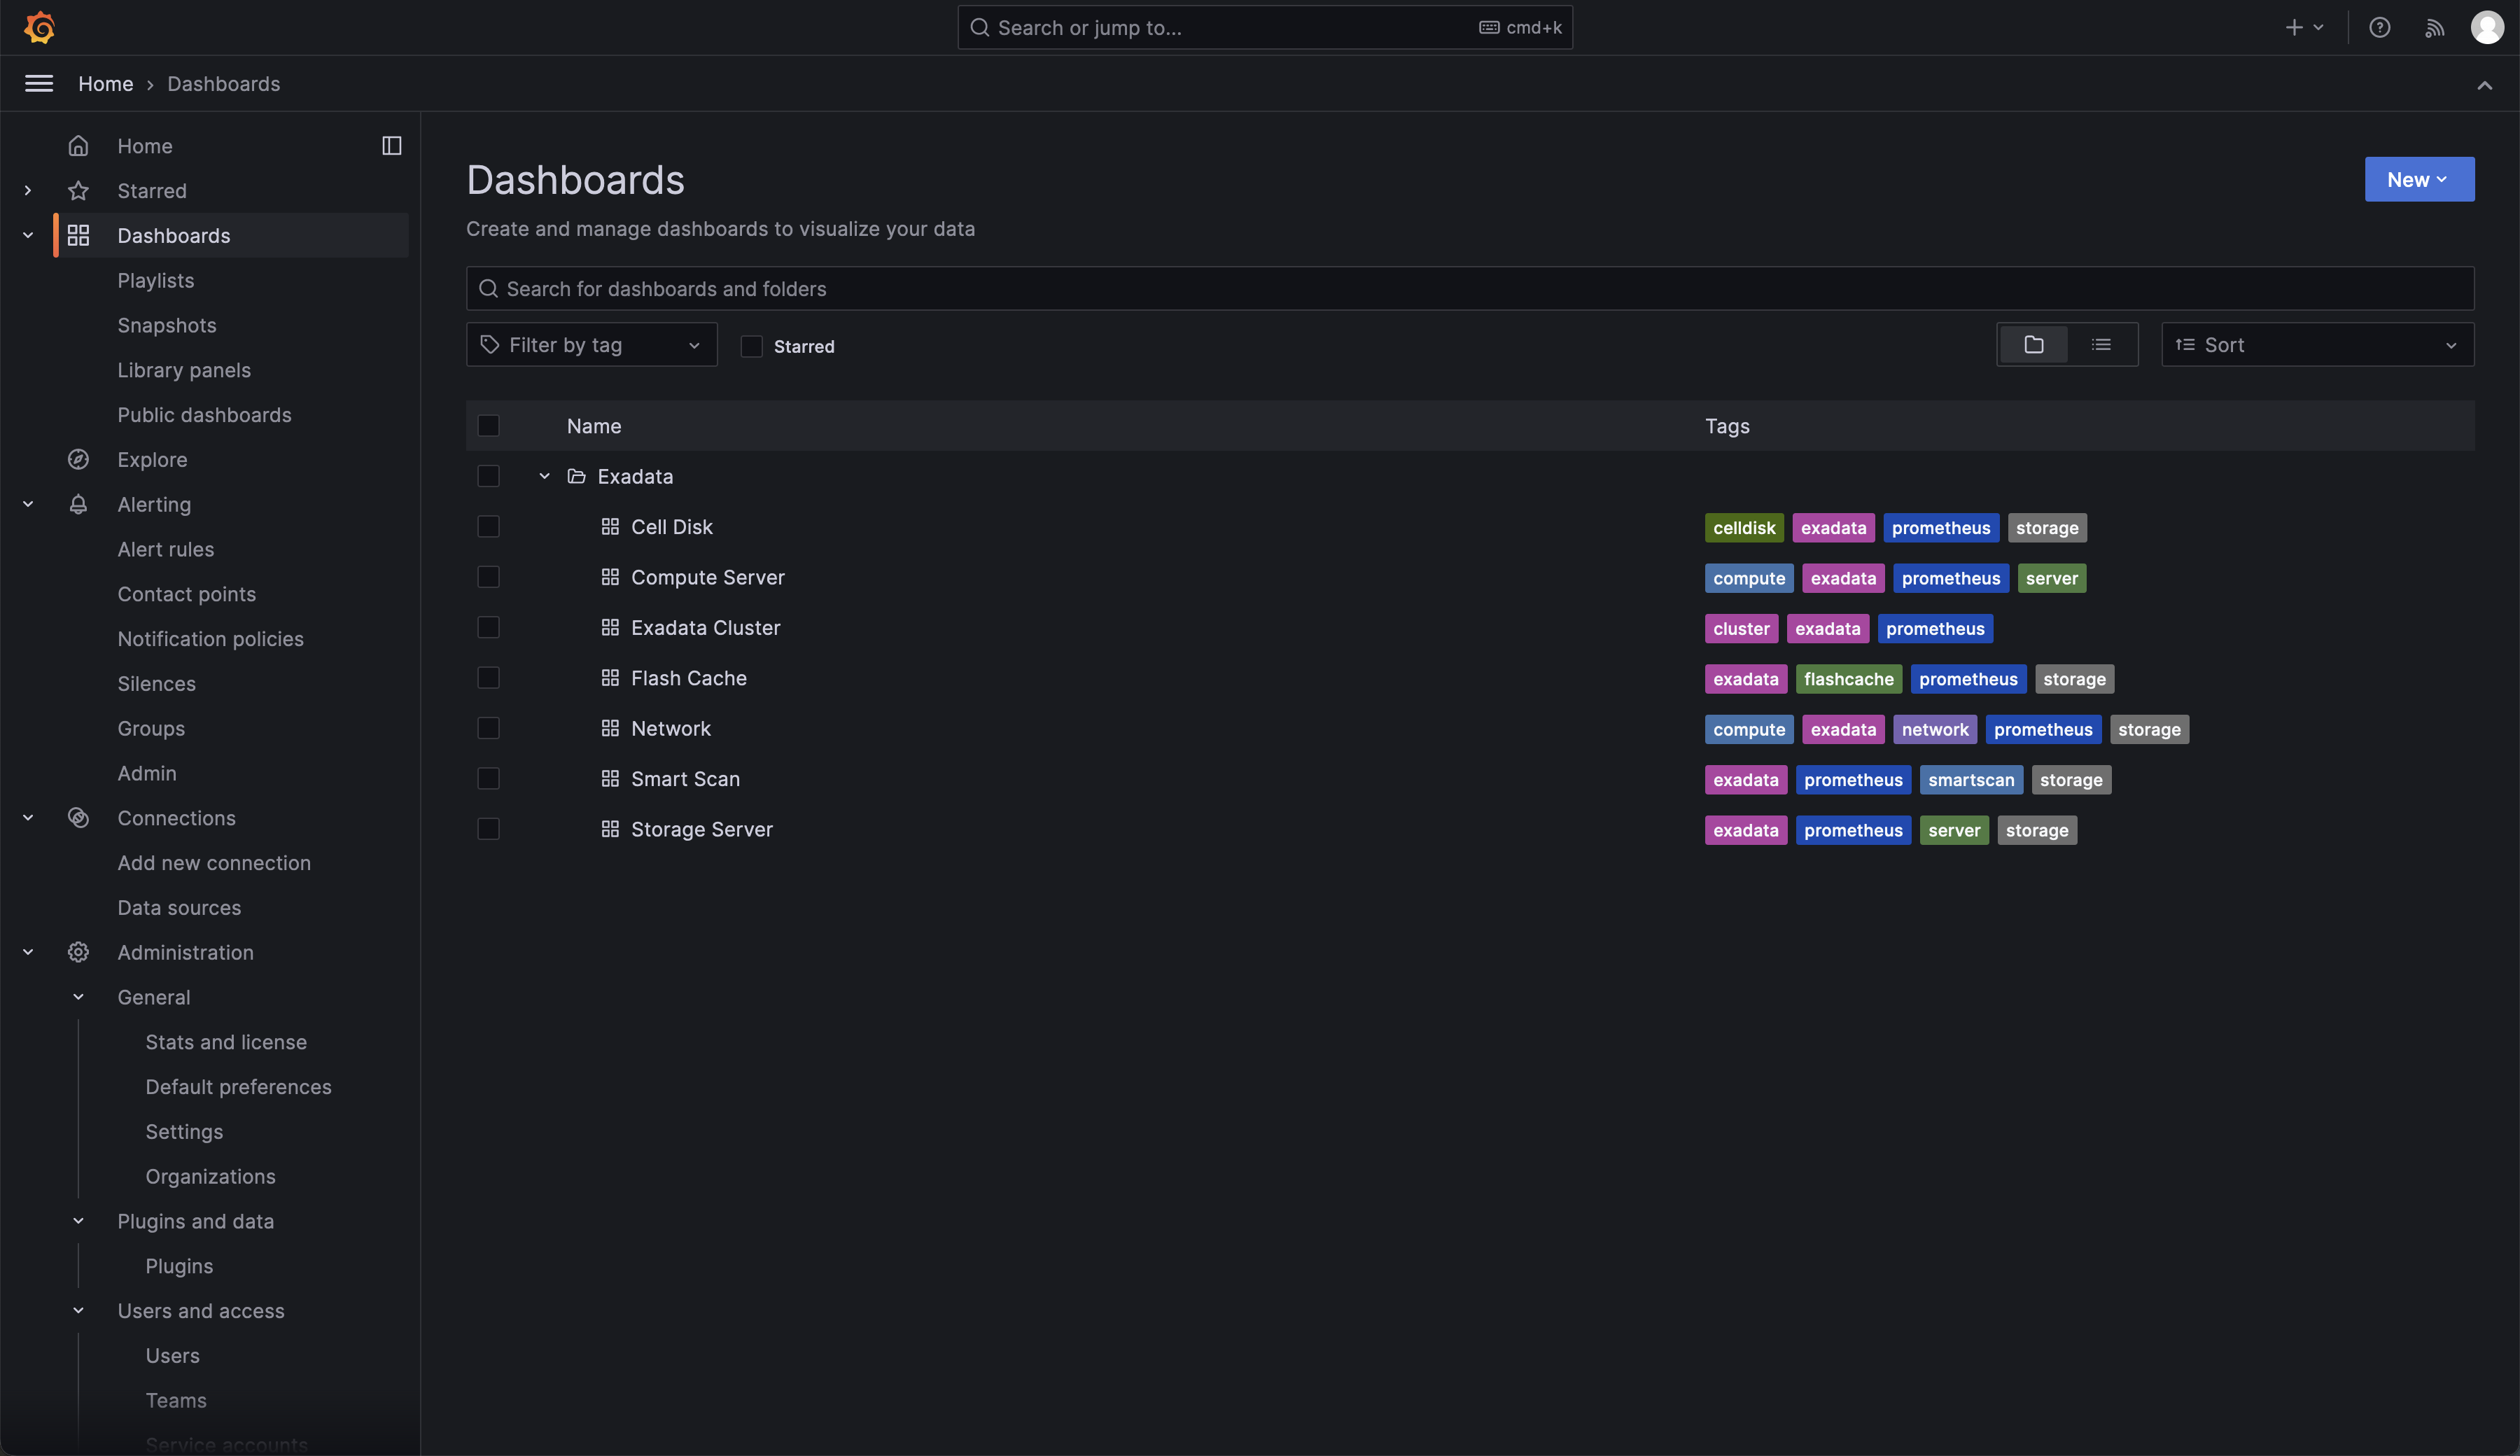
Next, we should take a look at the dashboards we imported during the build. Navigate to the Dashboards in the left-hand menu.
After expanding the ‘Exadata’ folder, you will see the seven sample dashboards we publish in the GitHub repo.
Drill into the ‘Exadata Cluster’ dashboard and you should see the following. As you can see, the dashboard is consuming data from Prometheus and showing me CPU Utilization, Client, and RDMA Network traffic, and the beginnings of Storage Server CPU utilization. Drill into any of the dashboards, and you will see more topic-specific graphs.
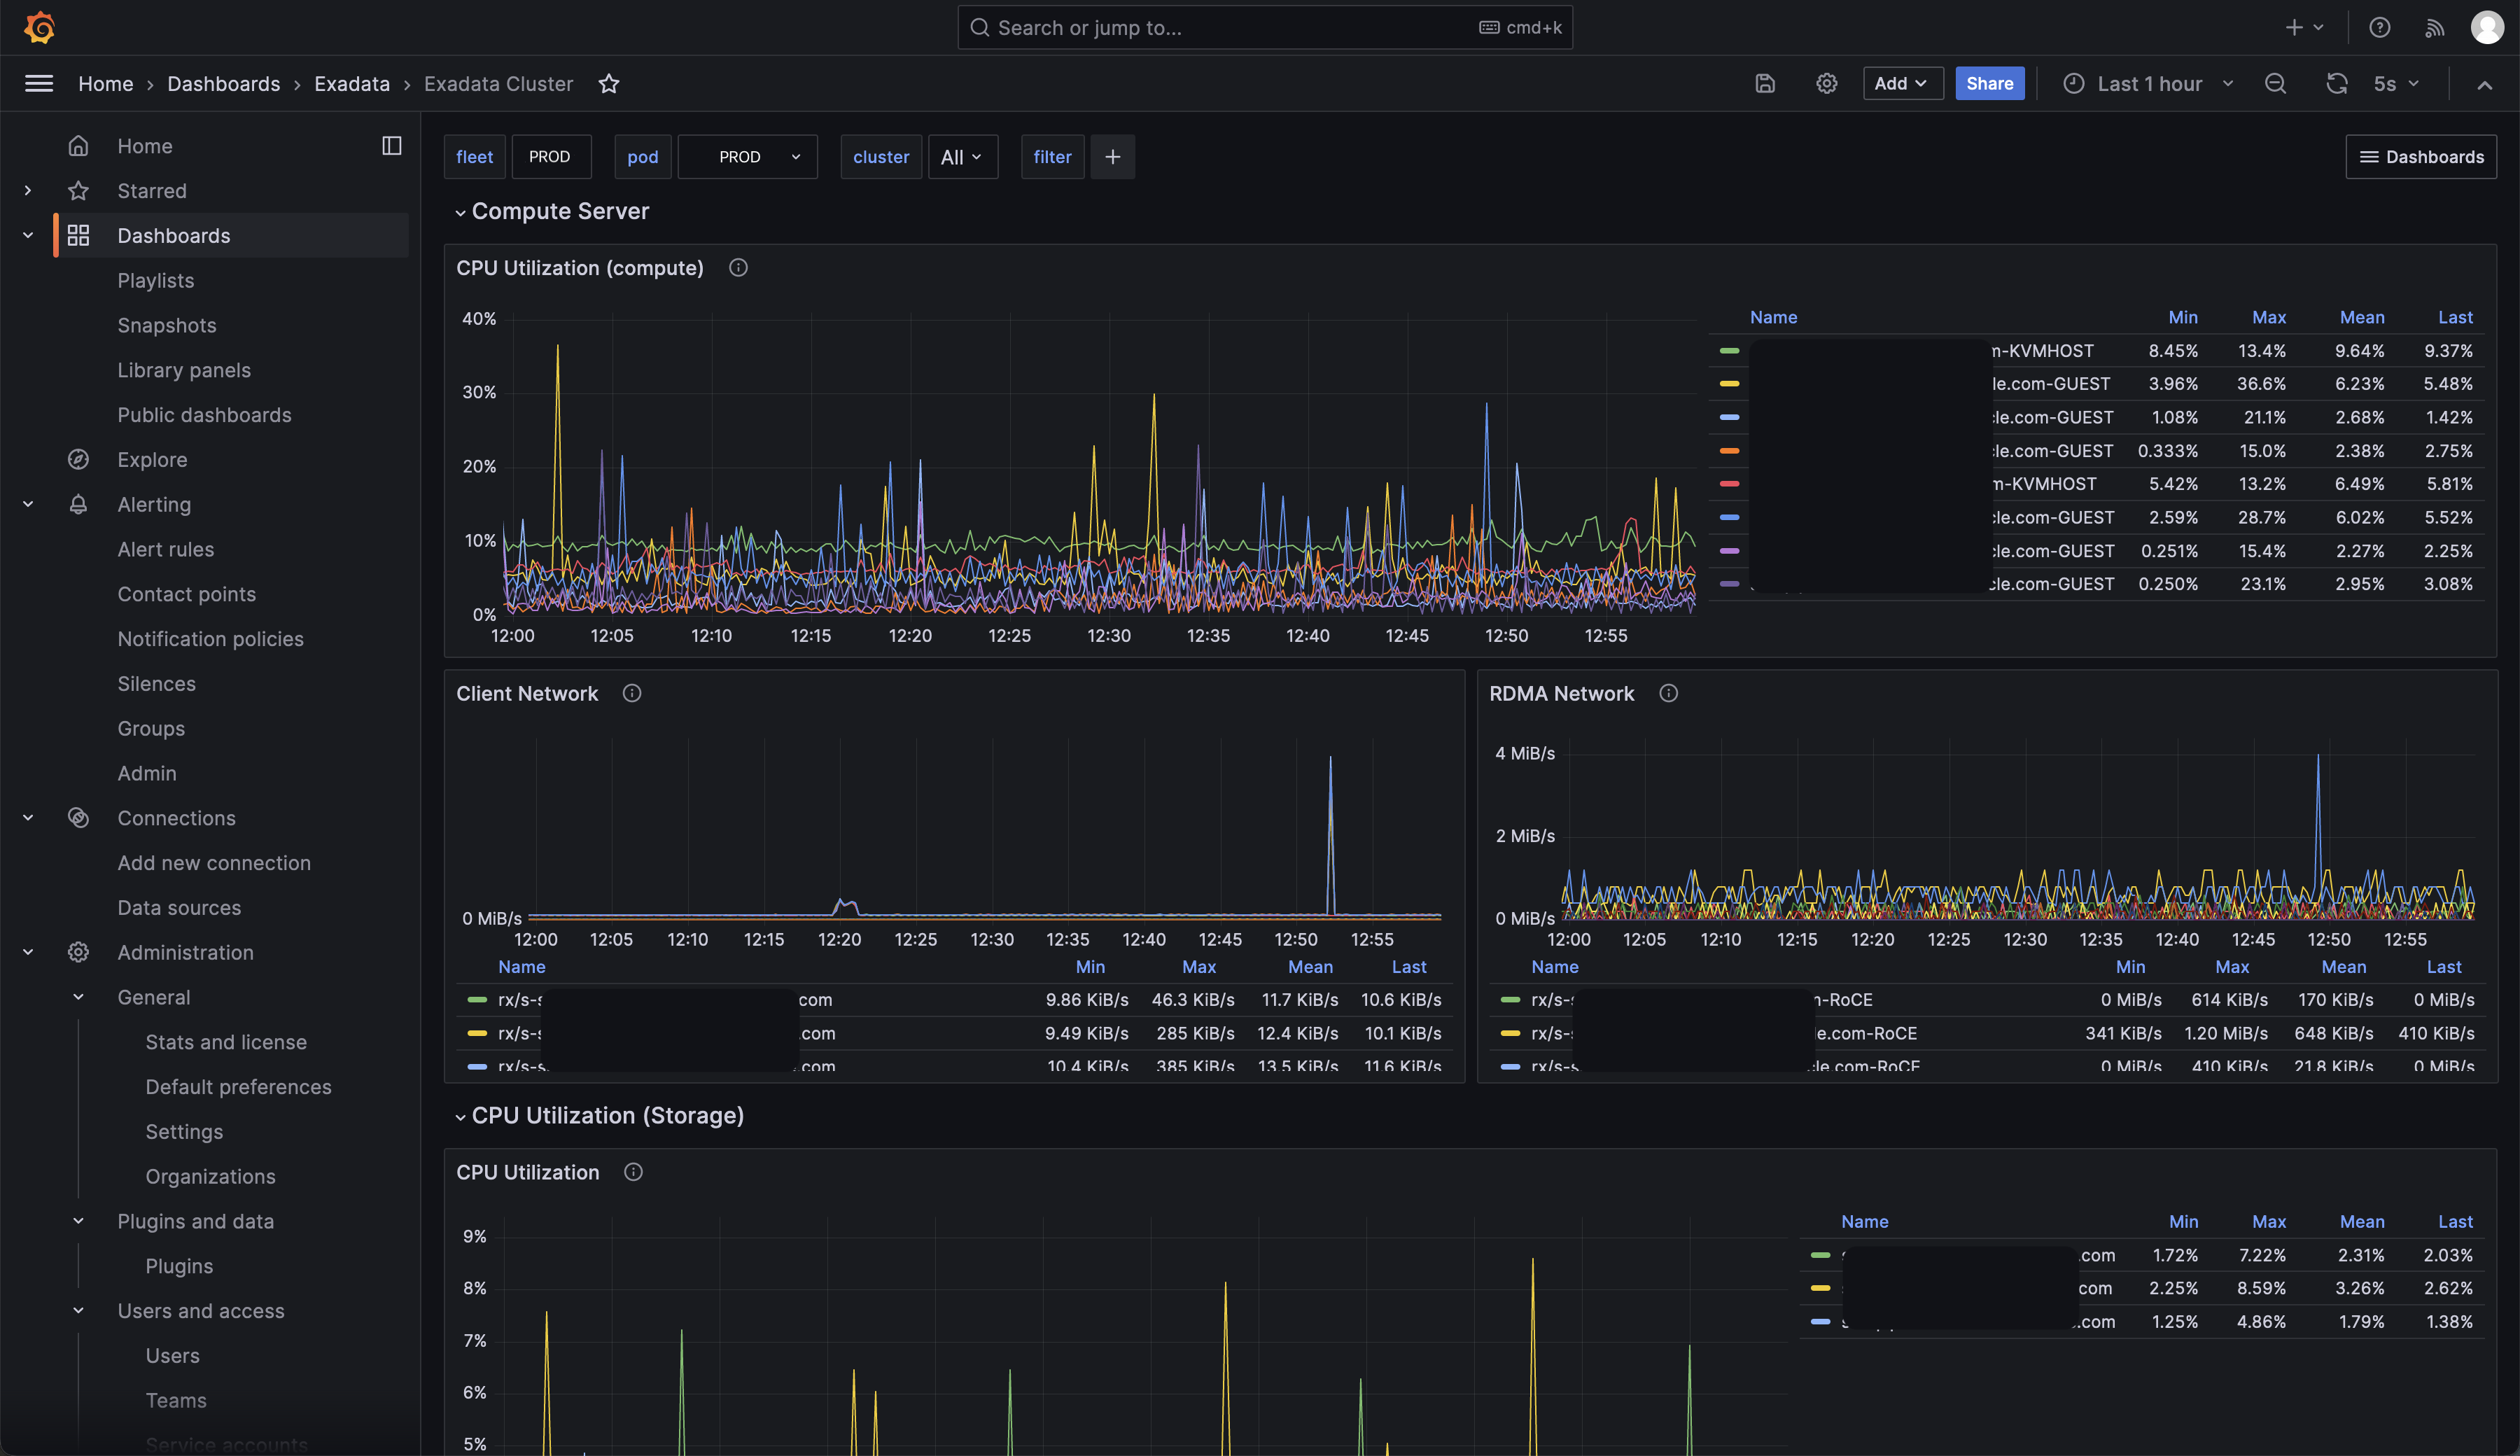
These are meant as a starting point; you may want to create dashboards showing different data for different clusters, workloads, and environments – the possibilities are almost endless!!
Take a breath!
Alright, we’re finally done! We’ve made it to the end, and if everything has gone as intended, you will now have your Exadata Database and Storage Servers all producing lots of useful Real-Time metrics. These are being collected by Prometheus and in turn, are being used to drive some useful dashboards in Grafana. As I mentioned at the start of the post, these tools (Enterprise Manager, Exawatcher, AWR, etc.) are extremely useful and you will regularly use these to diagnose and resolve any issues you face. Real-Time Insight augments these tools with information about the ‘now’ – what is happening on your machines this instant – and will accelerate your diagnosis and triage workflow.
Finally, this quick start is hosted in our GitHub repository – give it a whirl! It’s intended to get you up and running quickly so you can experience and benefit from Exadata Real-Time Insights. If you find an issue with the code, have a suggestion, or a killer dashboard you’d like to share, please leave us feedback!
Suggested Reading
Exadata Real-Time Insight Documentation