Originally published June 1, 2022
Exadata 22.1 brings a new and comprehensive monitoring solution for extracting detailed statistics across the Exadata machine. Exadata Real-Time Insight allows machine administrators to stream over 200 unique metrics directly from Exadata Database and Storage Servers at as low as one-second intervals.
Metrics and statistics are currently collected in Exadata via the management server (MS) and available to the end-user via the CLI command list metrichistory or list metriccurrent. Other OS-level metrics are collected by ExaWatcher and stored on the filesystem. Both types of statistics are automatically gathered and maintained on the individual servers and are programmatically recycled based on time and space availability.
The goal of Exadata Real-Time Insight is to centralize the gathering mechanism of all metrics and statistics from Exadata Database and Storage Servers, removing the need to collect data from each server. This centralized stream can then be used to build monitoring dashboards using many standard and popular observation applications, providing a single portal to observe Exadata metrics over time. Therefore, any incident or anomaly in activity can be quickly identified for further analysis using these dashboards. Metrics can be off-loaded to external systems for future reporting and analysis.
All types of Exadata Servers are capable of streaming metrics, including:
- Storage Servers (Cells)
- Database Servers (bare metal and KVM host deployment types)
- KVM Guests
Enabling Fine-Grained Metrics
Metrics can be enabled for fine-grained collection using the new alter metricdefinition <..> finegrained=enabled command in the relevant CLI tool (dbmcli, cellcli), as described in the relevant documentation section (for cellcli here, and dbmcli here). You can get the complete list of metrics and a description of each by running the list metricdefinition detail command. As mentioned, there are over 200, so I’m not going to describe them here.. A quick example, I’m on a storage server at the moment:
CellCLI> list metricdefinition detail
 name:                   CD_BY_FC_DIRTY
 description:            "Number of unflushed megabytes cached in FLASHCACHE on a cell disk"
 fineGrained:            Disabled
 metricType:             Instantaneous
 objectType:             CELLDISK
 unit:                   MB
 name:                   CD_IO_BY_R_LG
 description:            "Number of megabytes read in large blocks from a cell disk"
 fineGrained:            Disabled
 metricType:             Cumulative
 objectType:             CELLDISK
 unit:                   MB
 name:                   CD_IO_BY_R_LG_SEC
 description:            "Number of megabytes read in large blocks per second from a cell disk"
 fineGrained:            Disabled
 metricType:             Rate
 objectType:             CELLDISK
 unit:                   MB/sec
And so on for another few pages…
You’ll notice I have the fine-grained collection currently disabled in the above. Also, please take note of the metricType, as it will help when building dashboards later. Metrictype may be; cumulative, over a predefined time period (rate), or instantaneous.
You could enable all metrics for fine-grained monitoring with a command like:
CellCLI> alter metricdefinition finegrained=enabled where finegrained=disable
Or work up from a few metrics and add more over time. In Software 22.1, we’ve enabled a set of suggested metrics as a starting point. These can be disabled, and others enabled based on the users’ preference, and these settings persist through software updates.
For this demo, I’ve turned off all fine-grained collection. I’ll add one from the database server and one from the storage server so you can see the flow. We’ll capture the “number of megabytes allocated in flash cache for a pluggable database” (PDB_FC_BY_ALLOCATED) metric for the Storage Server.
CellCLI> alter metricdefinition PDB_FC_BY_ALLOCATED finegrained=enabled
 MetricDefinition PDB_FC_BY_ALLOCATED successfully altered.
For DB Server, we’ll capture the “Percentage of total physical memory on this server that is currently used” metric: DS_MEMUT
DBMCLI> alter metricdefinition DS_MEMUT finegrained=enabled
 MetricDefinition DS_MEMUT successfully altered.
BTW, to see all metrics currently enabled for fine-grained, you can add the where clause to the list command, for example:
DBMCLI> list metricdefinition where finegrained=enabled detail
 name:                   DS_MEMUT
 description:            "Percentage of total physical memory on this server that is currently used"
 fineGrained:            Enabled
 metricType:             Instantaneous
 objectType:             DBSERVER
 unit:                   %
To finish off going through the CLI commands, if you want to disable metrics, it’s just as simple:
Disable All:
DBMCLI> alter metricdefinition finegrained=disabled where finegrained=enabled
Or just the one:
DBMCLI> alter metricdefinition DS_MEMUT finegrained=disabled
OK, we have the metrics we want for collection, but how do we get them to where we want, and how often will it send them? Let’s look at some MS server settings:
DBMCLI> list dbserver attributes metricFGCollIntvlInSec, metricStreamIntvlInSec, metricStreamEndPoint detail
 metricFGCollIntvlInSec: 5
 metricStreamIntvlInSec: 60
 metricStreamEndPoint:
A quick dissection of the attributes:
metricFGCollIntvlInSec(metric Fine Grain Collection Interval In Seconds) – The interval at which to collect the metrics identified by thefineGrained=enabledattributemetricStreamEndPoint(metric Streaming Server End Point) – the destination for the stream of metrics. The documentation goes into how to construct the metricStreamEndPoint, so rather than republish it here, I’ll leave a link so you can work through that later.metricStreamIntvlInSec(metric Stream Interval In Seconds) – the frequency at which metrics are sent to the Streaming End Point.
Pretty self-explanatory once you deconstruct the attribute name…
The one recommendation is to keep the ratio between collection (metricFGCollIntvlInSec) and streaming (metricStreamIntvlInSec) to be at least 1:5, but no more than 1:30. So for example if metricFGCollIntvlInSec=5, then metricStreamIntvlInSec should be between 25 and 150.
There’s one more attribute that doesn’t show up, which could be important depending on the size of your Exadata “fleet”:
metricStreamTags(metric Stream Tags) – This is to help you organize and group observations from various Exadata machines. As is mentioned in the documentation, you can put anything you want here. For example, you could use “Fleet”,”Pod”, and “Cluster” tags to distinguish the installation type, location, and details of the Exadata system, or use your own existing CMDB tags.
Consumption of Streamed Metrics
Let’s now turn our attention to the other end of the flow, the consumption of these streamed metrics. Many observability tools, such as Grafana, Splunk, Kibana, and other push/pull tools, can consume Exadata Real-Time Insight metrics.
I have an ELK stack running from a previous project that I’ll be repurposing for our quick demo today. If you’re not familiar with ELK, it stands for ElasticSearch, Logstash, and Kibana. Plenty of examples, demos, and tutorials exist to help get you started if this is your first foray into real-time monitoring. Duckduckgo is your friend here; I won’t be going into details.
Here’s a quick diagram of what I’ll be doing today:
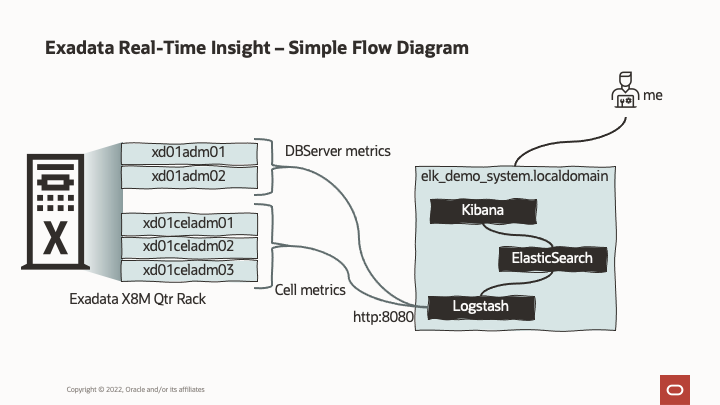
Essentially, we’ll take our PDB_FC_BY_ALLOCATED metric on the storage server and DS_MEMUT from the database server (that we’ve just enabled for fine-grained), transport it to our elk_demo_system, store, search and display it.
For this, logstash was a breeze to setup:
# cat /etc/logstash/conf.d/Exadata-RTI.conf
 input {  http { id => "real_time_insight" } }
 output {  elasticsearch { hosts => ["localhost:9200"] }}
This gave us an HTTP end point, listening on it’s default (:8080), and outputting to elasticsearch, running on the same machine (listening on :9200). If you want to ensure data is flowing, just change or add the output to be stdout { codec => rubydebug } and run logstash from the command line, and you’ll see the output flowing by.)
OK, lets turn the tap on. Back in CellCLI and DBMCLI:
CellCLI> alter cell metricFGCollIntvlInSec=5
 CellCLI> alter cell metricStreamIntvlInSec=60
 CellCLI> alter cell metricStreamTags='{"fleet":"ExaPM","pod":"xd01","cluster":"c01"}'
 CellCLI> alter cell metricStreamEndPoint=((host="http://elk_demo_system.localdomain:8080",type="json"))
(Notice the complete lack of security in my endpoint definition. As I mentioned, this is a DEMO! I would expect the see the use of https and tokens in a production environment.)
CellCLI> list cell attributes metricFGCollIntvlInSec, metricStreamIntvlInSec, metricStreamEndPoint detail
   metricFGCollIntvlInSec: 5
   metricStreamIntvlInSec: 60
   metricStreamEndPoint:   ((host="http://elk_demo_system.localdomain:8080",port=,token="",type="json",ID="..."))
   metricStreamTags:       {"fleet":"ExaPM","pod":"xd01","cluster":"c01"}
If we had a secondary endpoint to stream to, it can be added with “+=”. For example:
CellCLI> alter cell metricStreamEndPoint+=((host="http://second_elk_demo_system.localdomain:8080",type="json"))
Since I have logstash listening on the command line, and now have enabled the streaming, I should see data start to arrive (may take a minute or two to warm up, depending on the stream interval setting).
And here it comes:
{
        "headers" => {
          "content_length" => "32508",
            "http_version" => "HTTP/1.1",
          "request_method" => "POST",
         "http_user_agent" => "Java/1.8.0_331",
             "http_accept" => "application/json",
              "connection" => "keep-alive",
            "request_path" => "/",
               "http_host" => "elk_demo_system.localdomain:8080",
            "content_type" => "application/json"
     },
          "gauge" => [
         [  0] {
              "timestamp" => 1653069352000,
                 "metric" => "PDB_FC_BY_ALLOCATED",
                  "value" => "13846.625",
             "dimensions" => {
                    "cluster" => "c01",
                        "pod" => "xd01",
                   "nodeType" => "STORAGE",
                 "objectName" => "D19CDB1.HCC_TESTING",    <-- this must be one of Seth's HCC demo databases..
                     "server" => "xd01celadm01.us.oracle.com",
                      "fleet" => "ExaPM"
             },
                   "unit" => "MB"
         },
         [  1] {
              "timestamp" => 1653069357000,
                 "metric" => "PDB_FC_BY_ALLOCATED",
                  "value" => "13846.625",
             "dimensions" => {
                    "cluster" => "c01",
                        "pod" => "xd01",
                   "nodeType" => "STORAGE",
                 "objectName" => "D19CDB1.HCC_TESTING",
                     "server" => "xd01celadm01.us.oracle.com",
                      "fleet" => "ExaPM"
             },
                   "unit" => "MB"
         },
 --8<--- snip ---
       }
     ],
           "host" => "xd01celadm01.us.oracle.com",
       "@version" => "1",
     "@timestamp" => 2022-05-20T18:22:41.622Z
 }
Since I have Logstash passing off the data to ElasticSearch, and Kibana is hooked in from the front end, I now have data visible in Kibana’s “Discovery” tab:
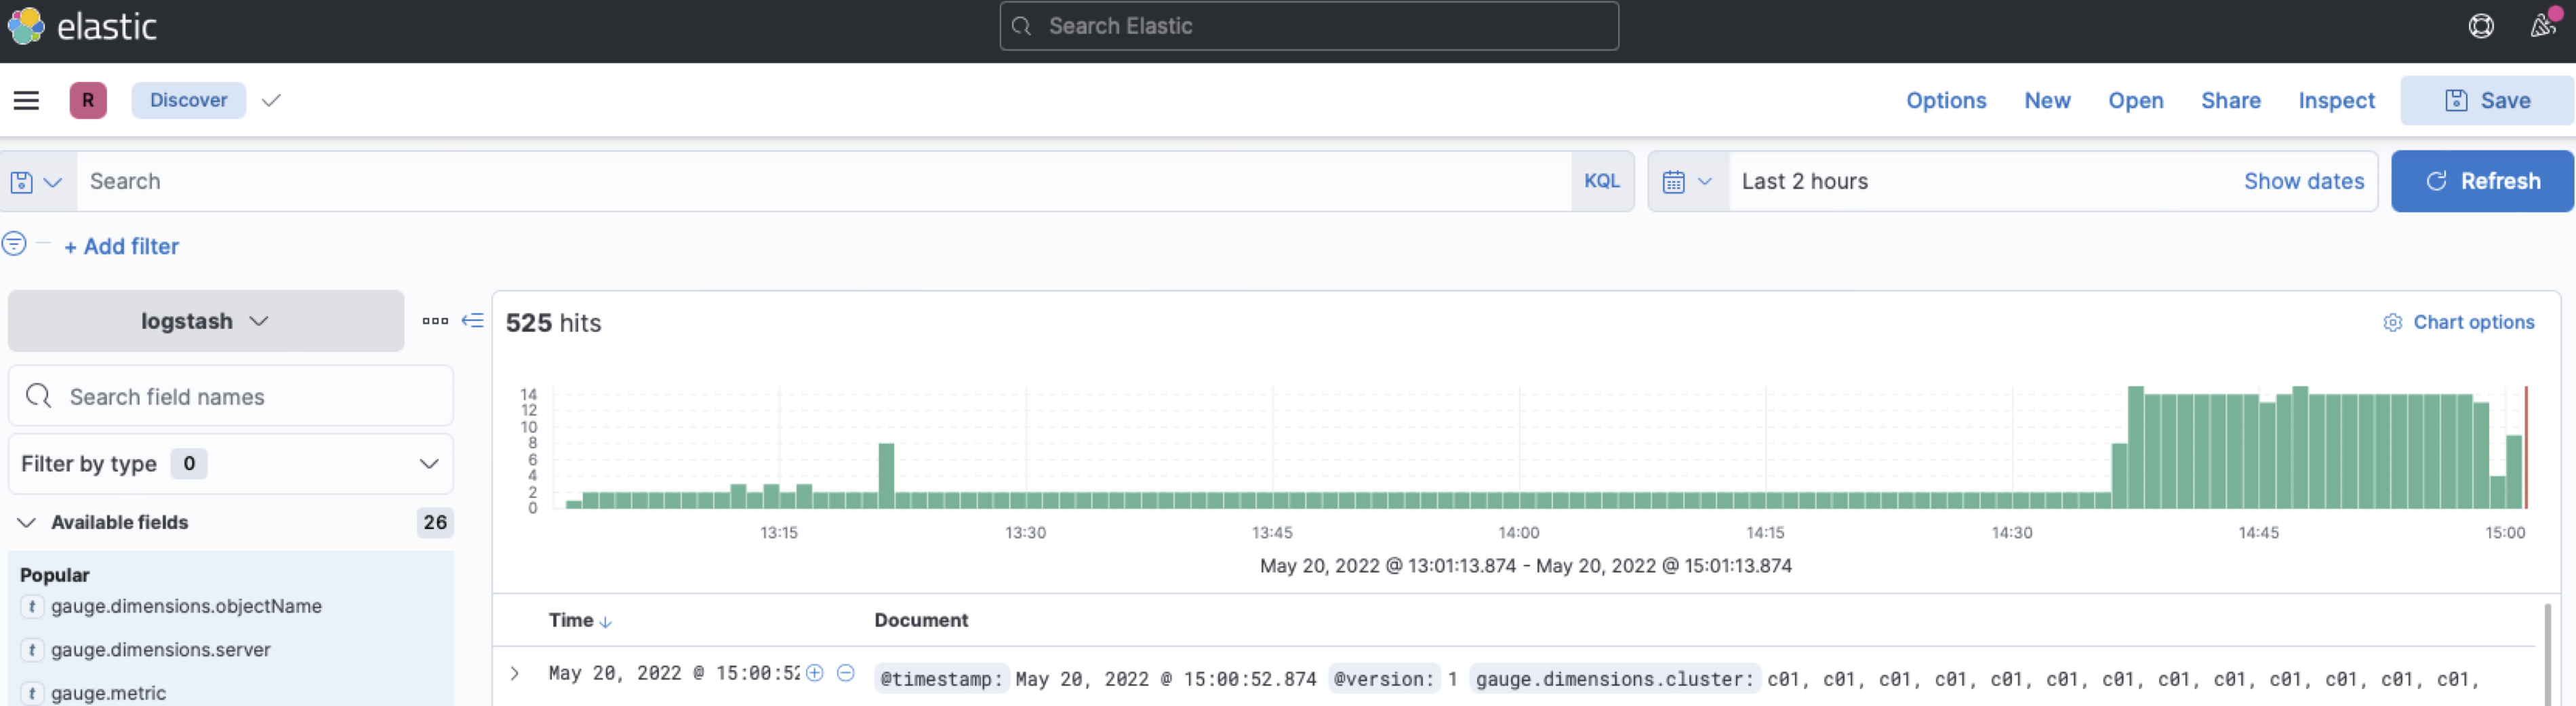
We have now successfully started streaming real-time metrics from our Exadata Database and Storage Servers to our observability platform! Hurrah!
Dashboards
Now, on to Dashboards, you still with me?
The dashboarding of metrics is an absolute art form, and not something I’ll be going through today. For our internal fleets of Exadata machines, some very talented people in our Development team have taken the time to build out several linked dashboards using one of the more popular observability solutions, Grafana and Prometheus.
Here’s a (slightly redacted) set of screenshots:
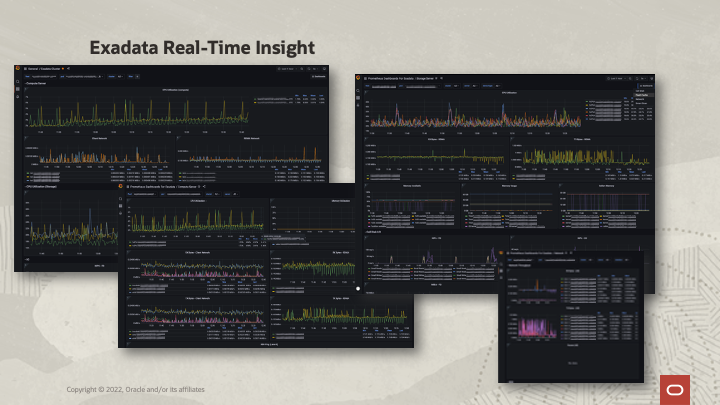
And the main dashboard in action:
I Want That!
If you’re using Grafana in your enterprise and want to add the Exadata Real-Time Insight metrics to your monitoring, it’s your lucky day. We have published the code for the above dashboards so you can get up and running as soon as possible.
If you haven’t seen it before, the Oracle Sample Projects repository on GitHub.com contains many demos and sample pieces of code for many Oracle technologies. We’ve created a new Exadata folder under the Oracle Database Examples folder:
Under it you’ll find the insight folder and the grafana-prometheus dashboard code:
insightdashboard_grafana_prometheusREADME.md– Information on the dashboards, requirements<Dashboard JSON files>– the files to import in to your observability tool to create the dashboardsMETRICS.md– A list of metrics required to run the dashboards
HINT: Set up a watch on the oracle-db-examples GitHub repo to receive the latest updates to this dashboard (and others that may be published), as we release and update them. We’ll also be building and adding demo code and examples to this repo, so be sure to check back regularly.
More Information
Exadata Real-Time Insight feature is an exciting new feature to enhance the monitoring and manageability aspects of Exadata. It is part of the Exadata System Software Release 22.1, announced yesterday, which Seth wrote about here.
You can also find more information on this release in the New Features for Oracle Exadata System Software Release 22.x section in the Oracle Exadata System Overview Guide.
Read more on the Exadata Real-Time Insight feature:
- What’s New In Exadata 22.1 – link
- Using Real-Time Insight – link
- Alter metricdefinition – cellcli link, dbmcli link
Thank you to Cecilia, Ryan and Yan for help on this blog post (part of our fantastic Development team working to make this platform what it is).
We are always interested in your feedback. You’re welcome to engage with us via Twitter @ExadataPM, @GavinAtHQ, @alex_blyth, and @Seth_M_Miller