Post-execution debugging has been an integral feature in Multilingual Engine/JavaScript from the very beginning. It allows you to record activity in the database and learn more about your application’s behaviour post execution. You can view the resulting data either on the command line as a JSON file, in Database Actions, or – most recently – in Oracle’s SQL Developer Extension for VSCode. The latter is perhaps the easiest way to do so, and the feature is available from version 25.3.0 and later.
How does it work?
First of all you need a database and some JavaScript code.
Creating the database and application
Don’t have any? No worries, you can find an example setup on GitHub. Let’s assume you’re using the same code in a playground environment.
Hitting the ground running is easy: simply start an Oracle Database 23ai Free container instance and you’re off to the races. If you don’t have an instance available you may want to have a look at the compose files that are part of the aforementioned repository. compose-podman-db.yml for example creates a database instance and a demouser account with a password of your choice. Once the database is up, clone the repository and deploy the application.
git clone https://github.com/martin-bach-oracle/javascript-blogposts.git
    cd post-execution-debugging
    /path/to/your/sqlcl-25.3.0/bin/sql demouser@localhost/freepdb1
    project gen-artifact
    project deploy -file artifact/post-execution-debugging-1.0.0.zip
At the end of the deployment process you should have a table, a few functions/procedures and JavaScript modules in your schema.
Debugging
Next, fire up VSCode and create a new connection to the database schema where you deployed your application to. Open the JavaScript Modules node and right-click on PURCHASE_ORDER_MODULE to open it in the editor. Add breakpoints to the code just as you would in any other language. Maybe add one at line 18 and 57 respectively? This will instruct the debugger to record what happened at this particular code path. Remember it’s post-execution debugging, which implies the code must run once before data points are available.
With the breakpoints set, you need a driver script, as you would in PL/SQL debugging. There’s a new icon in the top right corner, to the left of the cog, which opens a drop down menu.
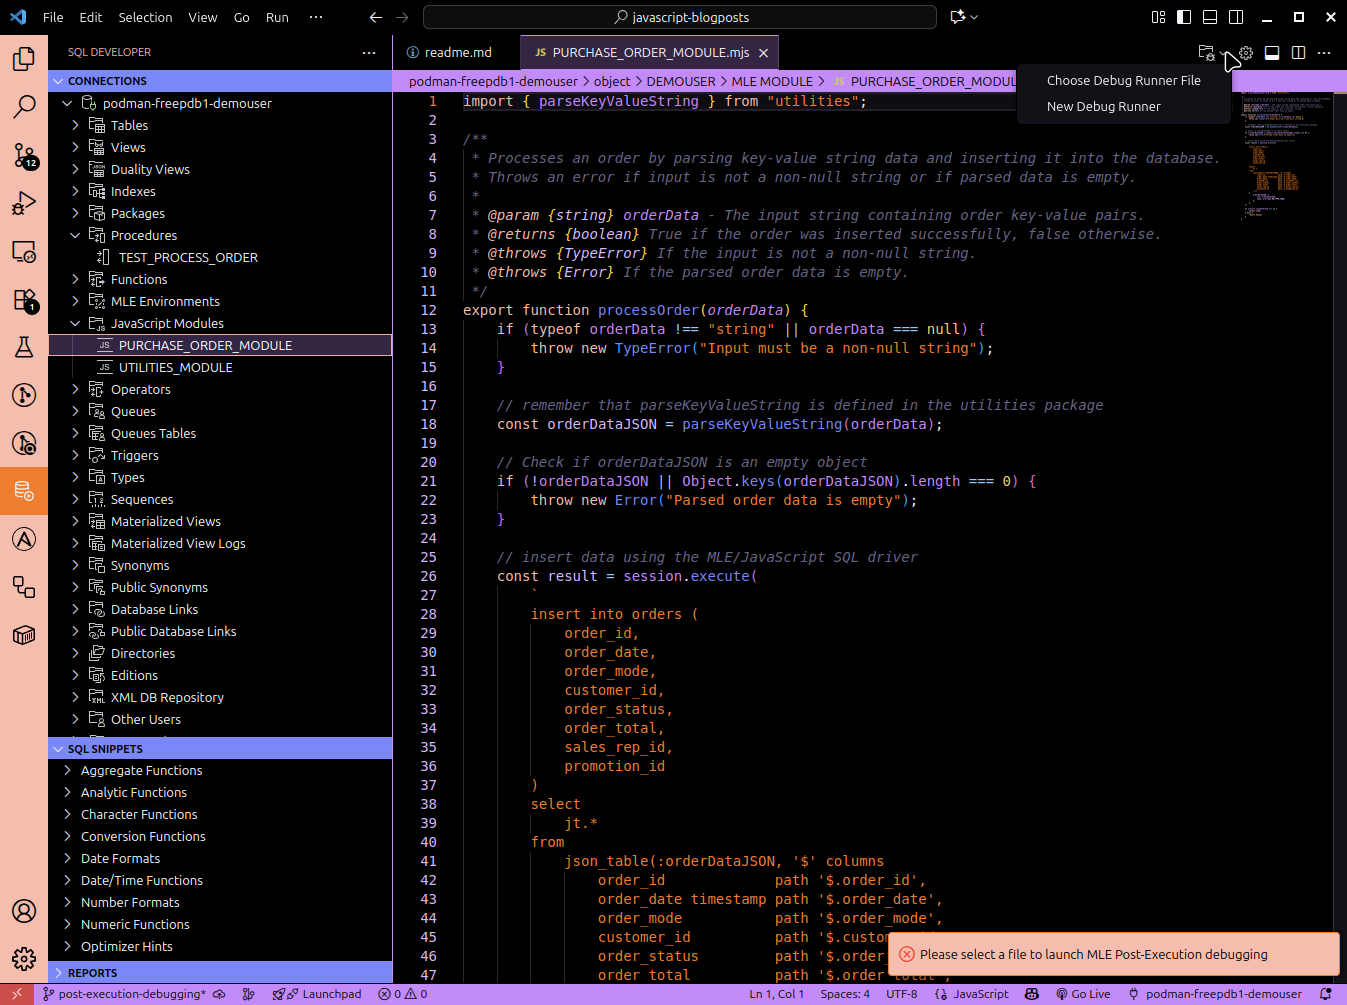
You can either select an existing file as the debug runner (test-debugrunner.sql is a suitable candidate) or create your own. Let’s use the existing one to save ourselves some time. All it does is import the processOrder function from the purchase_order_module and execute it. As per the JSDoc, it requires a delimited string as input, and it will insert the data into the orders table.
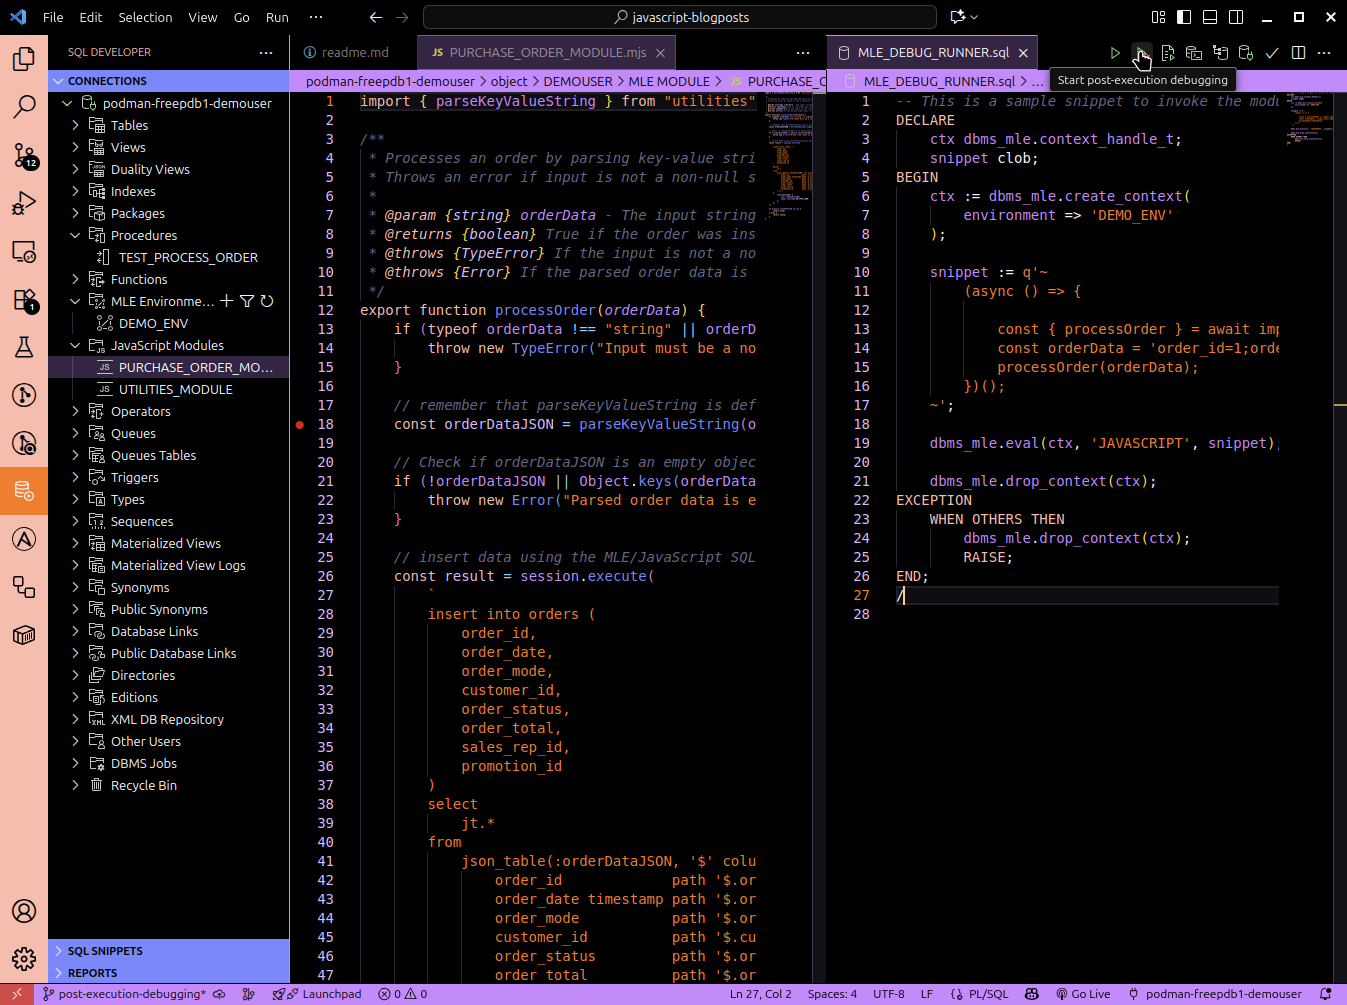
Now it’s time to hit the “Start post-execution debugging” button.
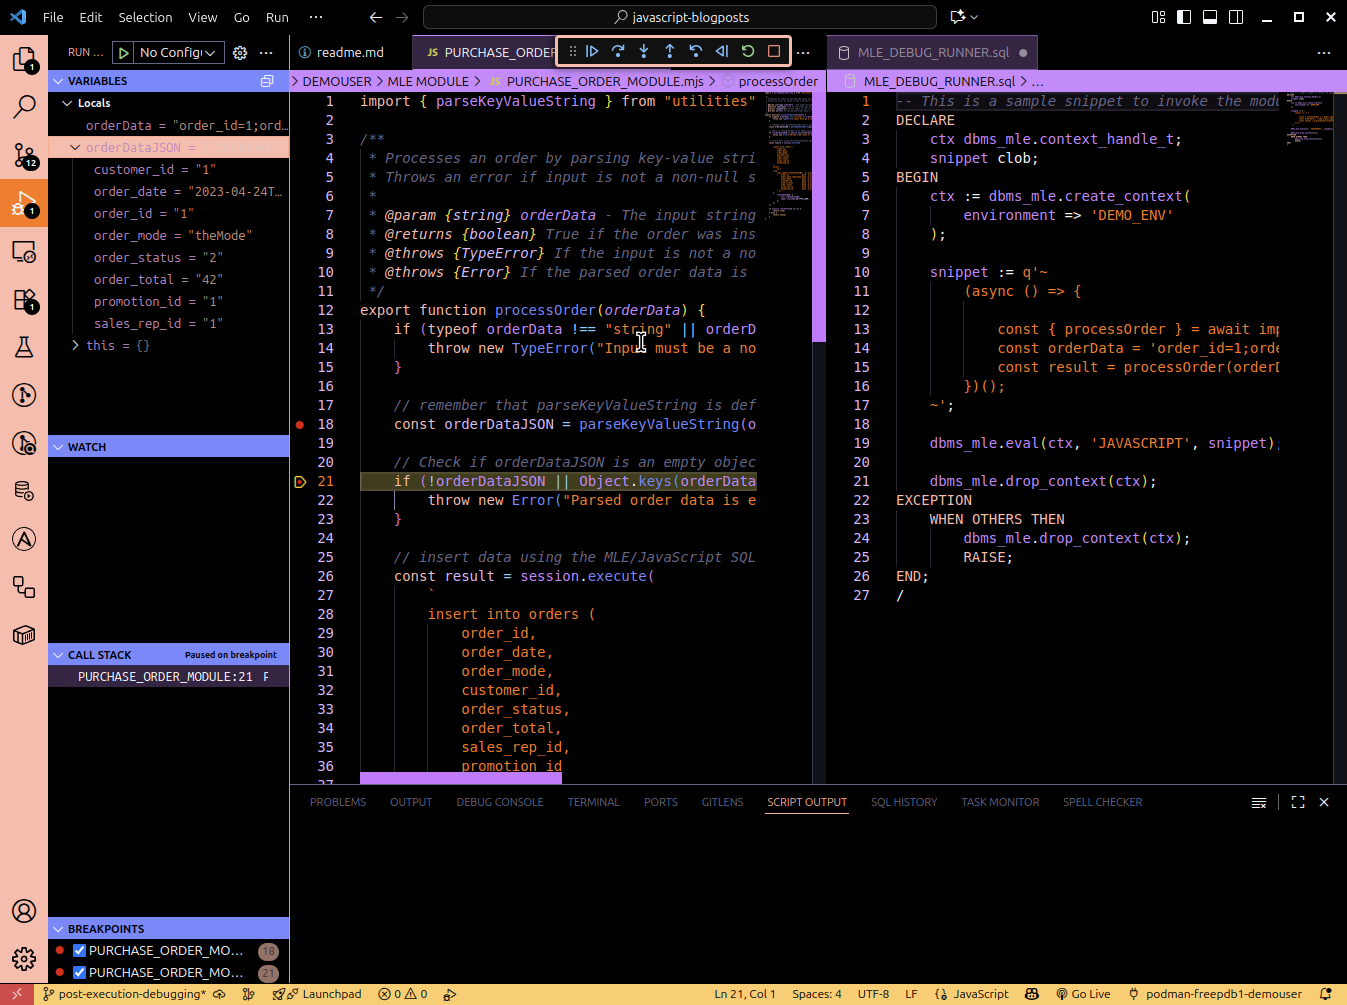
The debugging experience aims to be the same as with node.js: to the left you have your variables and their values, including nested JavaScript objects. You have access to your watchpoints (not covered in the article) and you can see the call stack along with the breakpoints.
Use the navigation as always: step in/out/over, run to the end and abort – you have all the options available.
Summary
Oracle SQLDeveloper Extension for VSCode 25.3.0 and later offer a graphical user interface into MLE/JavaScript. This way you can debug your JavaScript code in a way that’s very similar to a node application. You can set breakpoints and inspect variables. This can be a huge time saver in many situations.
Happy debugging!