Post Execution Debugging in Oracle 23ai Free
Wouldn’t it be nice if you could attach a debug profile to live JavaScript code, but only if and when needed? One that has as minimal an intrusion effect as possible whilst letting you specify which variables to watch, and report their value under specific conditions? This is what Post-Execution Debugging can help with.
UPDATE: This post was written with Database Actions in mind. Oracle SQL Developer Extension for VSCode 25.3.0 and later offer a graphical user interface into post-execution debugging. See this post for details
Sometimes it is necessary to get insights into variables and the values they store. Continuing the fetch() examples from the previous article let’s assume you tasked to record the value fetched from a REST API call in case the API misbehaves. The REST-API used in this article is provided by ORDS. It returns values from the employees table as JSON. Using Database Actions it is very straight-forward to enable Post-Execution Debugging and view the results.
The function used to fetch data is repeated here for your convenience.
/**
     * use the fetch() API to retrieve data from a remote source
     * @param {string} url - the URL from where to fetch. Requires an ACE
     * @returns {json} the resulting JSON data
     */
    export async function fetchExample(url) {

        if (url === undefined || url.length < 0) {
            throw new Error("please provide a URL");
        }

        try {
            const response = await fetch(
                url,
                {
                    credentials: "include"
                }
            );

            if (! response.ok) {
                throw new Error(`A network error occurred: ${response.status}`);
            }

            const jsonData = await response.json();

            return jsonData;
        } catch (err) {
            throw err;
        }
    }
fetchExample() is provided as part of a JavaScript module named FETCH_DEMO_MODULE; a call specification in the form of a function (fetch_example()) is available as well. The following figure shows the module’s code as rendered in Database Actions.
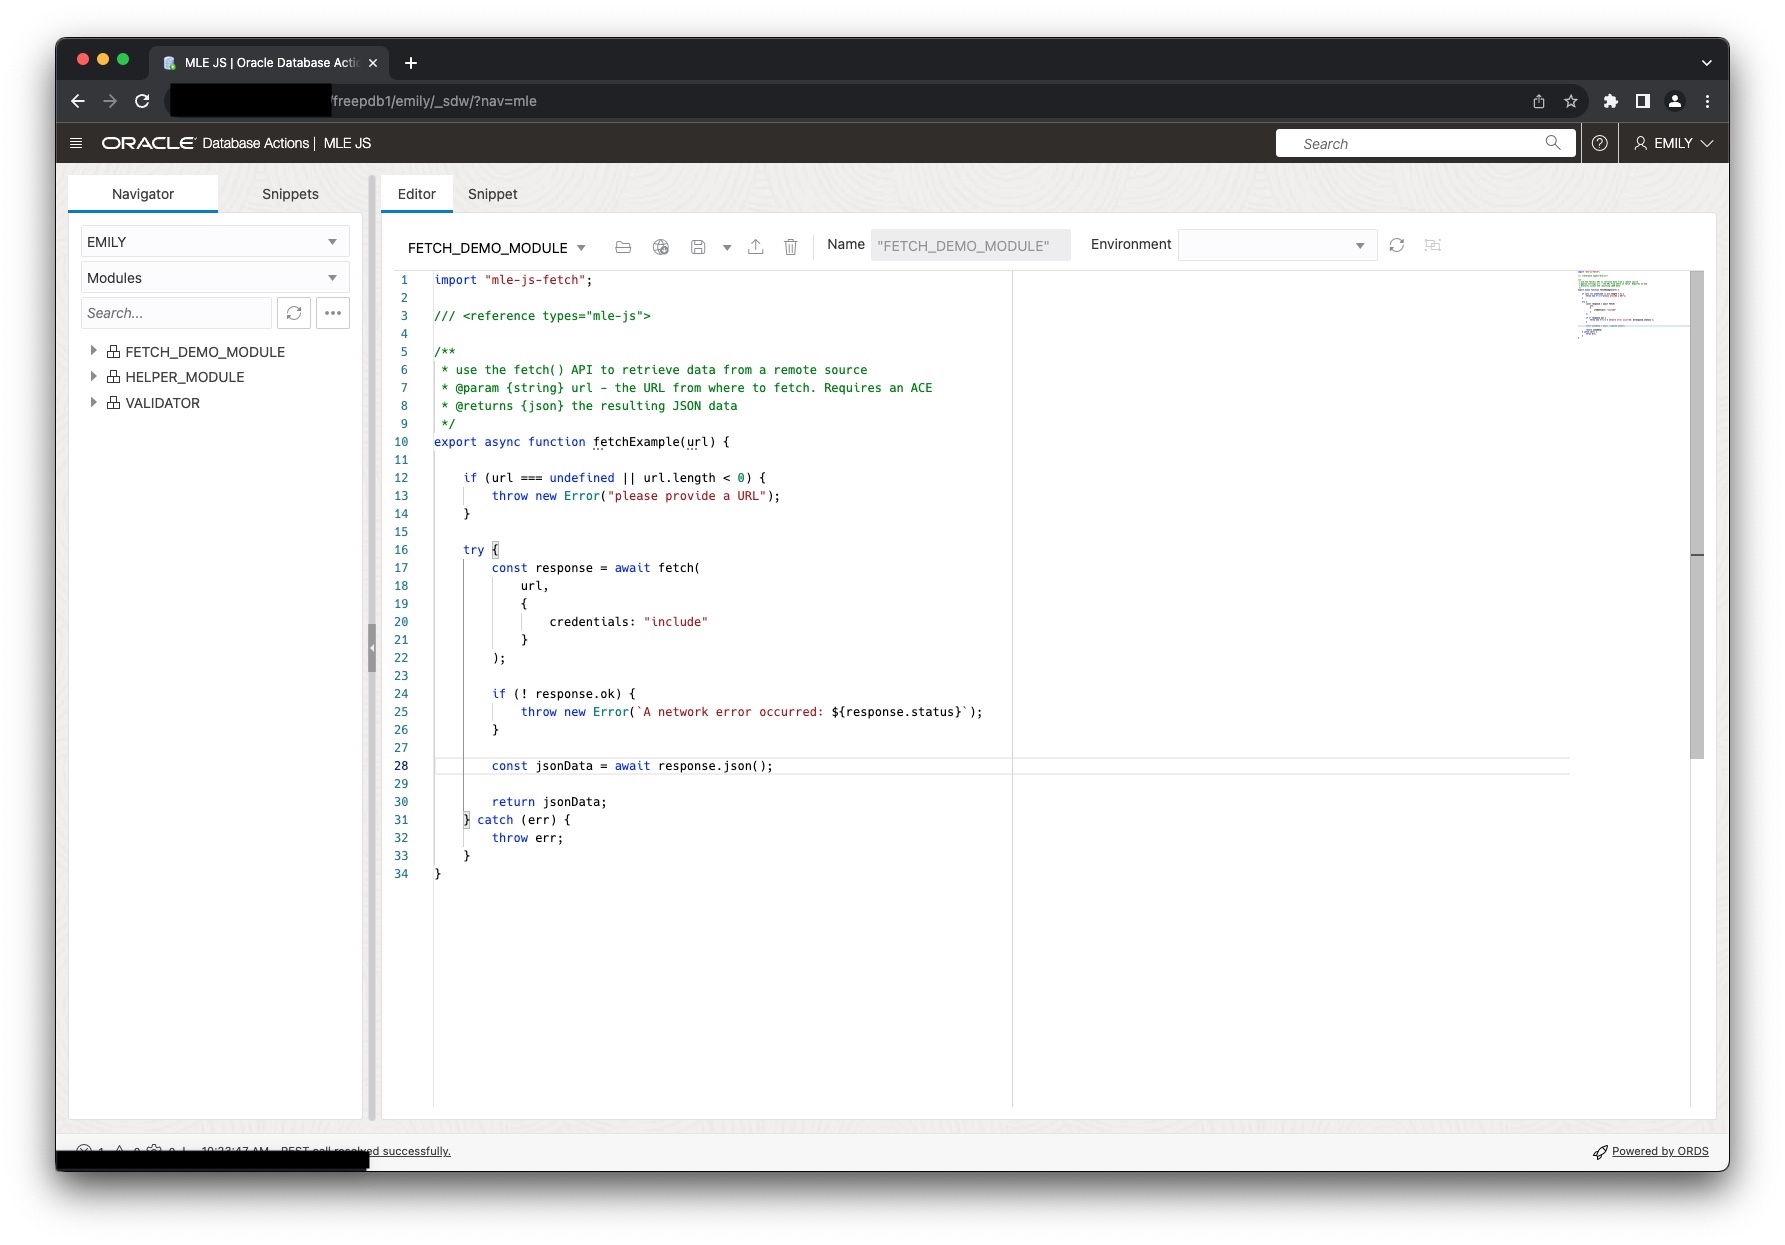
Note that this example is kept simple to focus on post-execution debugging! A real application would of course use OAuth2 for authentication and authorisation.
The remainder of the article assumes you are logged into an ORDS 23.2.0 instance, using the MLE JS editor.
Given the correct URL the code will fetch JSON from an ORDS instance:
SQL> SELECT
      2      JSON_SERIALIZE(fetch_example(
      3          'https://1.2.3.4:8443/ords/freepdb1/emily/employees/100'
      4*     ) PRETTY) AS jsonData;

    JSONDATA
    ____________________________________________________________________
    {
      "department_id" : 90,
      "salary" : 24000,
      "manager_id" : null,
      "commission_pct" : null,
      "hire_date" : "2013-06-17T00:00:00Z",
      "first_name" : "Steven",
      "email" : "SKING",
      "employee_id" : 100,
      "phone_number" : "1.515.555.0100",
      "links" :
      [
        {
          "rel" : "self",
          "href" : "https://1.2.3.4:8443/ords/freepdb1/emily/employees/100"
        },
        {
          "rel" : "edit",
          "href" : "https://1.2.3.4:8443/ords/freepdb1/emily/employees/100"
        },
        {
          "rel" : "describedby",
          "href" : "https://1.2.3.4:8443/ords/freepdb1/emily/metadata-catalog/employees/item"
        },
        {
          "rel" : "collection",
          "href" : "https://1.2.3.4:8443/ords/freepdb1/emily/employees/"
        }
      ],
      "last_name" : "King",
      "job_id" : "AD_PRES"
    }
Debugging JavaScript code using Post-Execution Debugging
Post-execution debugging requires that you define a debug specification in JSON format. The debug specification defines one or more actions by combining
- JavaScript module name
- A line number referring to the module where the probe is supposed to fire
- The type type of probe (watchpoint or snapshot)
Prerquisites
Before you can start using Post-Execution Debugging you need to define an MLE env. Database Actions can help with that as well, here is a screenshot of the MLE env’s definition used in this article.
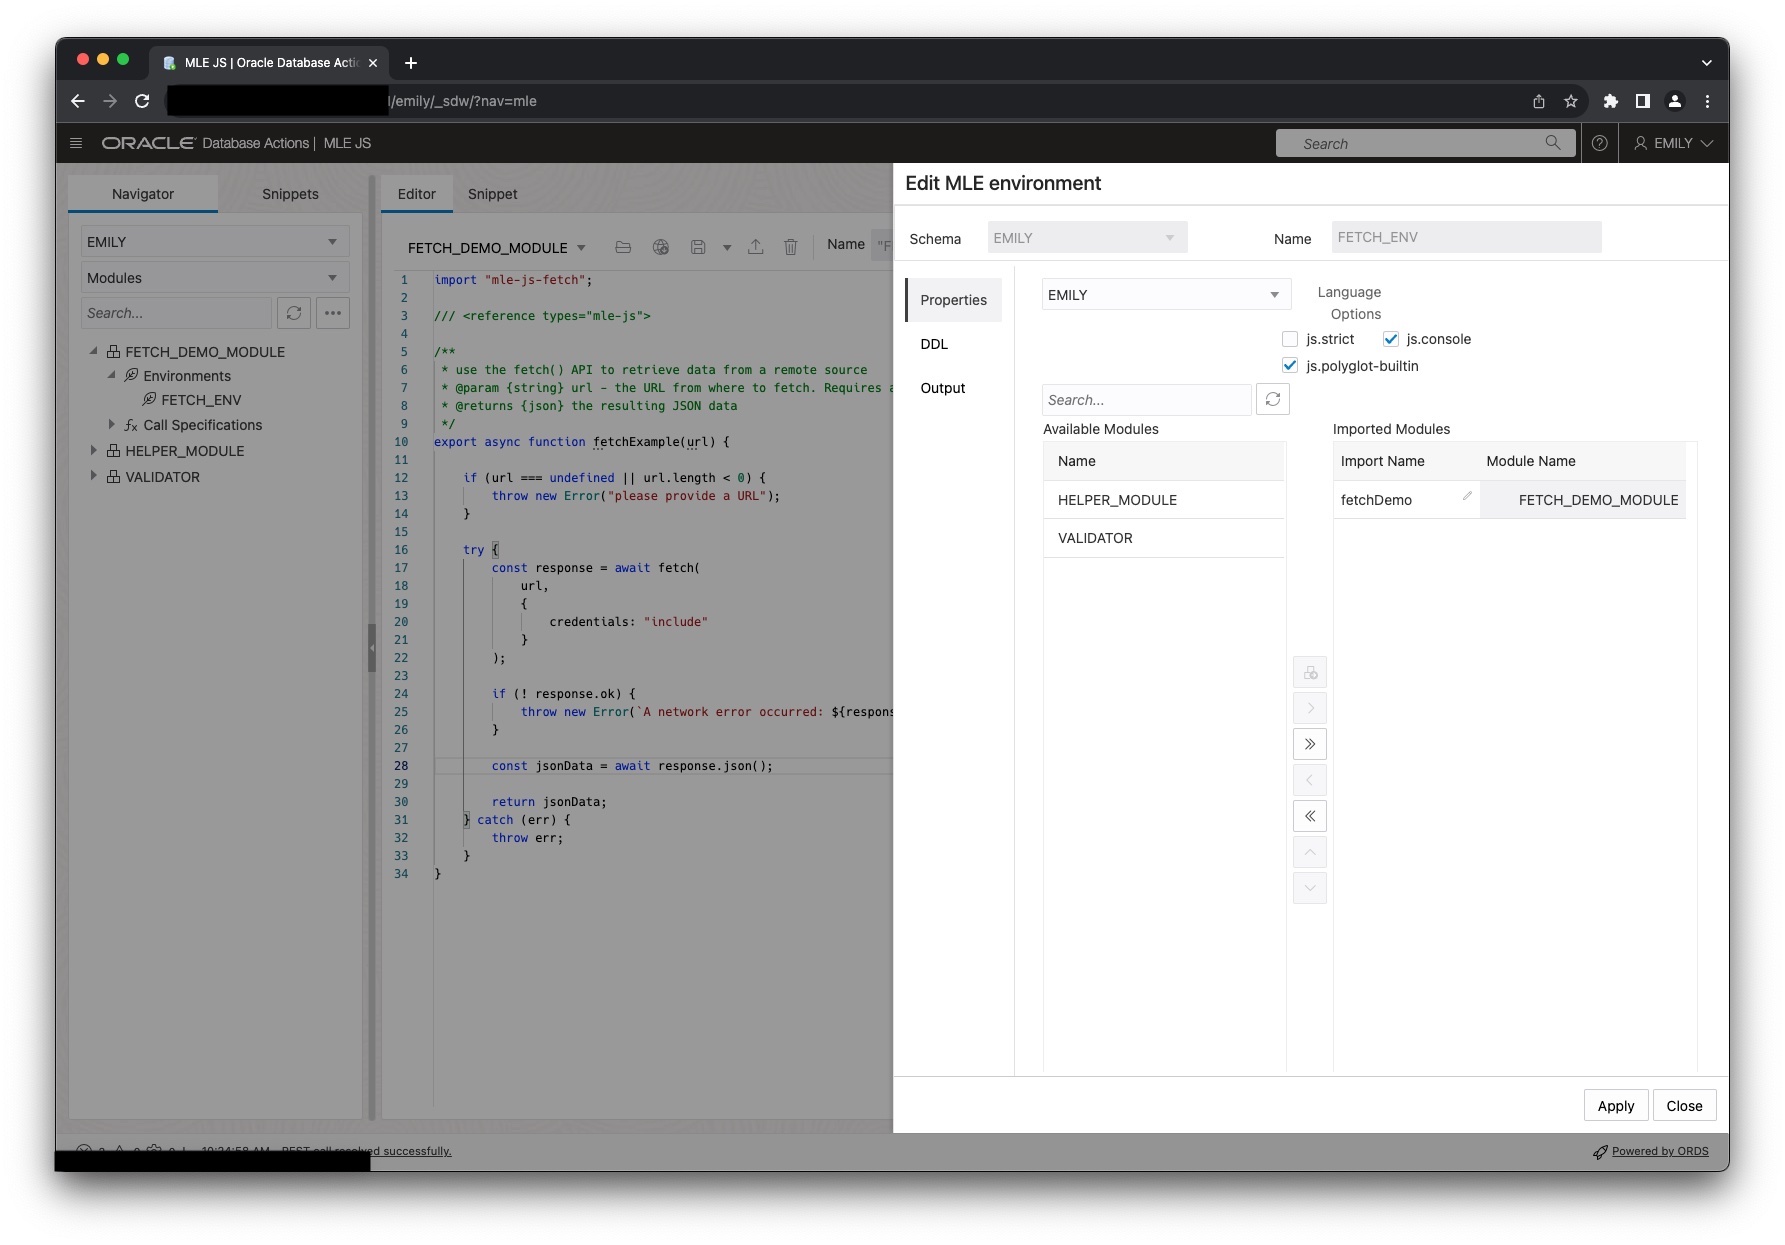
With the MLE module and environment created it is time to start debugging.
Creating Debug Specifications
Switch to the Snippets tab next. It allows you to run arbitrary JavaScript code in the database. Use the drop down menu shown in the figure below enter the debug specification wizard.
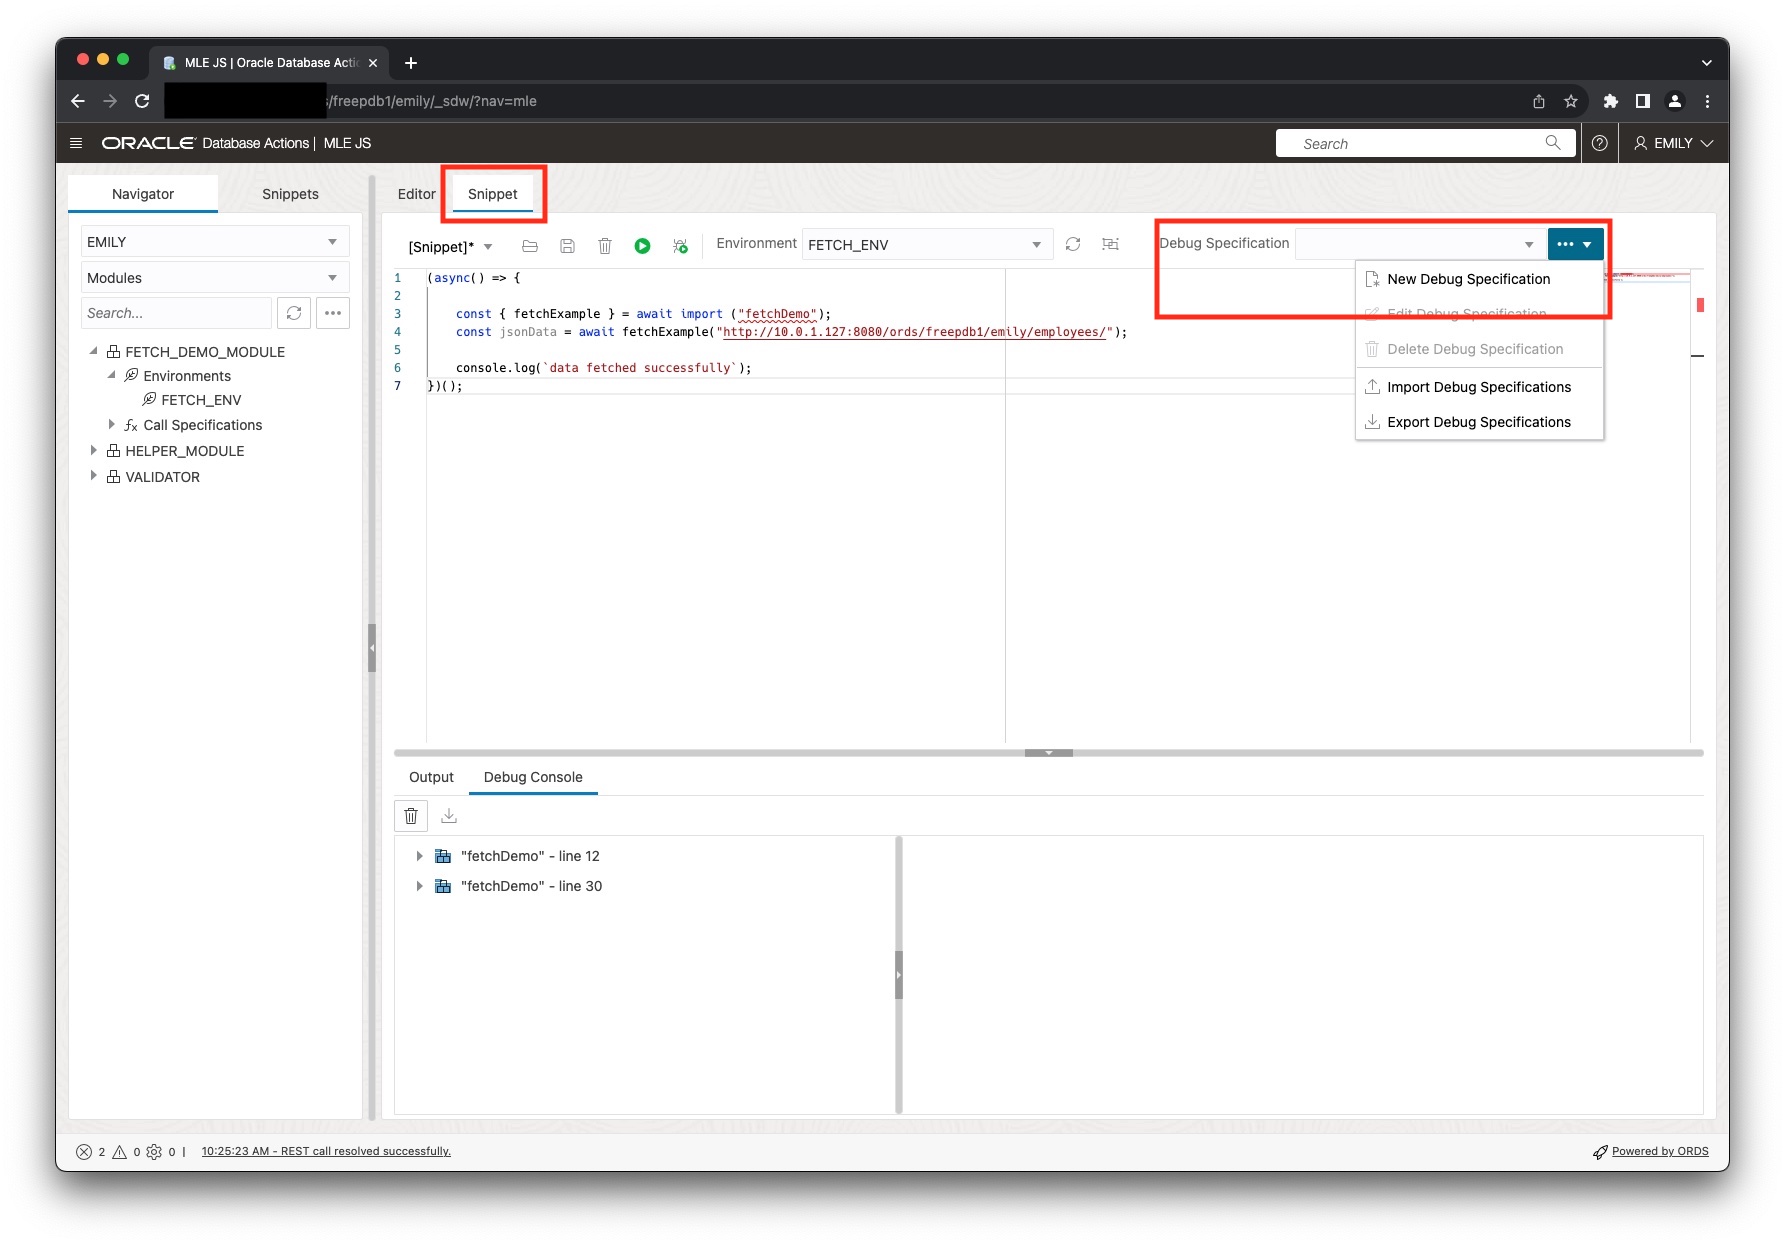
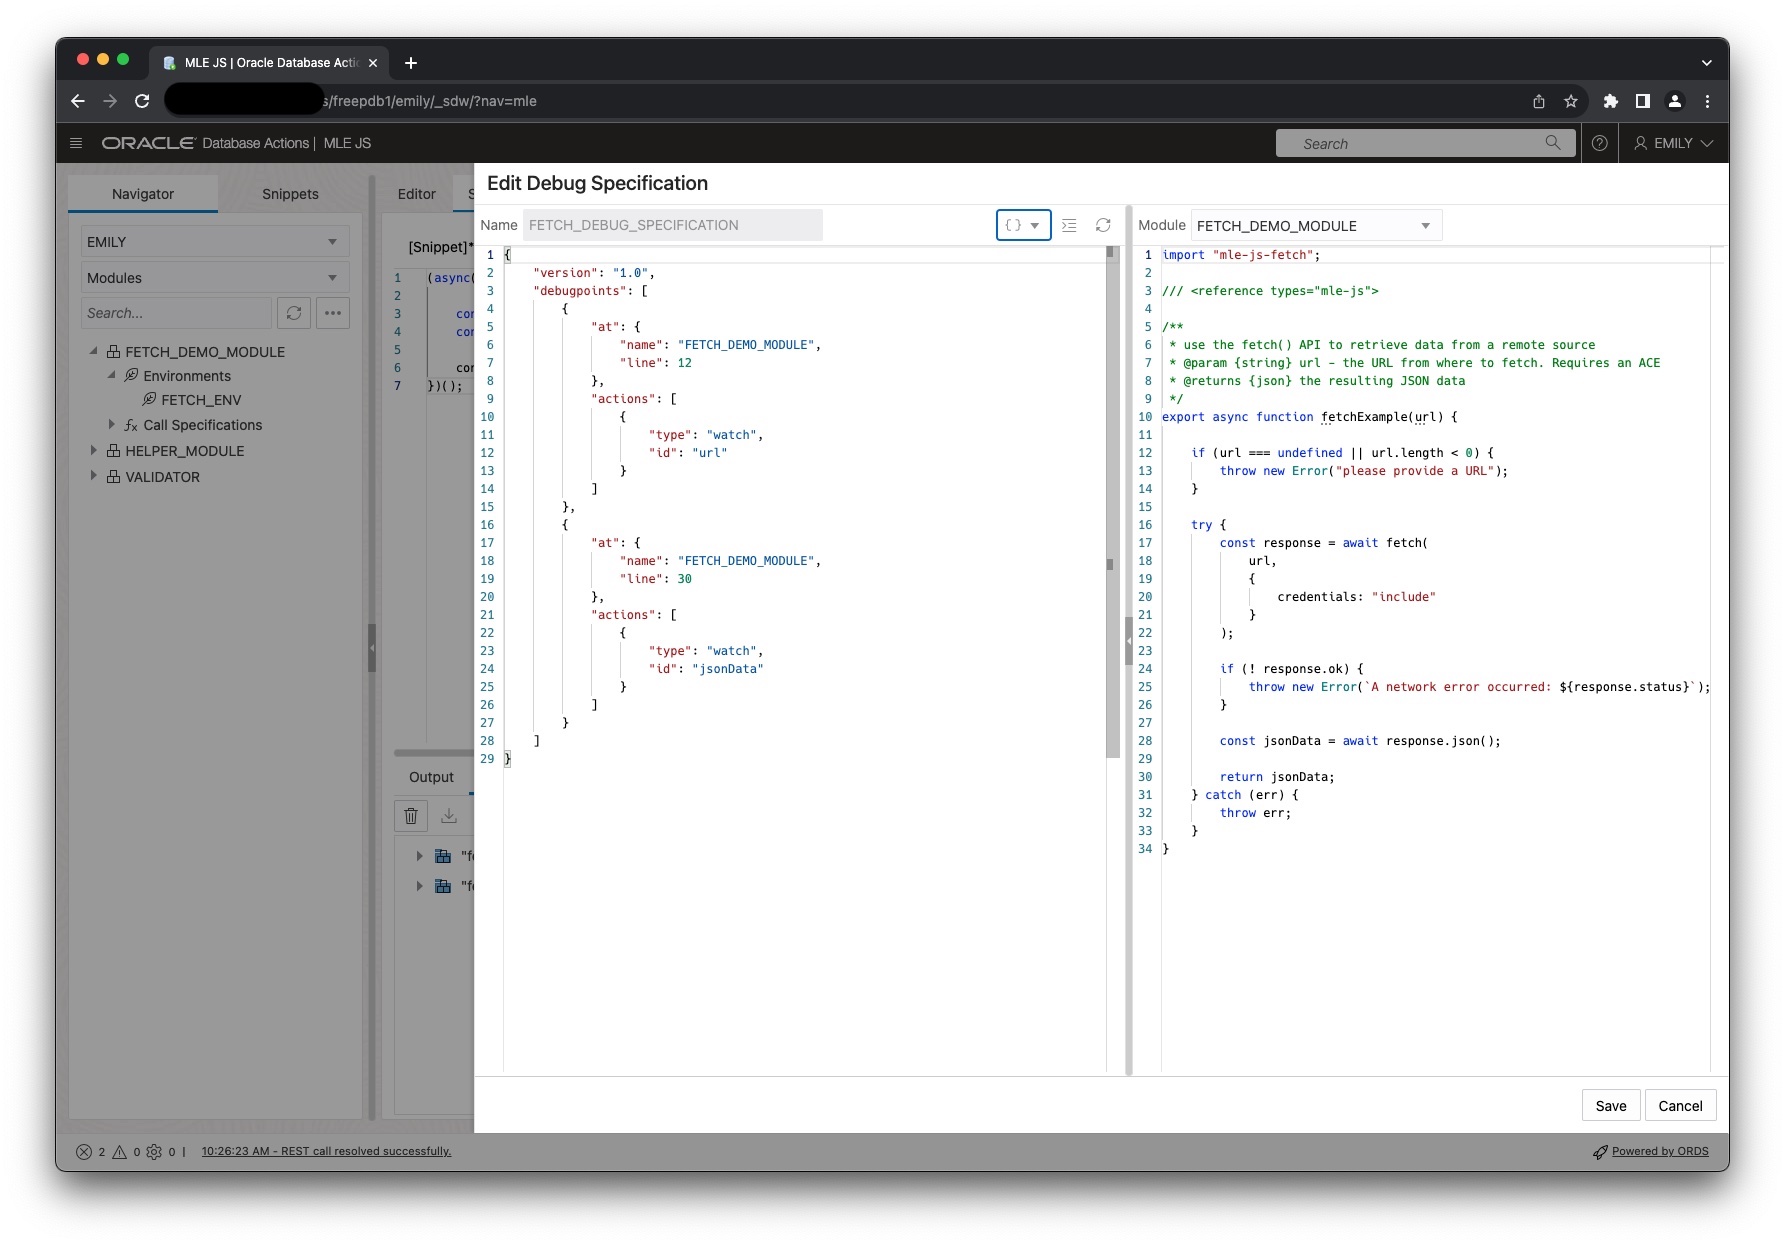
Select the module you would like to debug (FETCH_DEMO_MODULE) from the drop down on the right hand side. Next, you can either enter the debug specification manually or you make use of one of the templates offered.
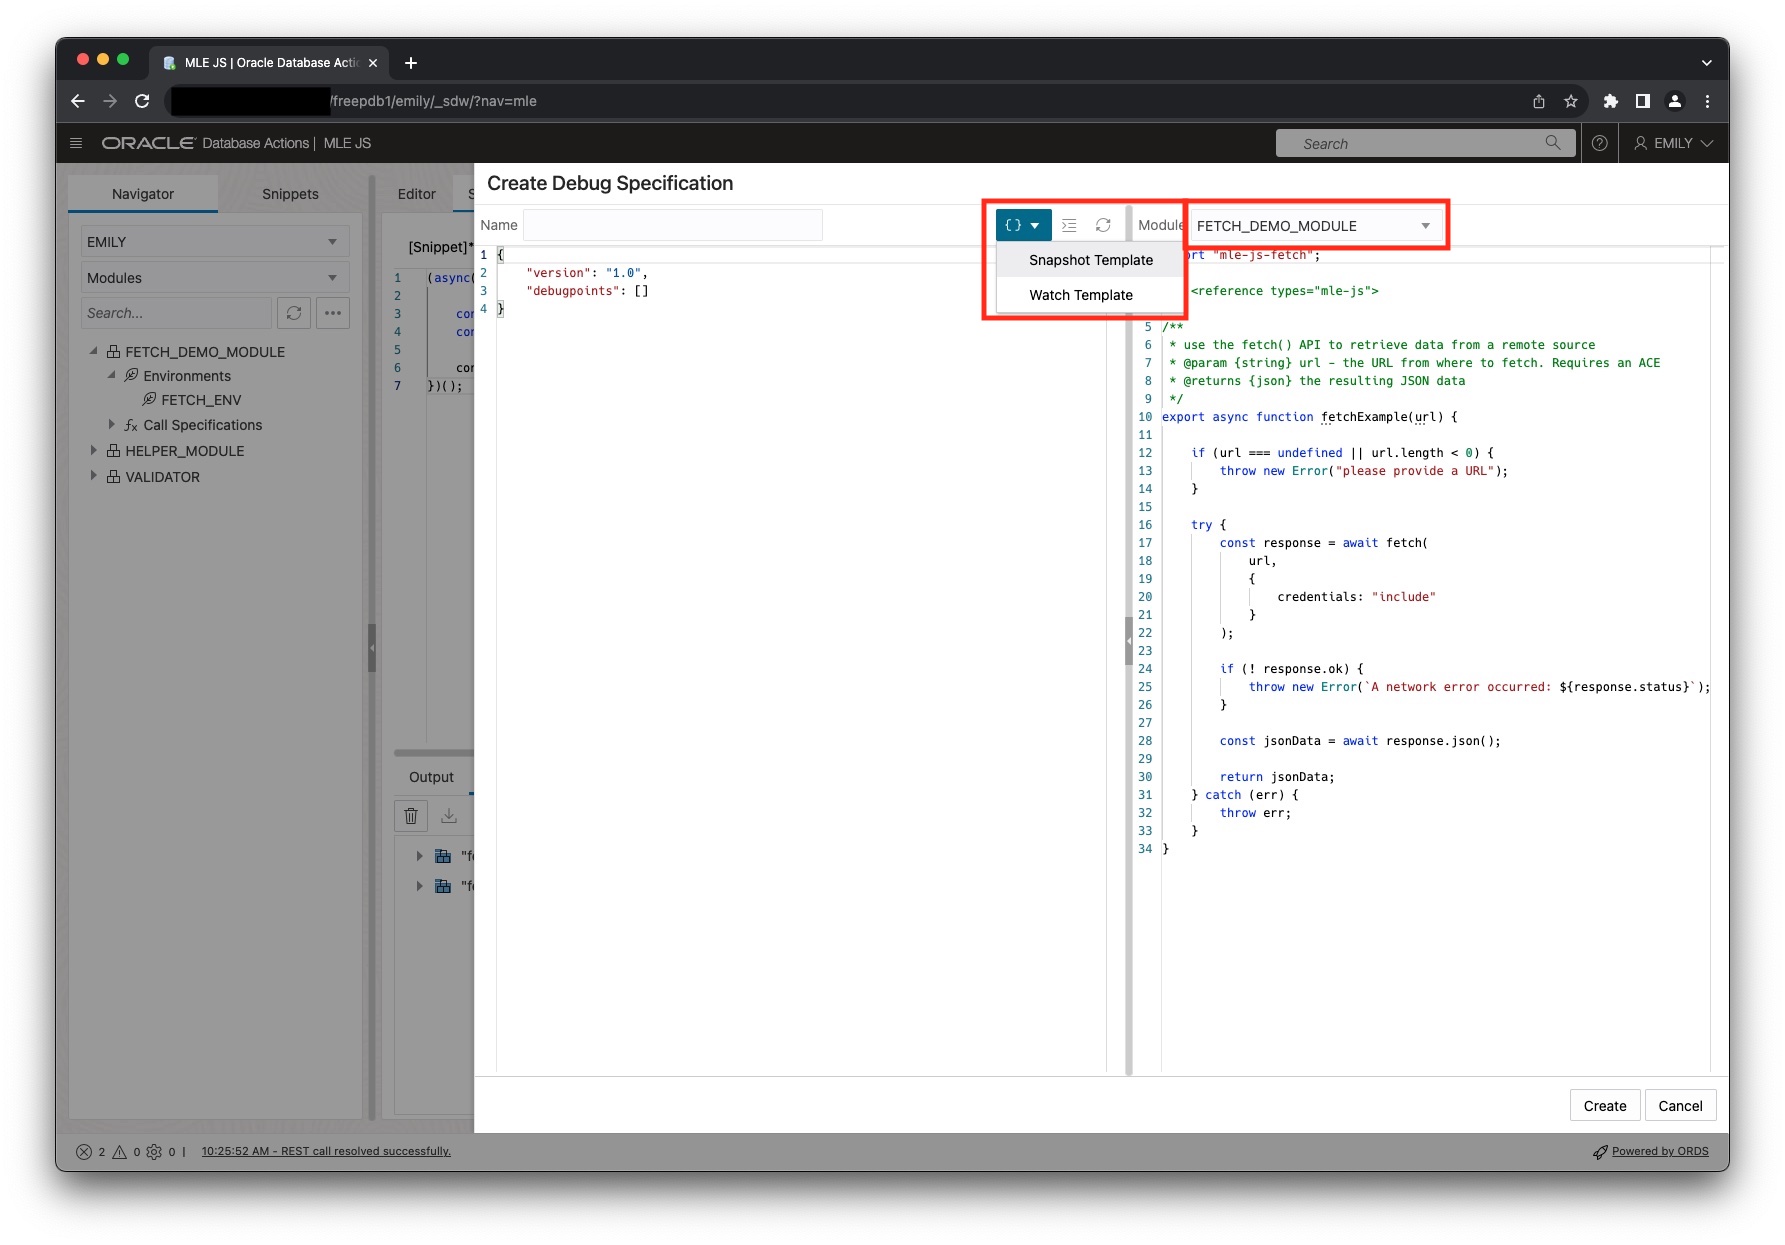
For this example I chose to read
- the URL passed to the function
- the JSON data returned by the
fetch()call
The final debug specification, shown in the figure below, allows me to do just that.
Debugging
All I need to do next is to fetch some JSON from ORDS and record the variables of interest. In this case I’m fetching from the fictitious URL shown in the code example. I don’t even need to print the resulting jsonData to the console, the variable’s content is fetched by the post-execution debug engine. Paste the following code into the editor, then hit the debug icon to initiate the process.
(async() => {

        const { fetchExample } = await import ("fetchDemo");
        const jsonData = await fetchExample("https://1.2.3.4/ords/freepdb1/emily/employees/");

        console.log(`data fetched successfully`);
    })();
The debug console shows the variables inspected by the JavaScript engine. Each time the probe fired it prints the line number along with the recorded data. You can see the output in the following figure:
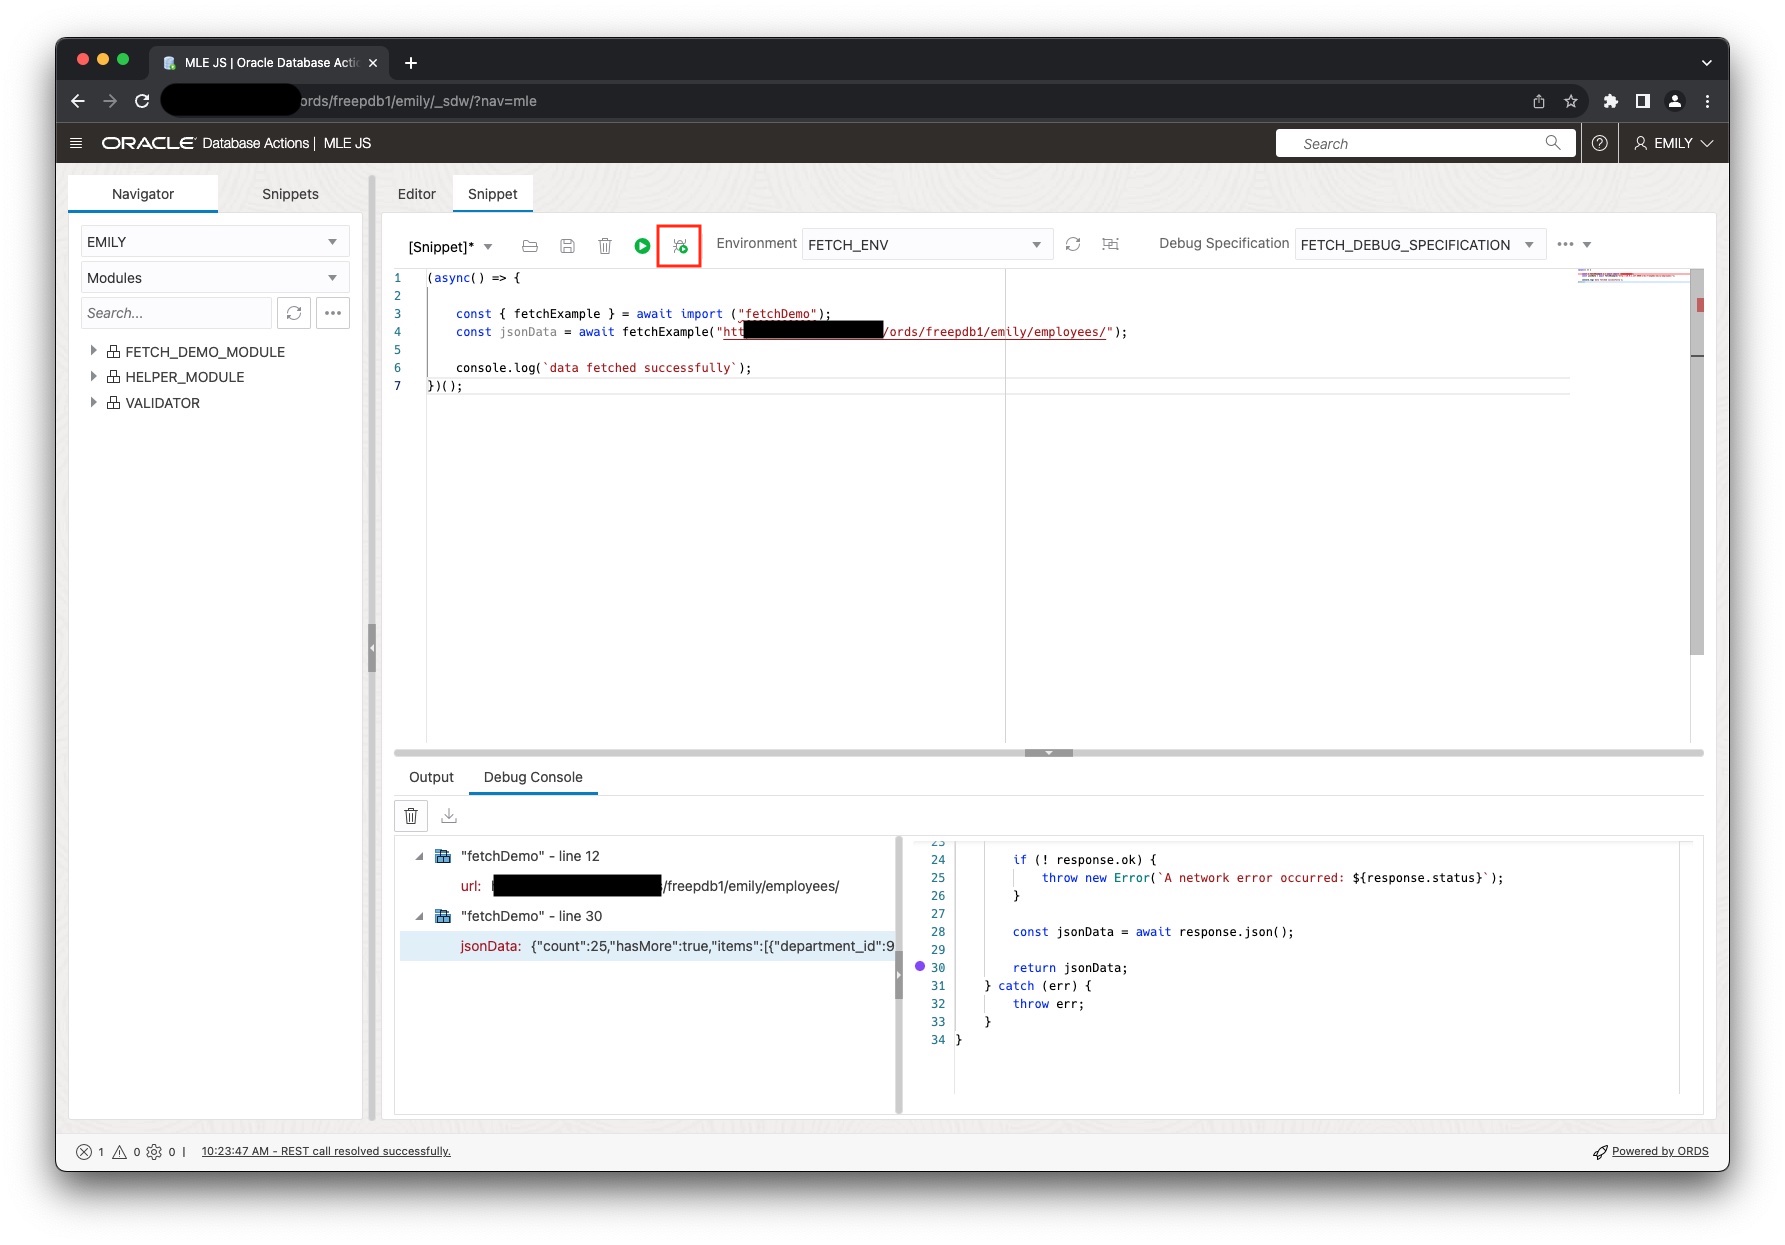
Clicking on the little triangle expands the section and reveals the variable as well as the captured value. Clicking on the variable reveals the code location and provides some extra context.
Debugging using PL/SQL
If your application makes good use of stored code, you might be pleased to hear that it is possible to run your code with debugging enabled as well. Here is a very basic example how to attach the same debug specification used in the GUI to the execution context and record the same information. Rather than it being presented in a GUI, the textual representation has been selected instead.
DECLARE
        l_debugspec JSON;
        l_debugsink BLOB;
        l_debugtext JSON;
        l_js_code   CLOB;
        l_data      JSON;
        -- l_ctx       dbms_mle.context_handle_t;
    BEGIN
        l_debugspec := JSON(q'~
    {
        "version": "1.0",
        "debugpoints": [
            {
                "at": {
                    "name": "FETCH_DEMO_MODULE",
                    "line": 12
                },
                "actions": [
                    {
                        "type": "watch",
                        "id": "url"
                    }
                ]
            },
            {
                "at": {
                    "name": "FETCH_DEMO_MODULE",
                    "line": 30
                },
                "actions": [
                    {
                        "type": "watch",
                        "id": "jsonData"
                    }
                ]
            }
        ]
    }
    ~');

        dbms_lob.createTemporary(l_debugsink, true, dbms_lob.session);
        dbms_mle.enable_debugging(l_debugspec, l_debugsink);

        l_data := fetch_example('https://1.2.3.4:8843/ords/freepdb1/emily/employees/100');
        l_debugtext := dbms_mle.parse_debug_output(l_debugsink);

        dbms_output.put_line('-- debug output: ' ||
            json_serialize(l_debugtext returning clob pretty)
        );

        dbms_mle.disable_debugging();
    EXCEPTION
        when others then
            raise;
    END;
    /
Running the code snippet above will attach the debug specification to the MLE execution context created implicitly. Thanks to the call to DBMS_OUTPUT the resulting debug output will be printed on the screen.
Summary
Multilingual Engine provides a convenient debugging mechanism that can be enabled and disabled on-premises and more importantly, in cloud deployments where network connectivity between a debugger and a database is typically prohibited.