Key Takeaways
- This benchmark compares five semantic-cache modes across
100measured requests per mode and25workload families, using livegpt-4o-minicalls and provider-reported token usage. - Both semantic-cache modes avoided
65LLM calls out of100; exact-cache reuse avoided25. The semantic-cache modes produced the same reuse decisions because they used the same eligibility policy. - In the measured remote-primary topology, eligible Oracle True Cache reads reduced cache-hit lookup latency compared with primary-route semantic lookup: about
10.8 msaverage non-LLM latency versus166.6 ms. - Writes, misses, cache population, and benchmark event recording still flowed through the primary database. Oracle True Cache was measured as a read optimization, not as a write target.
Semantic caching earns its keep when it reduces something you actually pay for: live LLM calls, token usage, wall-clock time, or latency on the read path. The earlier articles in this series proved the mechanics: exact lookup, vector lookup, scoped reuse policy, rejection cases, and True Cache routing. This article measures what happens when we run that pattern under a larger live workload and compare five modes side by side.
The important change is topology. A same-host setup is excellent for proving route selection and correctness, but it compresses the network distance that Oracle True Cache is meant to reduce. For this benchmark, the application and Oracle True Cache ran together on a Phoenix host, while the primary Oracle AI Database 26ai instance ran in Ashburn.
That gives the cache tier a real job. Repeated TCP connect-time probes from the Phoenix benchmark host to the Ashburn primary listener averaged about 52.0 ms, with a 52.1 ms median and a 52.4 ms p95 across 20 samples. That is enough separation to make the read route meaningful without manufacturing an unrealistic deployment.
This is still one benchmark harness, one workload mix, one concurrency setting, one provider model, and one application shape. Treat the numbers as measured evidence for this topology, not as a universal production performance claim.
Remote-Primary Benchmark Topology
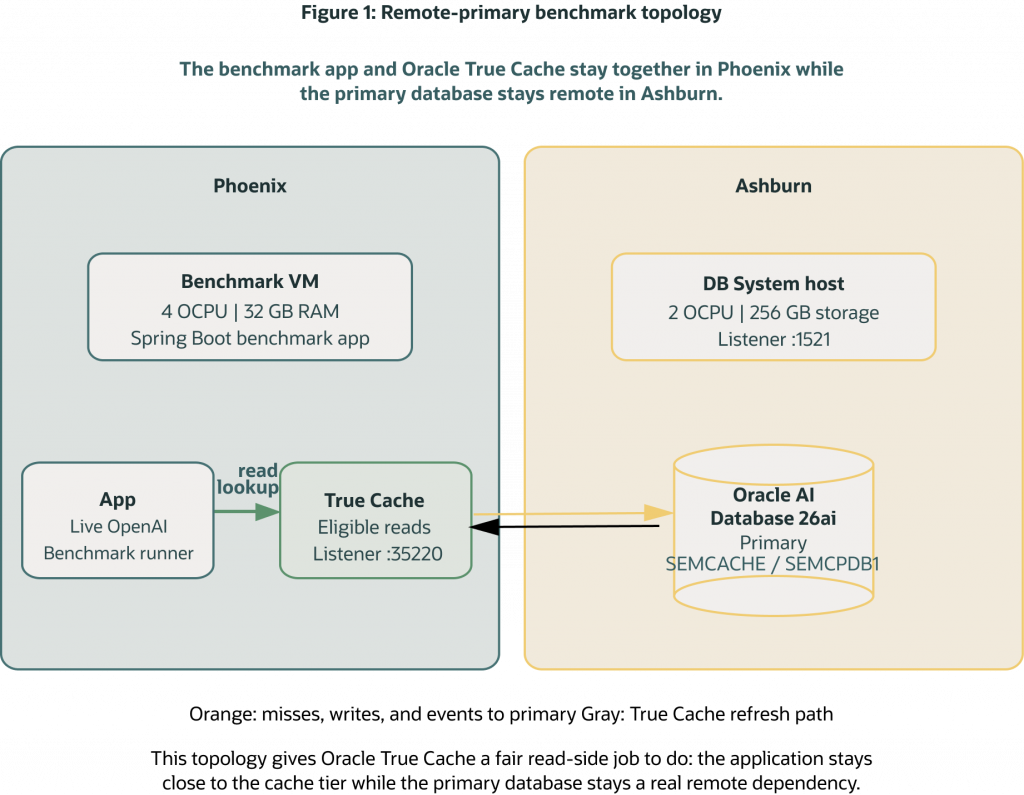
Figure 1. The benchmark host and Oracle True Cache run together in Phoenix while the primary Oracle AI Database 26ai instance runs in Ashburn. That preserves a realistic network gap between the read cache tier and the primary database.
The measured run used the public demo repository at commit e5ec761. The Spring Boot benchmark harness and Oracle True Cache ran on the Phoenix host. The primary Oracle AI Database 26ai instance ran in Ashburn. Live OpenAI calls supplied LLM latency and token accounting, while the benchmark code recorded route, decision, and latency evidence per request.
This placement is closer to how you would usually design an application that depends on a read cache. Keep the application close to the cache tier, keep writes and authoritative state on the primary, and use the cache to shield read-heavy traffic from a more distant database route where configured.
What the Benchmark Measures
The benchmark compares five modes against the same labeled workload. The point is not just to ask “is caching faster?” It is to separate exact reuse, semantic reuse, read routing, LLM calls, and cache-population cost.
no-cache is the baseline. It performs no cache lookup, every request calls the live LLM, and it writes nothing reusable.
exact-cache performs an exact key lookup first. Exact hits avoid the LLM. Misses call the LLM and write reusable cache state through the primary database.
semantic-cache-primary performs exact lookup plus vector search against the primary database route. Approved exact and semantic hits avoid the LLM. Misses and near misses call the LLM and write through the primary.
semantic-cache-true-cache performs the same exact and semantic lookup logic, but eligible read-only vector search uses Oracle True Cache. Approved exact and semantic hits avoid the LLM. Misses and near misses still call the LLM and write through the primary.
semantic-cache-write-through calls the LLM for every measured request and writes through to the primary. It measures ingestion and write-path cost, not read reuse. In this mode, the benchmark intentionally runs without reusing entries written during the same measured mode, so the decision count is pure miss-path evidence.
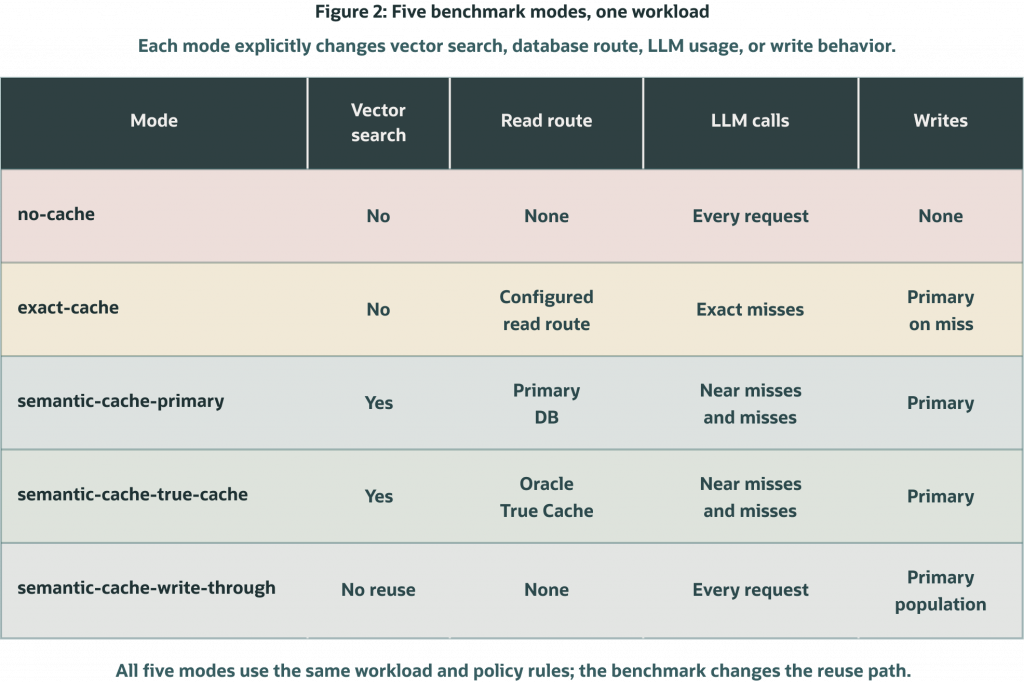
Figure 2. The five modes keep the workload fixed while changing whether vector search runs, which database route is used, and when the live LLM is called.
The harness records one event row per measured request. Those rows include the mode, reuse decision, database route, raw provider_calls event count for live LLM invocations, request latency, LLM latency, non-LLM latency, token counts from OpenAI response usage fields, and estimated cost from the configured per-million-token prices.
For this live run, the benchmark used a 60 s OpenAI request timeout, up to 2 retries after the first attempt, and a 1500 ms retry backoff. That keeps transient service delays visible in the results instead of hiding them from the measurement.
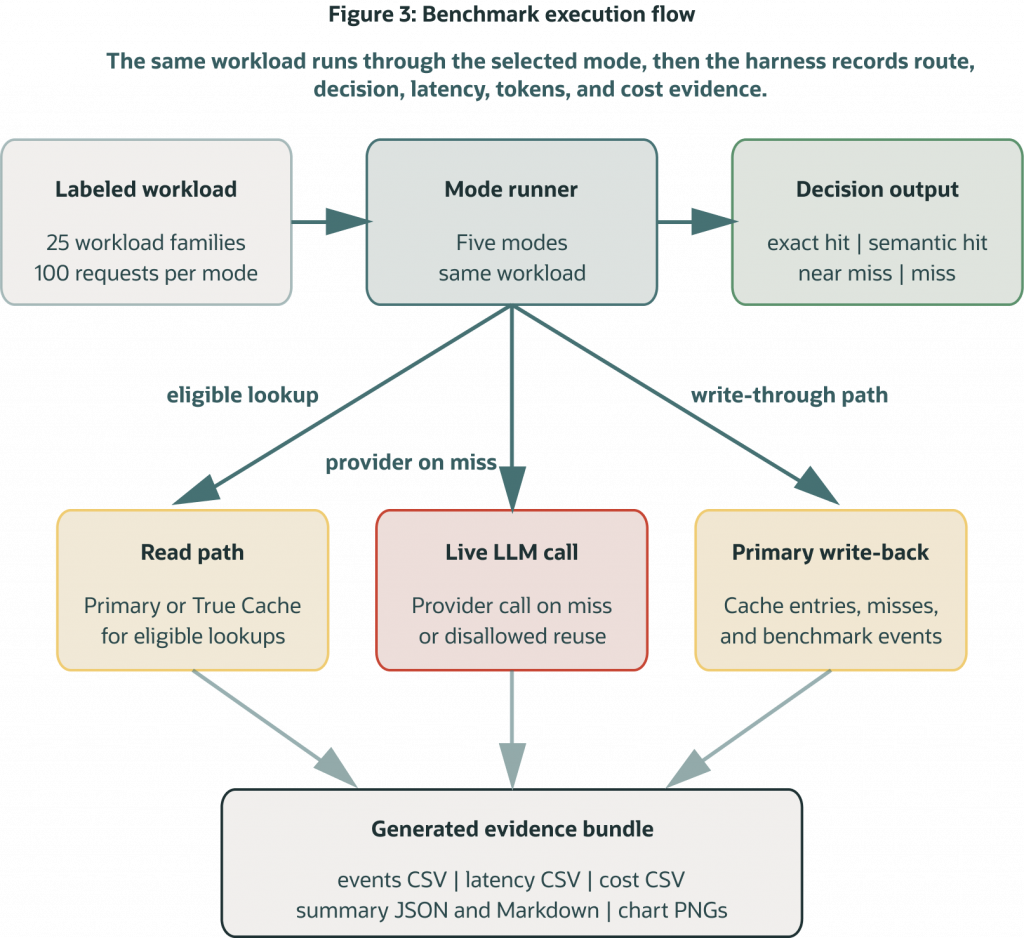
Figure 3. The benchmark runner sends the same workload through each mode and records LLM usage, decisions, database route, latency, tokens, and estimated cost.
Exact Deployment Used for the Measured Run
Before looking at timings, it helps to be explicit about the infrastructure. The measured run used a two-region OCI layout with the application and Oracle True Cache placed together in Phoenix, and the primary Oracle AI Database 26ai instance placed in Ashburn.
| Component | Placement | Configuration used |
|---|---|---|
| Spring Boot benchmark app | OCI us-phoenix-1 | Ran on the benchmark VM, side by side with Oracle True Cache |
| Oracle True Cache | OCI us-phoenix-1 | Ran locally on the same Phoenix benchmark VM as the application so eligible cache reads stayed close to the app tier |
| Benchmark VM | Phoenix public subnet 10.74.10.0/24 inside VCN 10.74.0.0/16 | VM.Standard.E4.Flex, 4 OCPU, 32 GB RAM, 150 GB boot volume |
| Primary Oracle AI Database | OCI us-ashburn-1 | One-node DB System primary, Oracle AI Database 26ai build 23.26.2.0.0 |
| Primary DB System shape | Ashburn public subnet 10.64.10.0/24 inside VCN 10.64.0.0/16 | VM.Standard.E4.Flex, 2 OCPU, 256 GB storage |
| Database identifiers | Ashburn primary | CDB SEMCACHE, PDB SEMCPDB1, unique name SEMCACHE_ASH |
| Application-to-primary path | Phoenix to Ashburn | JDBC traffic to listener port 1521 |
| True Cache refresh path | Ashburn to Phoenix | Oracle True Cache service traffic to listener port 35220 |
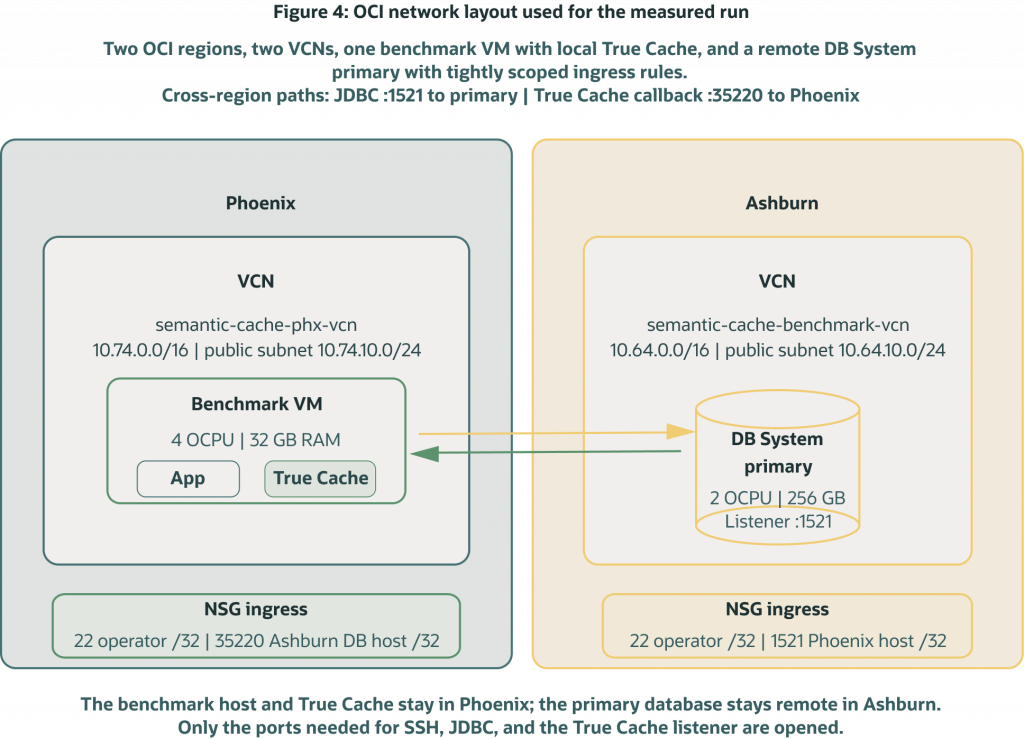
Figure 4. The measured run used two OCI regions, separate VCNs and public subnets, a Phoenix benchmark VM that hosted both the application and Oracle True Cache, and an Ashburn DB System primary. Only the ports needed for operator SSH, JDBC traffic, and True Cache service traffic were opened.
The network controls were intentionally narrow. The Phoenix benchmark VM lived in VCN semantic-cache-phx-vcn with CIDR 10.74.0.0/16 and public subnet semantic-cache-phx-public with CIDR 10.74.10.0/24. The Ashburn primary database lived in VCN semantic-cache-benchmark-vcn with CIDR 10.64.0.0/16 and public subnet semantic-cache-benchmark-public with CIDR 10.64.10.0/24.
The DB System network security group allowed SSH on port 22 and SQL*Net traffic on port 1521 only from the operator allowlist and the benchmark host /32. The benchmark host network security group allowed SSH on port 22 from the operator allowlist and Oracle True Cache listener traffic on port 35220 from the Ashburn database host. The True Cache instance was in read-only apply mode, so it could serve eligible reads while primary writes remained authoritative.
That layout is why the measured results are more useful than the earlier same-host checks. The application stayed close to Oracle True Cache, while the primary database remained a real remote dependency across OCI regions.
Configuration Used for the Measured Run
The benchmark configuration was intentionally small enough to inspect but large enough to show reuse behavior across multiple workload families.
| Setting | Value |
|---|---|
| Requests per mode | 100 |
| Workload families | 25 |
| Prewarm entries per measured cache mode | 26 |
| Concurrency | 1 |
| Provider mode | openai |
| OpenAI model | gpt-4o-mini |
| OpenAI request timeout | 60 s |
| OpenAI retries after first request | 2 |
| Retry backoff | 1500 ms |
| Token source | OpenAI Responses API usage fields |
| Input cost per million tokens | $0.15 |
| Output cost per million tokens | $0.60 |
| Prewarm visibility pause | 3000 ms |
| Benchmark seed | 260612 |
Before each measured cache mode, the harness seeded one cache entry per workload family and waited for the configured prewarm pause. That means the cache-oriented modes started warm instead of hiding prewarm cost inside the measured interval.
The prewarm count is 26 rather than 25 because one mismatch-oriented workload family pre-seeds both the primary scope and the alternate mismatch scope used by that scenario. That keeps the scoped-reuse checks explicit in the event stream instead of relying on an accidental cold miss.
The benchmark used concurrency 1 for this result set. That makes database route evidence and latency accounting easier to interpret while the benchmark is focused on semantic-cache behavior rather than load-test saturation.
Database Route Evidence
Avoided LLM calls alone do not prove that Oracle True Cache handled the intended read path. The benchmark also checked route visibility and recorded the route used for each measured request.
| Evidence item | Measured value |
|---|---|
| Primary route objects visible | 2 |
| True Cache route objects visible | 2 |
| True Cache vector distance check | approximately 0.0 |
The per-request event stream recorded route counts by mode:
| Mode | Primary route events | True Cache route events | No database route |
|---|---|---|---|
no-cache | 0 | 0 | 100 |
exact-cache | 25 | 75 | 0 |
semantic-cache-primary | 100 | 0 | 0 |
semantic-cache-true-cache | 25 | 75 | 0 |
semantic-cache-write-through | 100 | 0 | 0 |
Those route counts are important. The semantic-cache-true-cache mode routed eligible read-only lookup traffic through True Cache, while misses, writes, and benchmark event recording continued to use the primary database.
The exact-cache split is also expected. In this harness, prompt-hash lookups use the configured read route, so exact-hit reads can show up on the True Cache side. Requests that miss still flow to the primary database for fresh generation and write-back.
Results by Mode
The first result set compares wall-clock time, throughput, and latency percentiles. These are end-to-end request measurements, so modes that call the live LLM more often naturally include more provider-side variance.
| Mode | Requests | Wall clock | Requests/sec | p50 | p95 | p99 |
|---|---|---|---|---|---|---|
no-cache | 100 | 142365 ms | 0.70 | 1225 ms | 2080 ms | 5175 ms |
exact-cache | 100 | 112402 ms | 0.89 | 1188 ms | 2082 ms | 2826 ms |
semantic-cache-primary | 100 | 78623 ms | 1.27 | 207 ms | 2101 ms | 3736 ms |
semantic-cache-true-cache | 100 | 59949 ms | 1.67 | 1 ms | 1934 ms | 2957 ms |
semantic-cache-write-through | 100 | 193647 ms | 0.52 | 1580 ms | 3460 ms | 6796 ms |
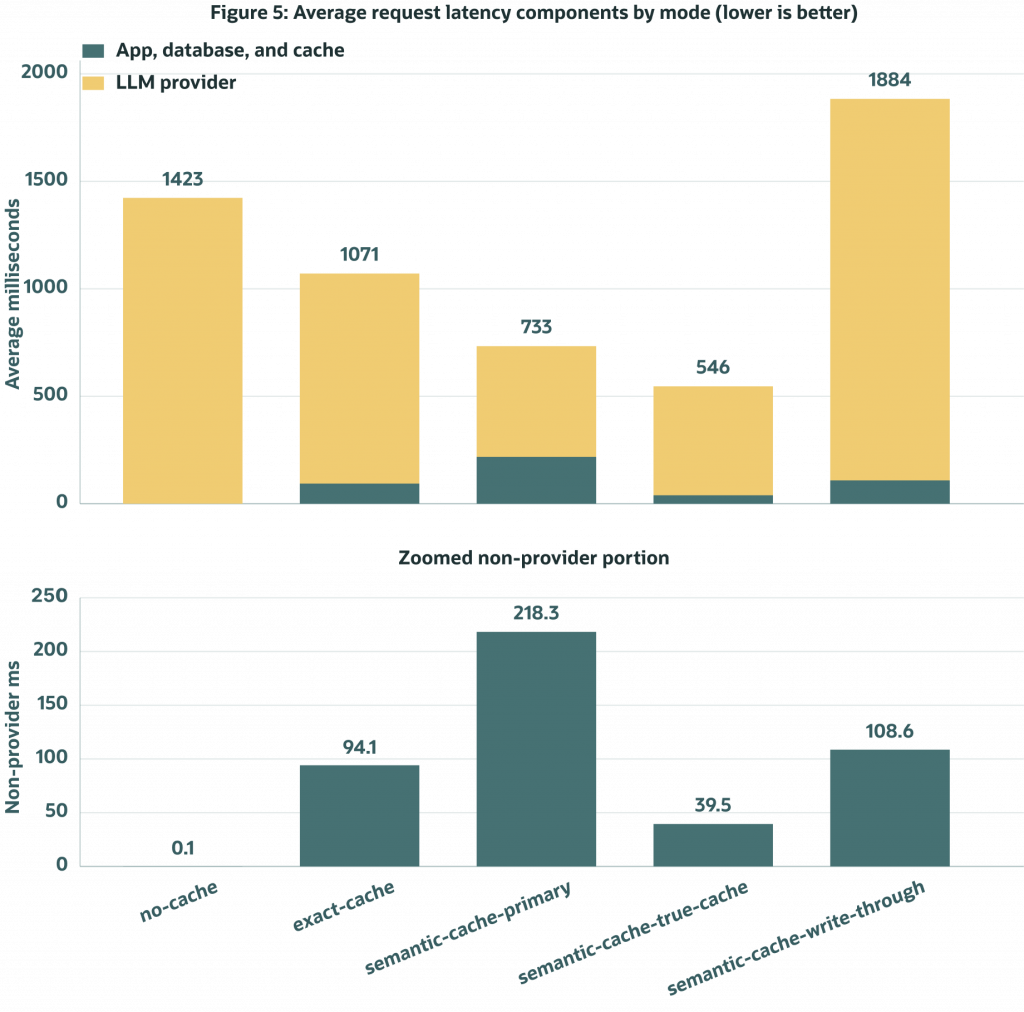
Figure 5. End-to-end latency split into LLM time and non-LLM time. Live LLM variance still dominates the top-line bars, which is why the cache-hit view below is essential.
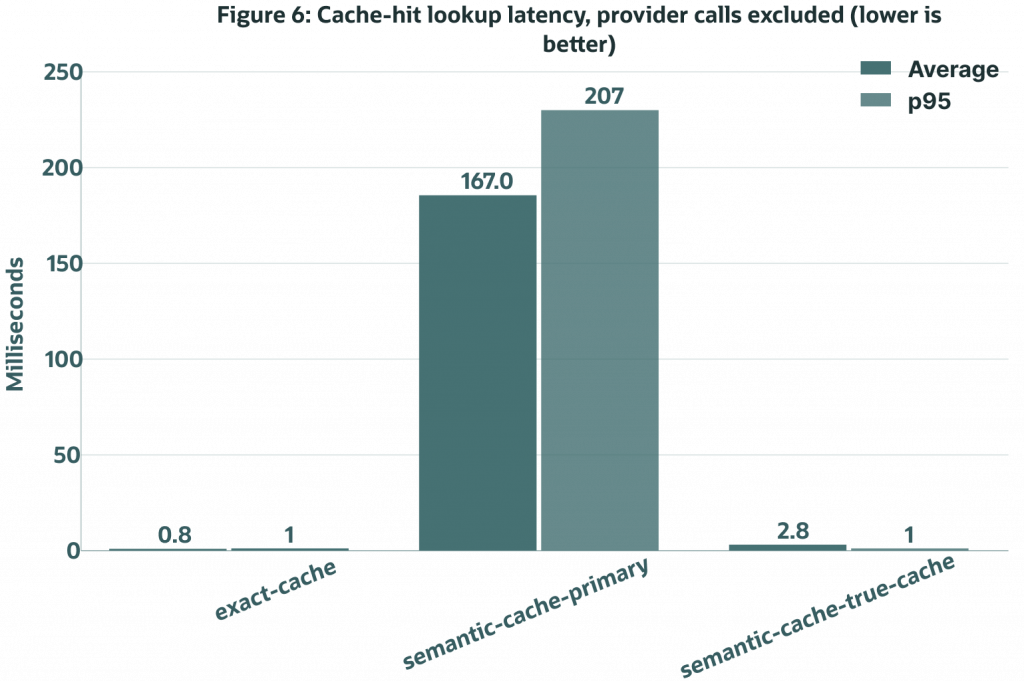
Figure 6. LLM-free cache-hit lookup latency. In this remote-primary topology, the eligible True Cache read path is materially faster than the primary semantic lookup path.
The wall-clock table already shows the main pattern. semantic-cache-true-cache finished the 100-request mode in 59.9 s, faster than 78.6 s for semantic-cache-primary, 112.4 s for exact-cache, and 142.4 s for no-cache. The write-through mode was the slowest at 193.6 s because it intentionally exercised live generation plus primary write-through work for every measured request.
The cache-hit-only chart is the cleaner read-route signal because it removes live LLM time from the comparison. In this topology, semantic-cache-primary cache hits averaged about 166.6 ms of non-LLM latency, while semantic-cache-true-cache cache hits averaged about 10.8 ms. Exact prompt-hash hits stayed near 1 ms, which is expected because they avoid vector search work entirely.
That also explains the striking 1 ms p50 for semantic-cache-true-cache: 65 of the 100 requests were cache hits, so the median lands in the fast hit path, while the 35 live LLM calls pull the p95 and p99 upward.
That is the strongest performance signal in the run. Once the application and cache are kept together and the primary has a real network hop, Oracle True Cache shows measurable read-path value instead of tying the primary route the way it can in a same-host setup.
Mode-to-mode wall-clock comparisons still need a little care. The modes ran sequentially rather than in lockstep, and live LLM latency can vary during a run. That is why this article separates three views: end-to-end wall-clock time, cache-hit lookup latency with LLM time removed, and LLM-call reduction.
LLM Calls, Tokens, and Estimated Cost
The semantic-cache modes avoided the same number of live LLM calls because they used the same reuse policy. The difference between them is route placement, not hit-rate logic.
| Mode | LLM calls made | LLM calls avoided | Total tokens | Estimated cost |
|---|---|---|---|---|
no-cache | 100 | 0 | 8585 | $0.001964 |
exact-cache | 75 | 25 | 6544 | $0.001536 |
semantic-cache-primary | 35 | 65 | 3192 | $0.000780 |
semantic-cache-true-cache | 35 | 65 | 3184 | $0.000775 |
semantic-cache-write-through | 100 | 0 | 10129 | $0.002940 |
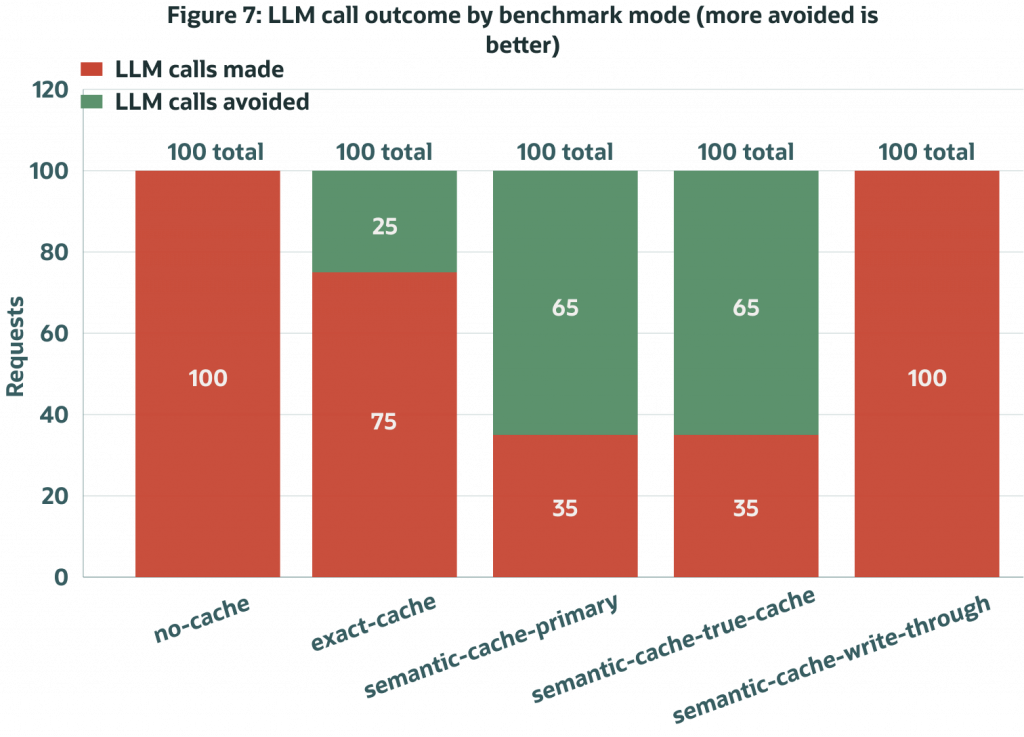
Figure 7. LLM calls made by benchmark mode. The two semantic-cache modes avoid the same number of live LLM calls because they share the same reuse decisions.
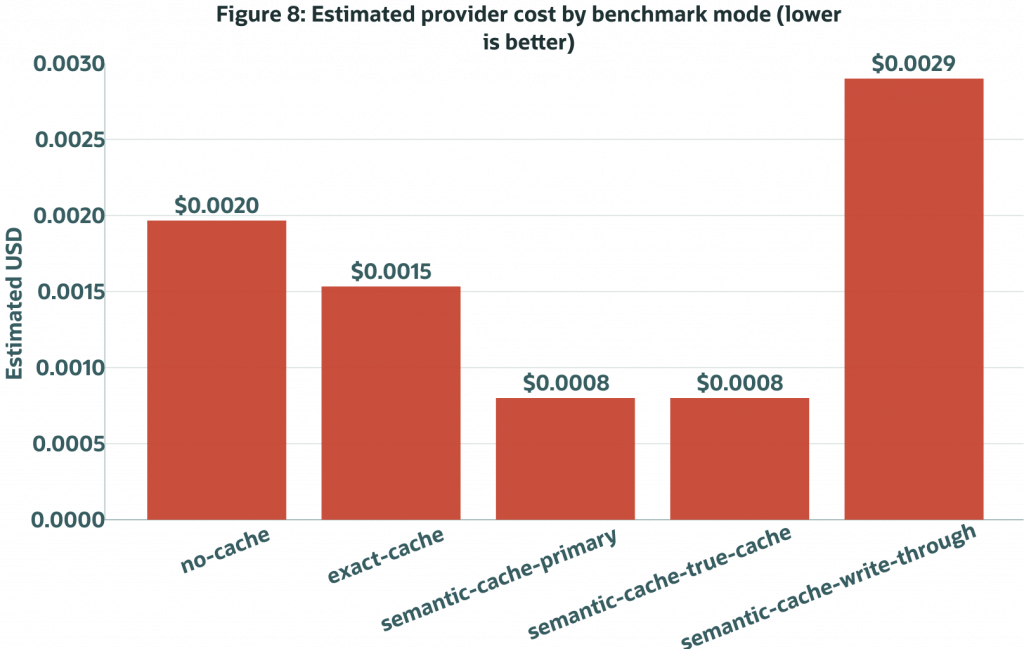
Figure 8. Estimated provider cost by benchmark mode using OpenAI-reported token counts and the benchmark’s configured per-million-token prices.
Both semantic-cache modes avoided 65 LLM calls out of 100, cutting estimated cost from $0.001964 in no-cache to about $0.00078 for this measured workload. Exact-cache reuse avoided 25 calls because only exact repeats qualified. Write-through mode called the LLM for every measured request because it intentionally exercises the miss-and-write path.
The cost values are estimates from benchmark token counts and configured pricing inputs. They are useful for comparing modes under the same assumptions, not as a claim about an invoice or a universal cost-saving percentage.
Decision Counts
A single hit-rate number can hide too much. Decision counts show whether the benchmark is approving reuse selectively or rubber-stamping every similar prompt.
| Mode | Decision counts |
|---|---|
no-cache | provider-call=100 |
exact-cache | exact-hit=25, near-miss=50, miss=25 |
semantic-cache-primary | exact-hit=25, semantic-hit=40, near-miss=10, miss=25 |
semantic-cache-true-cache | exact-hit=25, semantic-hit=40, near-miss=10, miss=25 |
semantic-cache-write-through | miss=100 |
In exact-cache mode, near-miss means the harness found a vector candidate but did not serve it because semantic reuse was disabled for that mode. The benchmark still records that candidate information so the exact-only mode can be compared with the semantic modes using the same workload.
The semantic-hit=40 rows are the interesting wins. The prompt is not an exact repeat, but the scoped vector candidate is close enough and policy-compatible enough to reuse safely. The near-miss and miss rows matter just as much because they show that semantic similarity alone is not treated as automatic approval.
The write-through mode’s miss=100 count is deliberate. It isolates fresh generation plus cache population, so it does not pre-seed reusable entries or reuse entries written earlier in the same measured mode. That makes it a write-path comparison point rather than a cache-hit mode.
Interpreting the Results
This benchmark answers a few concrete questions well.
Did semantic caching reduce live LLM traffic? Yes. Both semantic-cache modes avoided 65 live LLM calls out of 100.
Did Oracle True Cache handle the intended eligible read path? Yes. Route evidence shows True Cache events for eligible read lookups, while misses and writes continued to use the primary.
Did the remote-primary topology reveal a measurable read-path difference between the primary lookup route and the True Cache lookup route? Yes. The cache-hit lookup view shows a clear non-LLM latency gap between primary-route semantic lookup and eligible True Cache lookup.
Did the benchmark keep token and cost accounting tied to provider-reported usage for live calls? Yes. The token counts come from OpenAI Responses API usage fields, and estimated costs use the benchmark’s configured per-million-token prices.
It does not answer every production question. You would still want to rerun the same harness with your own prompts, tenant boundaries, concurrency targets, retry policy, model choice, regional layout, and cost assumptions. You would also want to inspect the reuse decisions, not just the aggregate numbers, because a semantic cache is only useful when it avoids work without crossing policy boundaries.
Even with those limits, this is a more defensible performance story than a same-host comparison. In a same-host layout, the primary and cache tiers are so close together that Oracle True Cache has little route-level advantage to show. In this Phoenix-and-Ashburn layout, the cache tier stays close to the application while the primary remains a real inter-region dependency, and the measured workload reflects that difference.