Overview: Focusing on observability and monitoring of multiple ADB instances
This is the third post on observability and management services for Autonomous Database Serverless. In the first post, I outlined the different observability and management personas and provided a list of the tools and services available to monitor ADBs – see here. In the second post, I focused on observability and monitoring of a single ADB instance.
In this post, I will focus on observability and monitoring a fleet of ADB instances. Typically, fleet management is assigned to a “fleet-level” persona rather than simply being an extension of the Cloud Administrator and Database Engineer roles. Of course, the Cloud Administrator and Database Engineer personas can also take on this task of fleet-level management.
A Fleet Administrator has a cloud account that allows them to sign in to their corporate tenancy and to manage the complete lifecycle of all the ADB instance(s) using the cloud console (OCI console, Azure console, or Google Cloud console). There is no need for the Fleet Administrator to have database logins for each ADB instance across their fleet. The Fleet Administrator has access to the same tools and services as the Cloud Administrator but, typically, also has a “next-level-up” view across an estate of ADB instances – which can even be a mix of different types of ADB instances: data warehousing, OLTP, JSON Document databases, and APEX instances.
Typical OCI services used by a Fleet Administrator include:
- Autonomous Database – Overview.
- Database Management – database performance monitoring and management features.
- Ops Insights – capacity planning and forecasting.
- Enterprise Manager 13c – a complete, integrated, and business-driven enterprise cloud management solution, which is available via the OCI Marketplace.
- Cloud Advisor – provides recommendations to help you maximize cost savings and improve security in your tenancy.
I will explain how to use the above tools and services to help manage the most common fleet management tasks.
Public vs. Private endpoints
Network configuration settings are one aspect of ADB fleet management that differs entirely from the typical single-instance deployment. With large enterprise fleets, it is doubtful that an ADB instance will be configured to use a public endpoint. Most fleet administrators will insist on using private endpoints to manage access and provide an additional layer of security. Please note that the two critical management services on OCI (Database Management service and Ops Insights) provide reduced monitoring levels for ADB instances that use public endpoints. The Private Endpoint is used to create a non-public connection from an ADB instance to the Database Management service to allow for collection of database metrics and a private connection for running administration tasks. The ADB itself can be located anywhere within OCI, and the endpoint is for connection only.
You must configure your ADB instances to use private endpoints to get the most from the OCI monitoring services.
Can I get a quick overview of all my ADB instances
Yes, with a few caveats. A breadcrumb trail in the top left of the ADB console page will navigate you to an overview page for all your deployed ADB instances. This is available for instances configured on both public and private endpoints.
The OCI Overview console provides a quick overview of all your Autonomous Databases within a specific region and a particular compartment. The following screenshot shows my list of ADB instances in the London Data Center managed within my ADW_Frankfurt compartment (What is a compartment?). As you can see from the screenshot, I have one data warehouse instance, one transaction processing instance, and two APEX instances.
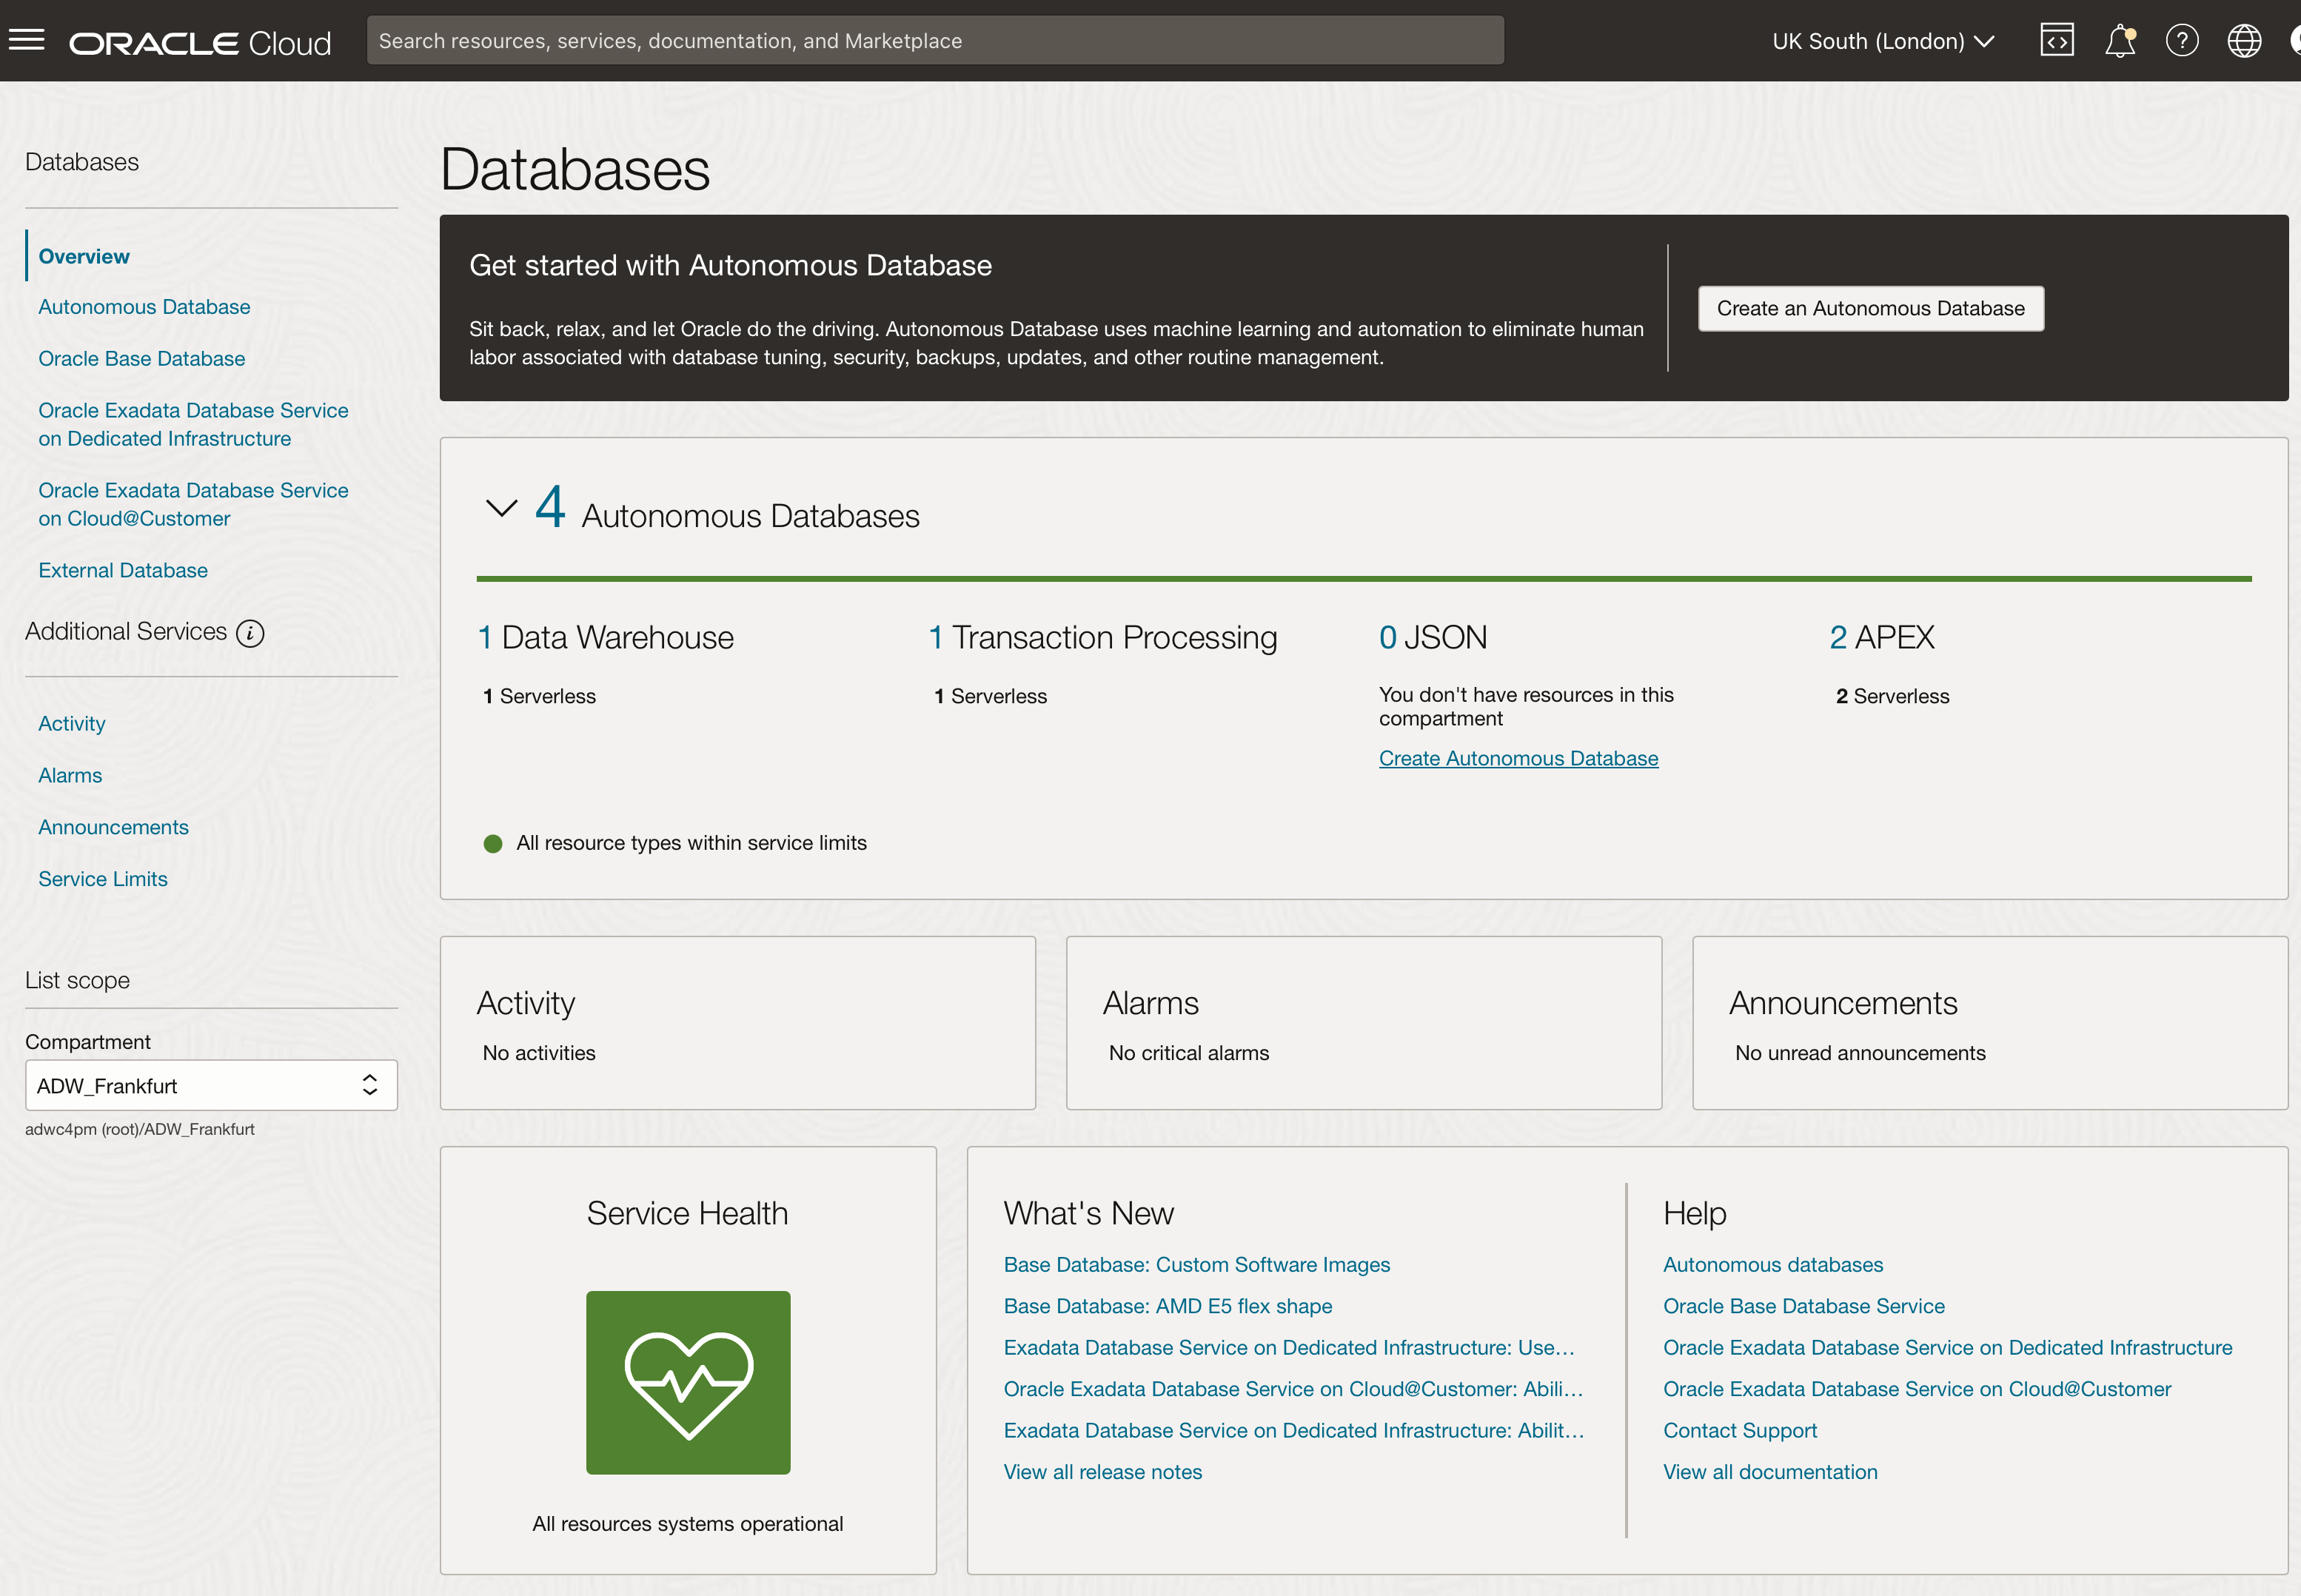
The console shows no alarms have been triggered, no new announcements, and no failed/stalled activities. The overall status of my services is good, as indicated by the green box with the text “All resources systems operational.”
So what are the caveats?
The challenge with the Overview page for a fleet administrator is that you need to click through all the data centers where you have deployed ADB instances. Then, you need to scroll through your compartments for each data center. You can’t get a consolidated view across all your data centers and compartments. Or can you?
How can I get a more consolidated view of all my ADB instances?
The Database Management service can allow you to see ADB instances across different data centers and compartments.
The service is an easy-to-use service that provides advanced monitoring and management of ADB resources, delivering enhanced insights and ensuring optimal performance for applications running on the Autonomous Database. This monitoring is broken down into the following categories:
In-depth application performance details
- Database fleet monitoring overview
- Performance Hub
- AWR Explorer
- AWR and ADDM reports
- SQL Monitoring
- SQL performance tuning
- New performance metrics
Administration tasks and details
- Storage administration
- User administration
- Parameter configuration
- Database jobs
A registration process must be followed, allowing you to select which ADB instances you want managed by the Database Management service. Fortunately, the registration process is very straightforward.
How do I register a database with the Database Management service?
There are two ways to manage the registration process.
Option 1 via the ADB console:
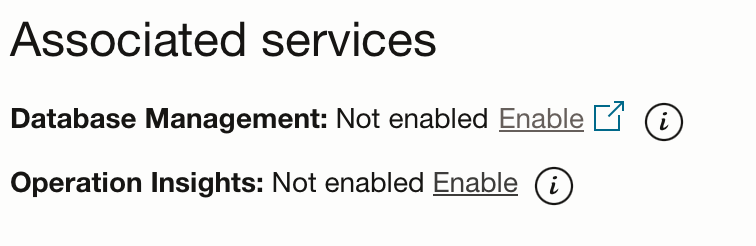
The detailed console page for each Autonomous Database has a section headed “Associated Services.” The first service in the list is Database Management. To register a database, click the “Enable” link and complete the on-screen registration form.
If required, the registration process can be fully automated as part of a Terraform script.
Option 2 – via the Database Management console.
Alternatively, you can add databases to the Database Management service via the Administration section of the Database Management service console, where there is an ‘enable’ button. The button will pop up in the same form as shown on the ADB Console.
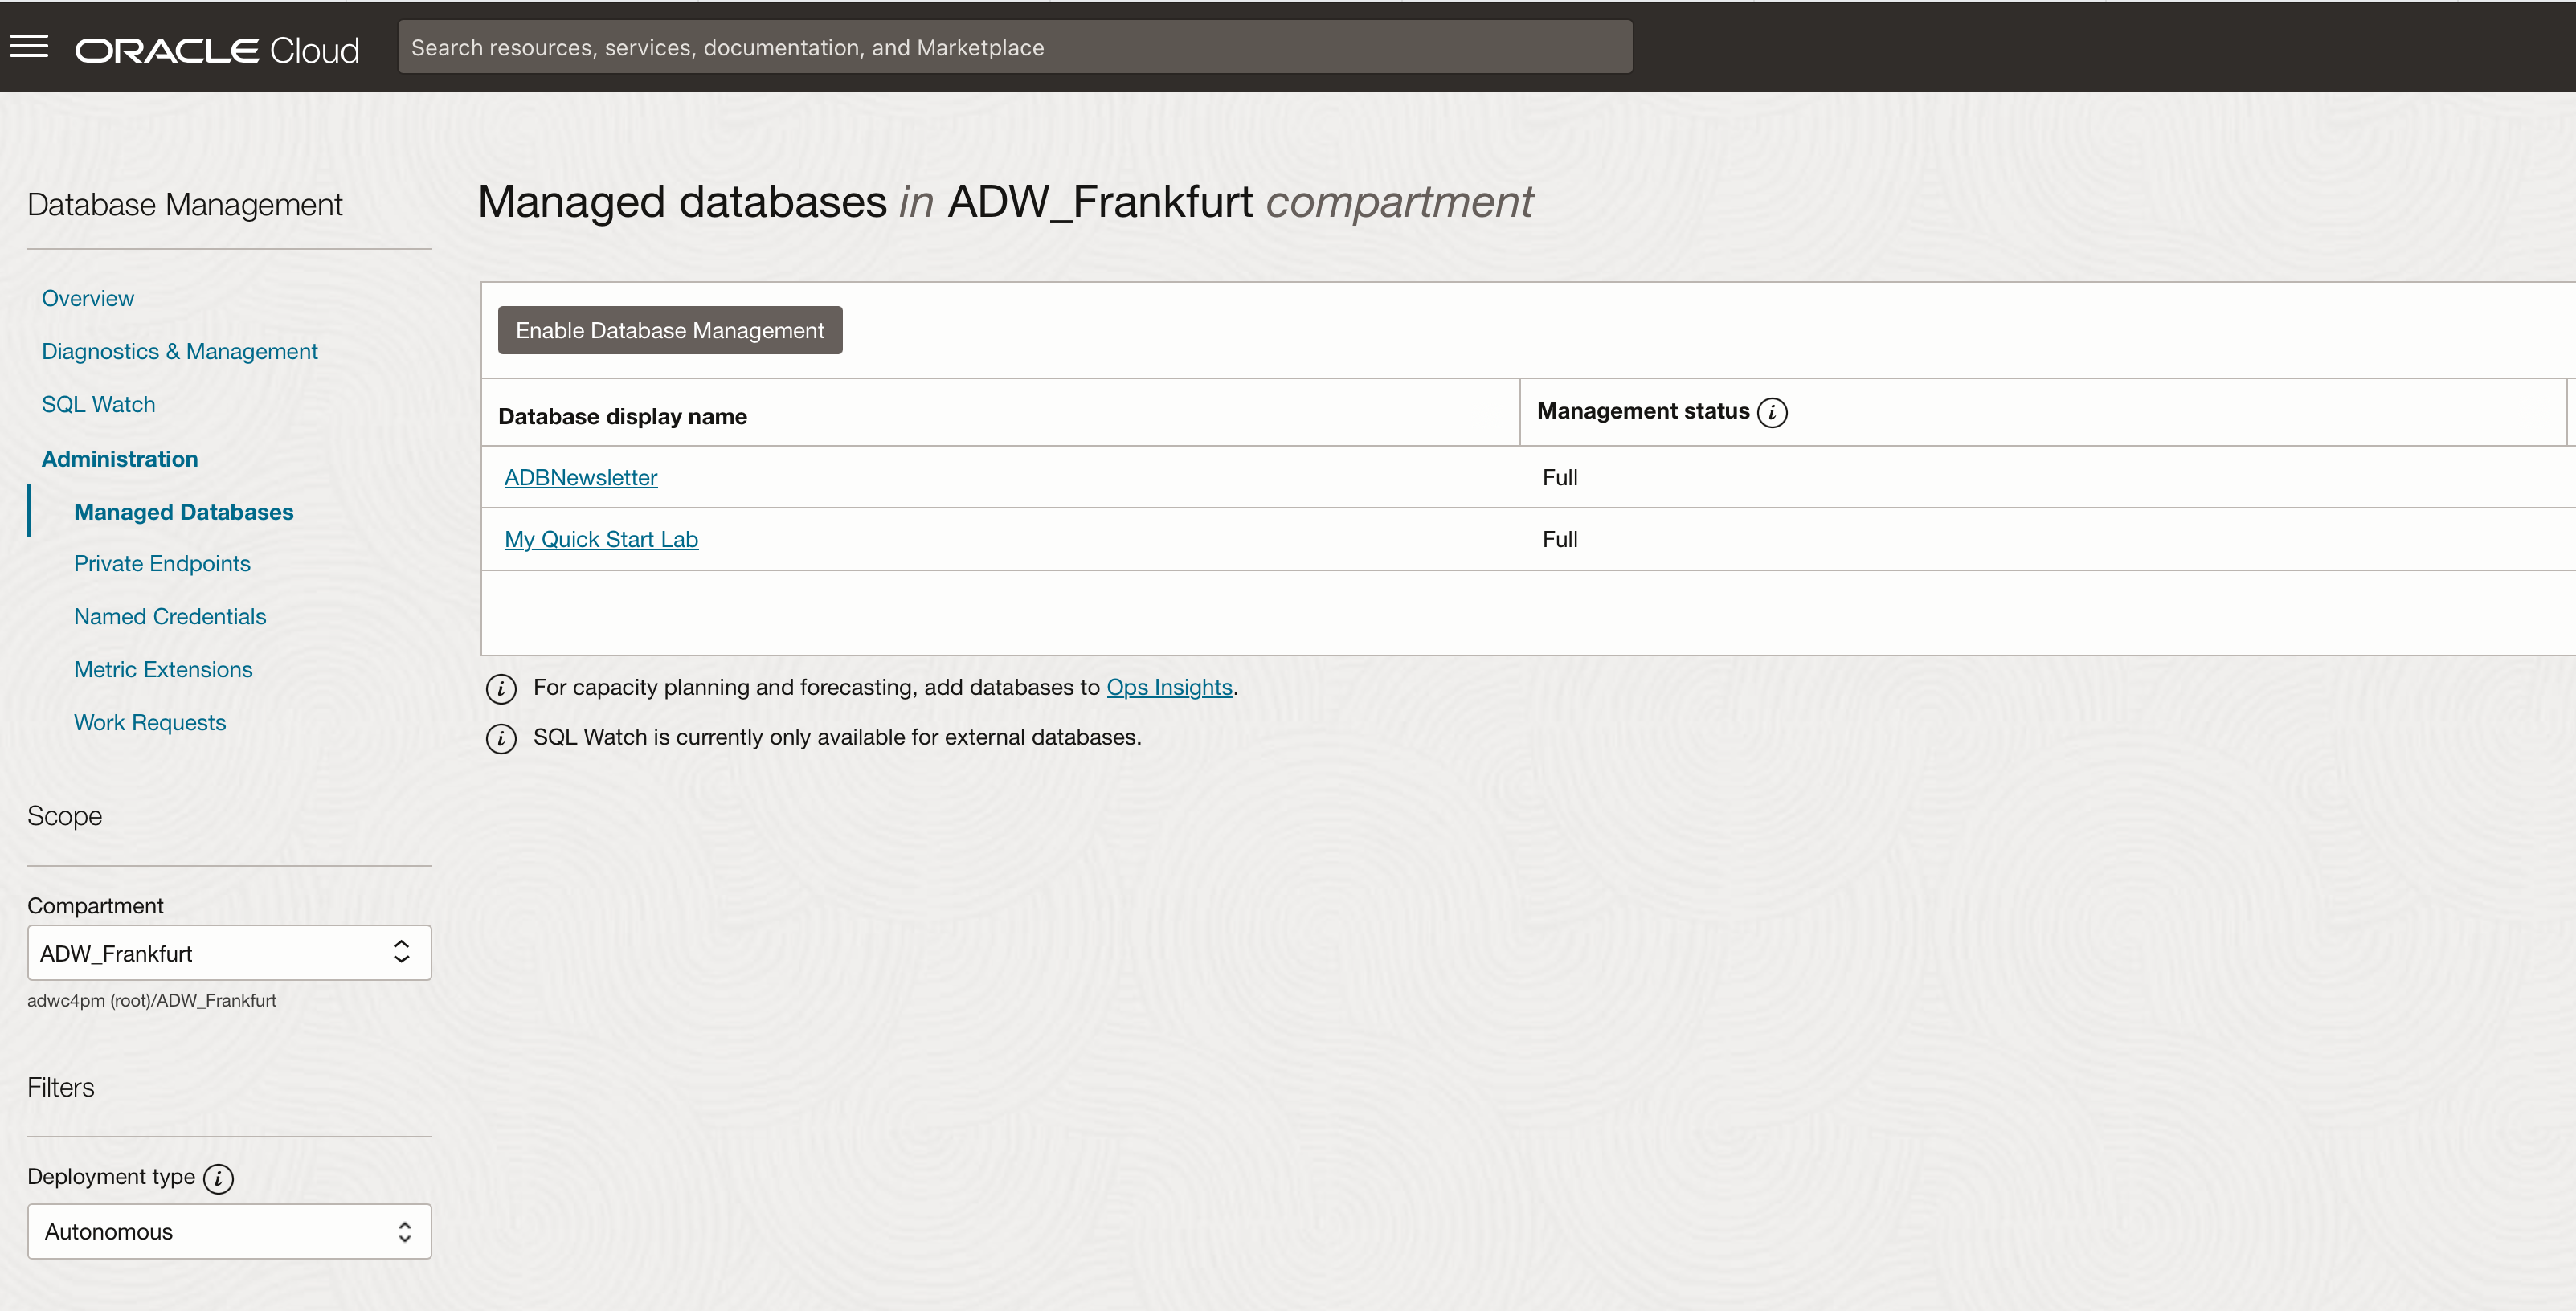
Once a database has been registered, it will appear in the list of databases below the ‘enable’ button.
Can I organize my list of registered databases?
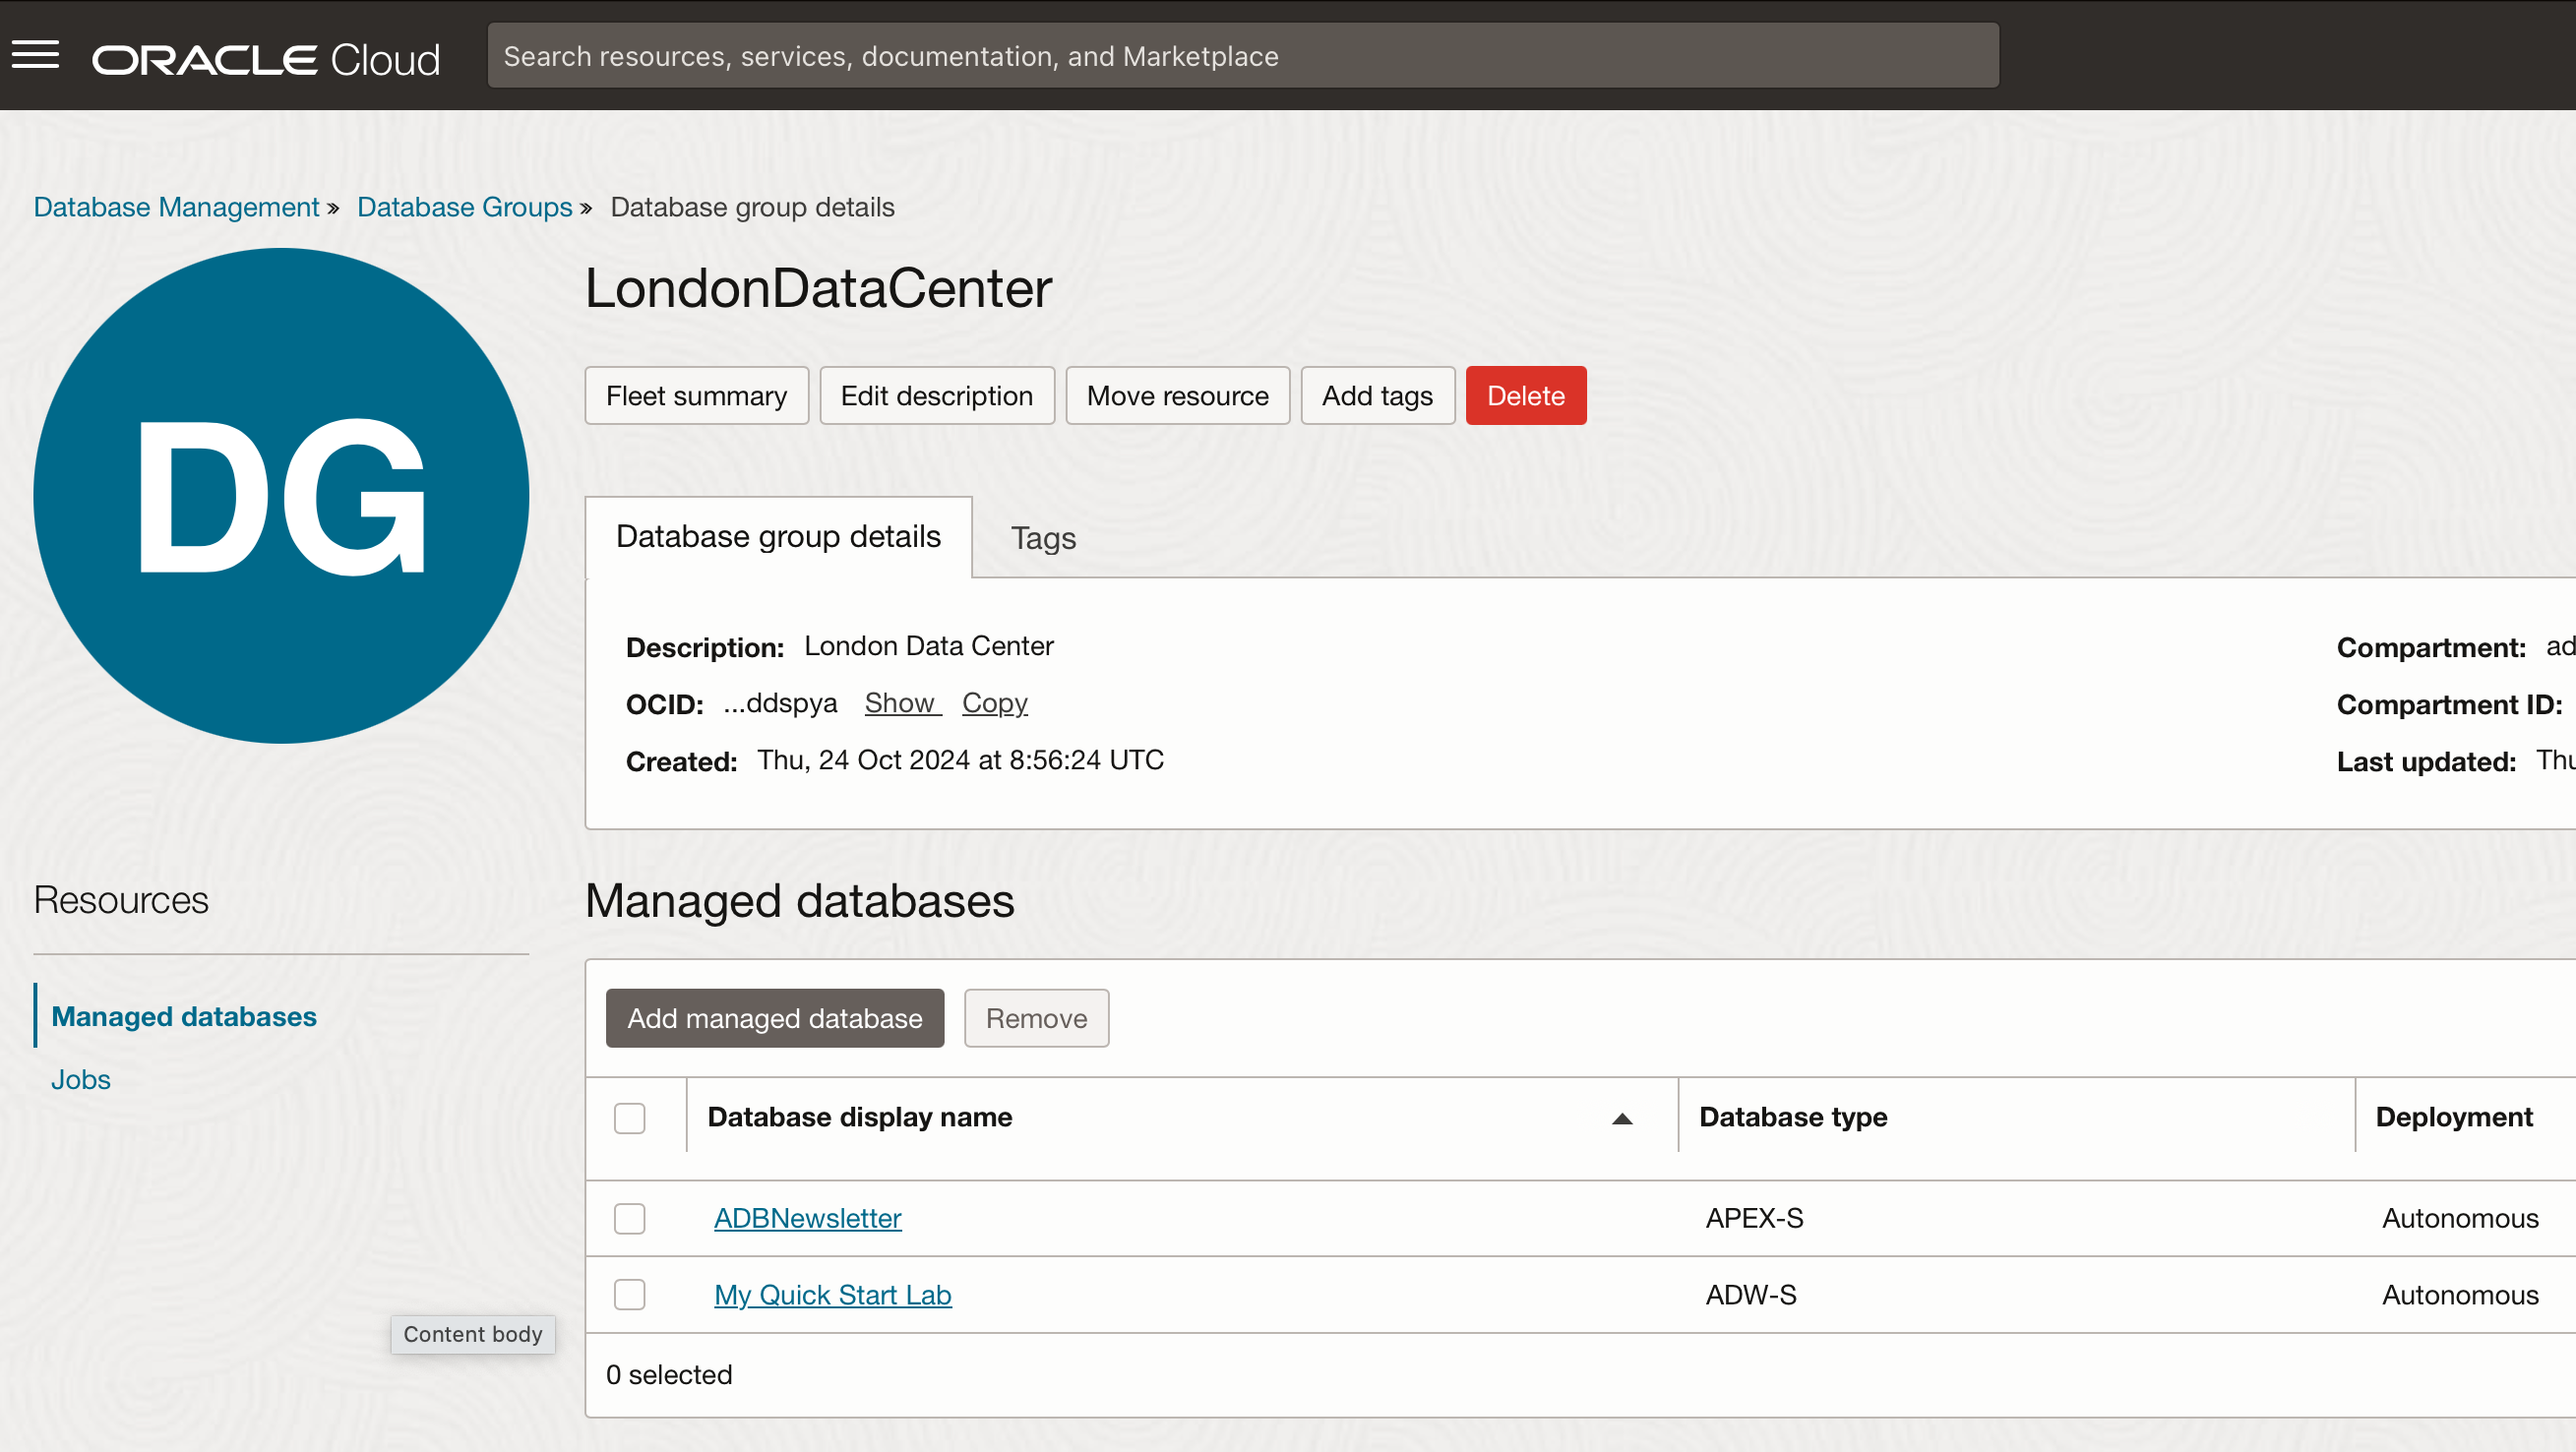
Yes. Within Diagnostics & Management, there is an option to create groups to organize your Autonomous Databases. In the following screenshot, I have set up groups for my workshop ADB instances and my newsletter ADB instances. Each group currently has only one database.
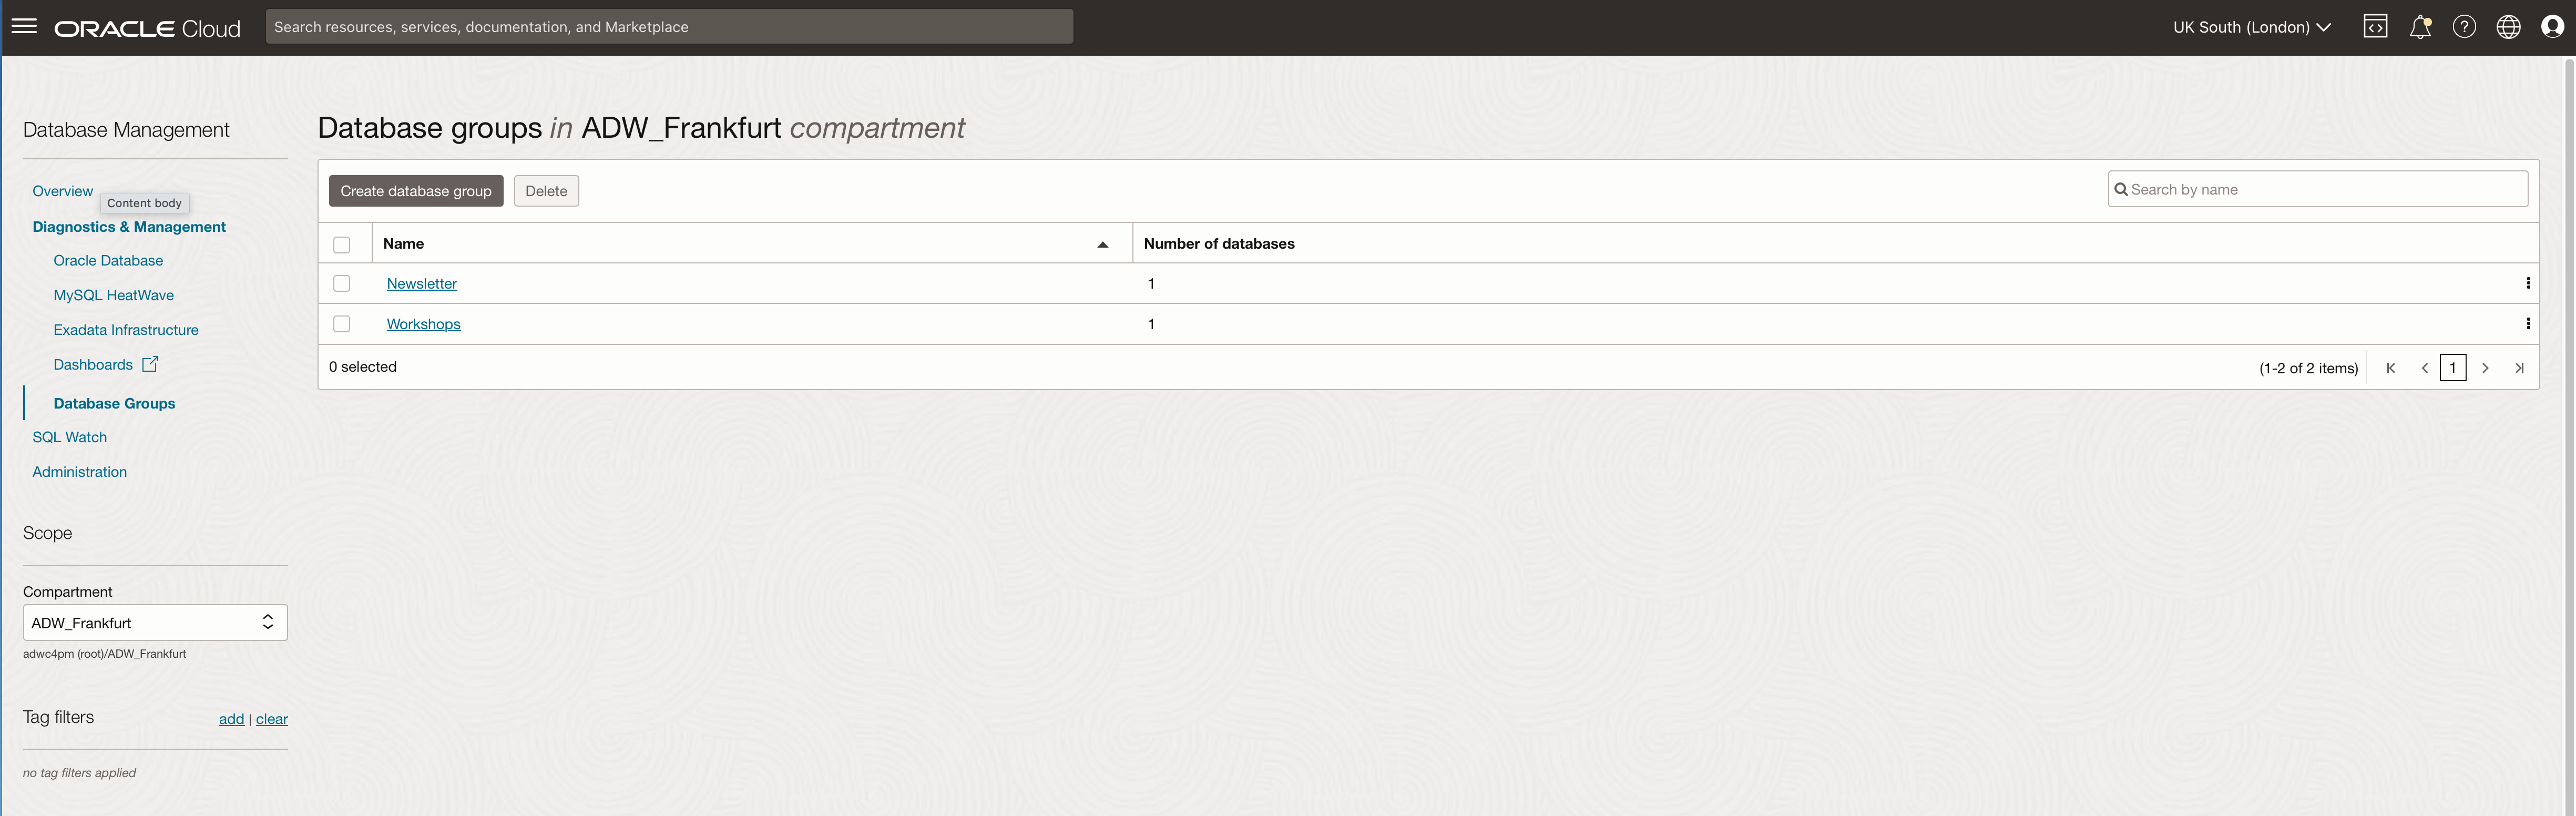
On the monitoring screens, you can select to show information for a single group by selecting the radio button on the left-hand side panel. This makes it easier to use the monitoring and management screens and focus on specific groups of instances.
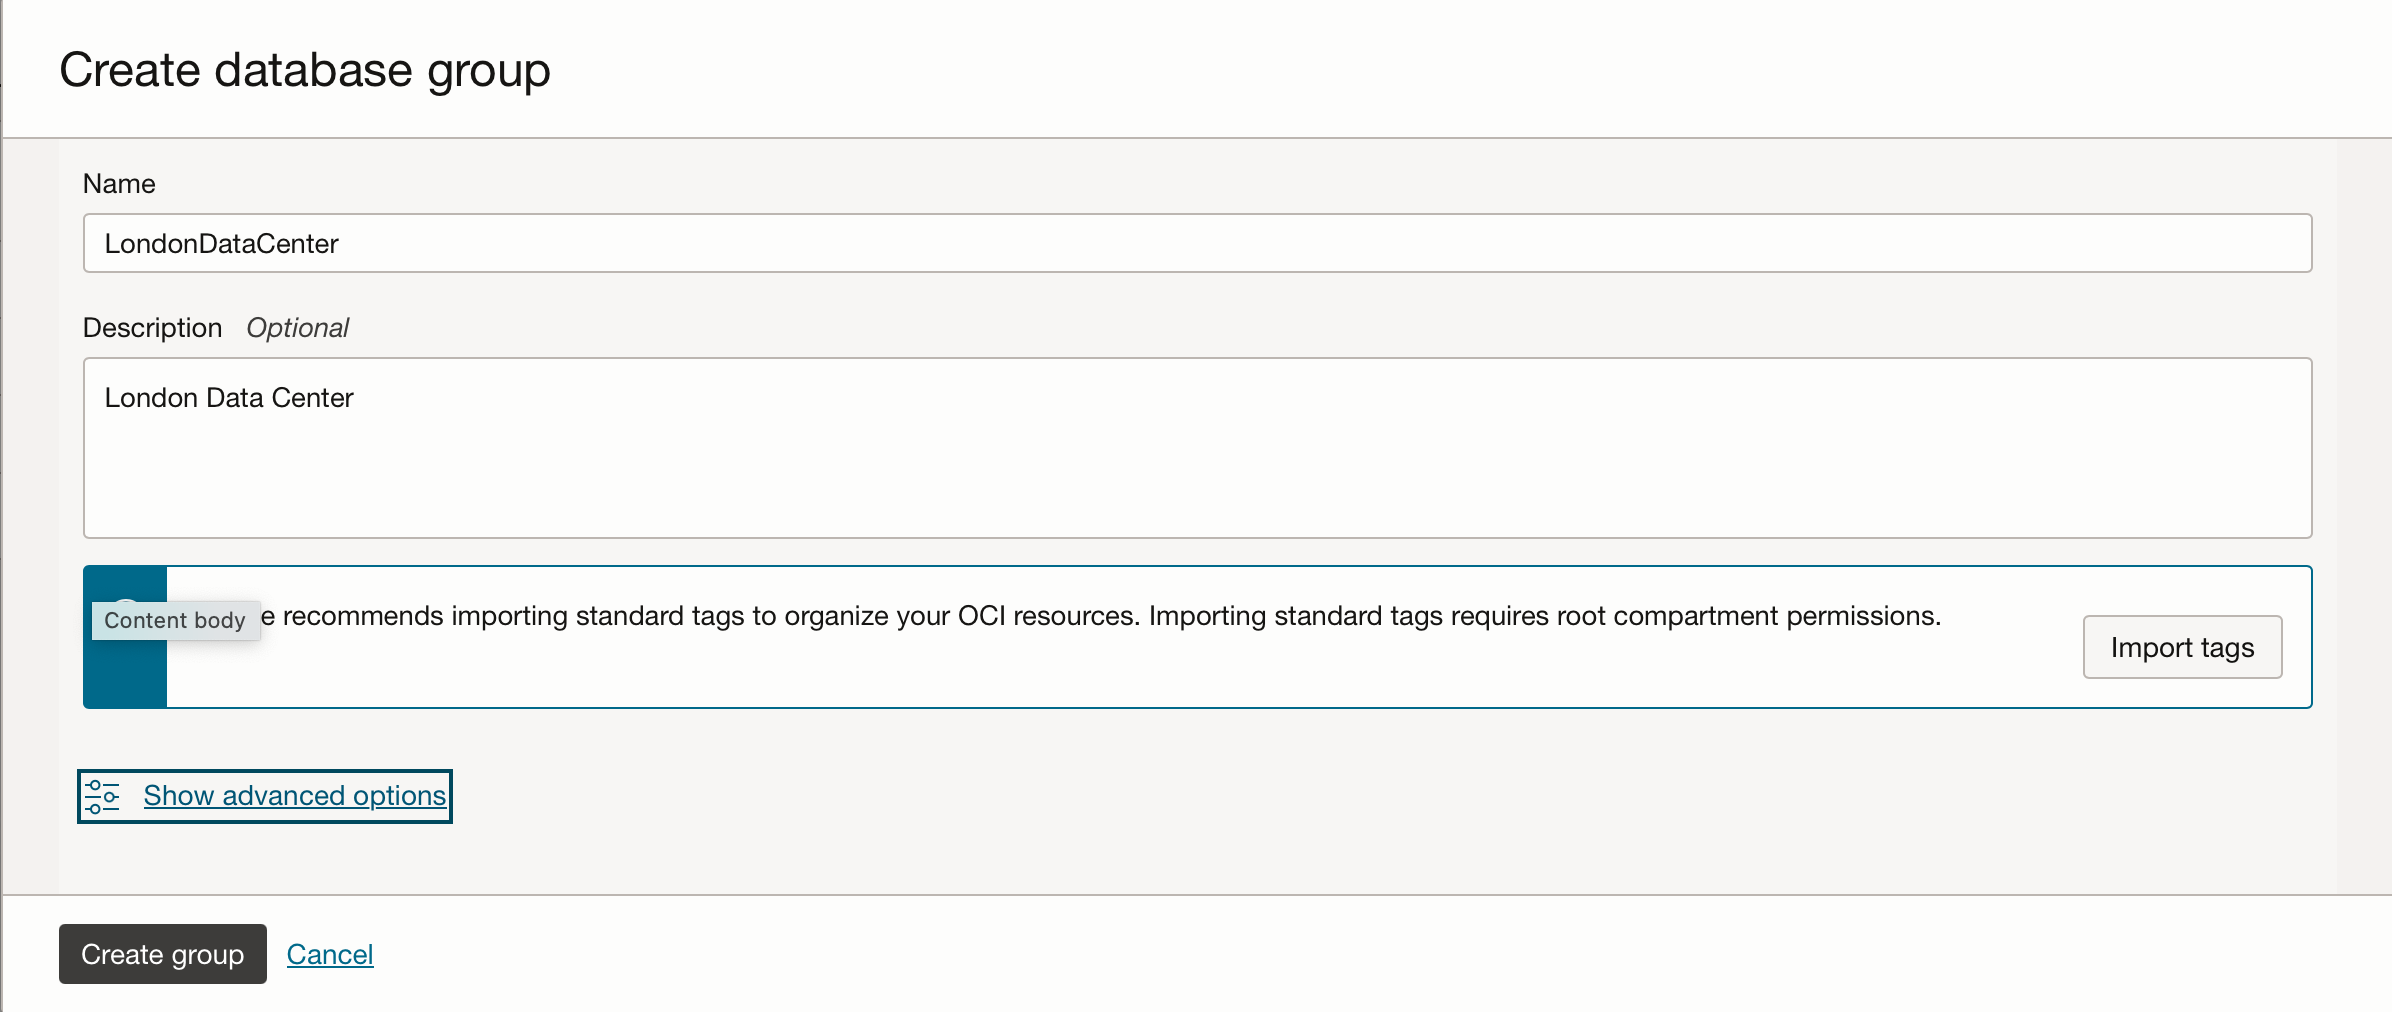
Creating a new group is quick and easy. Click the “Create database group” button and complete the fields on the pop-up form.
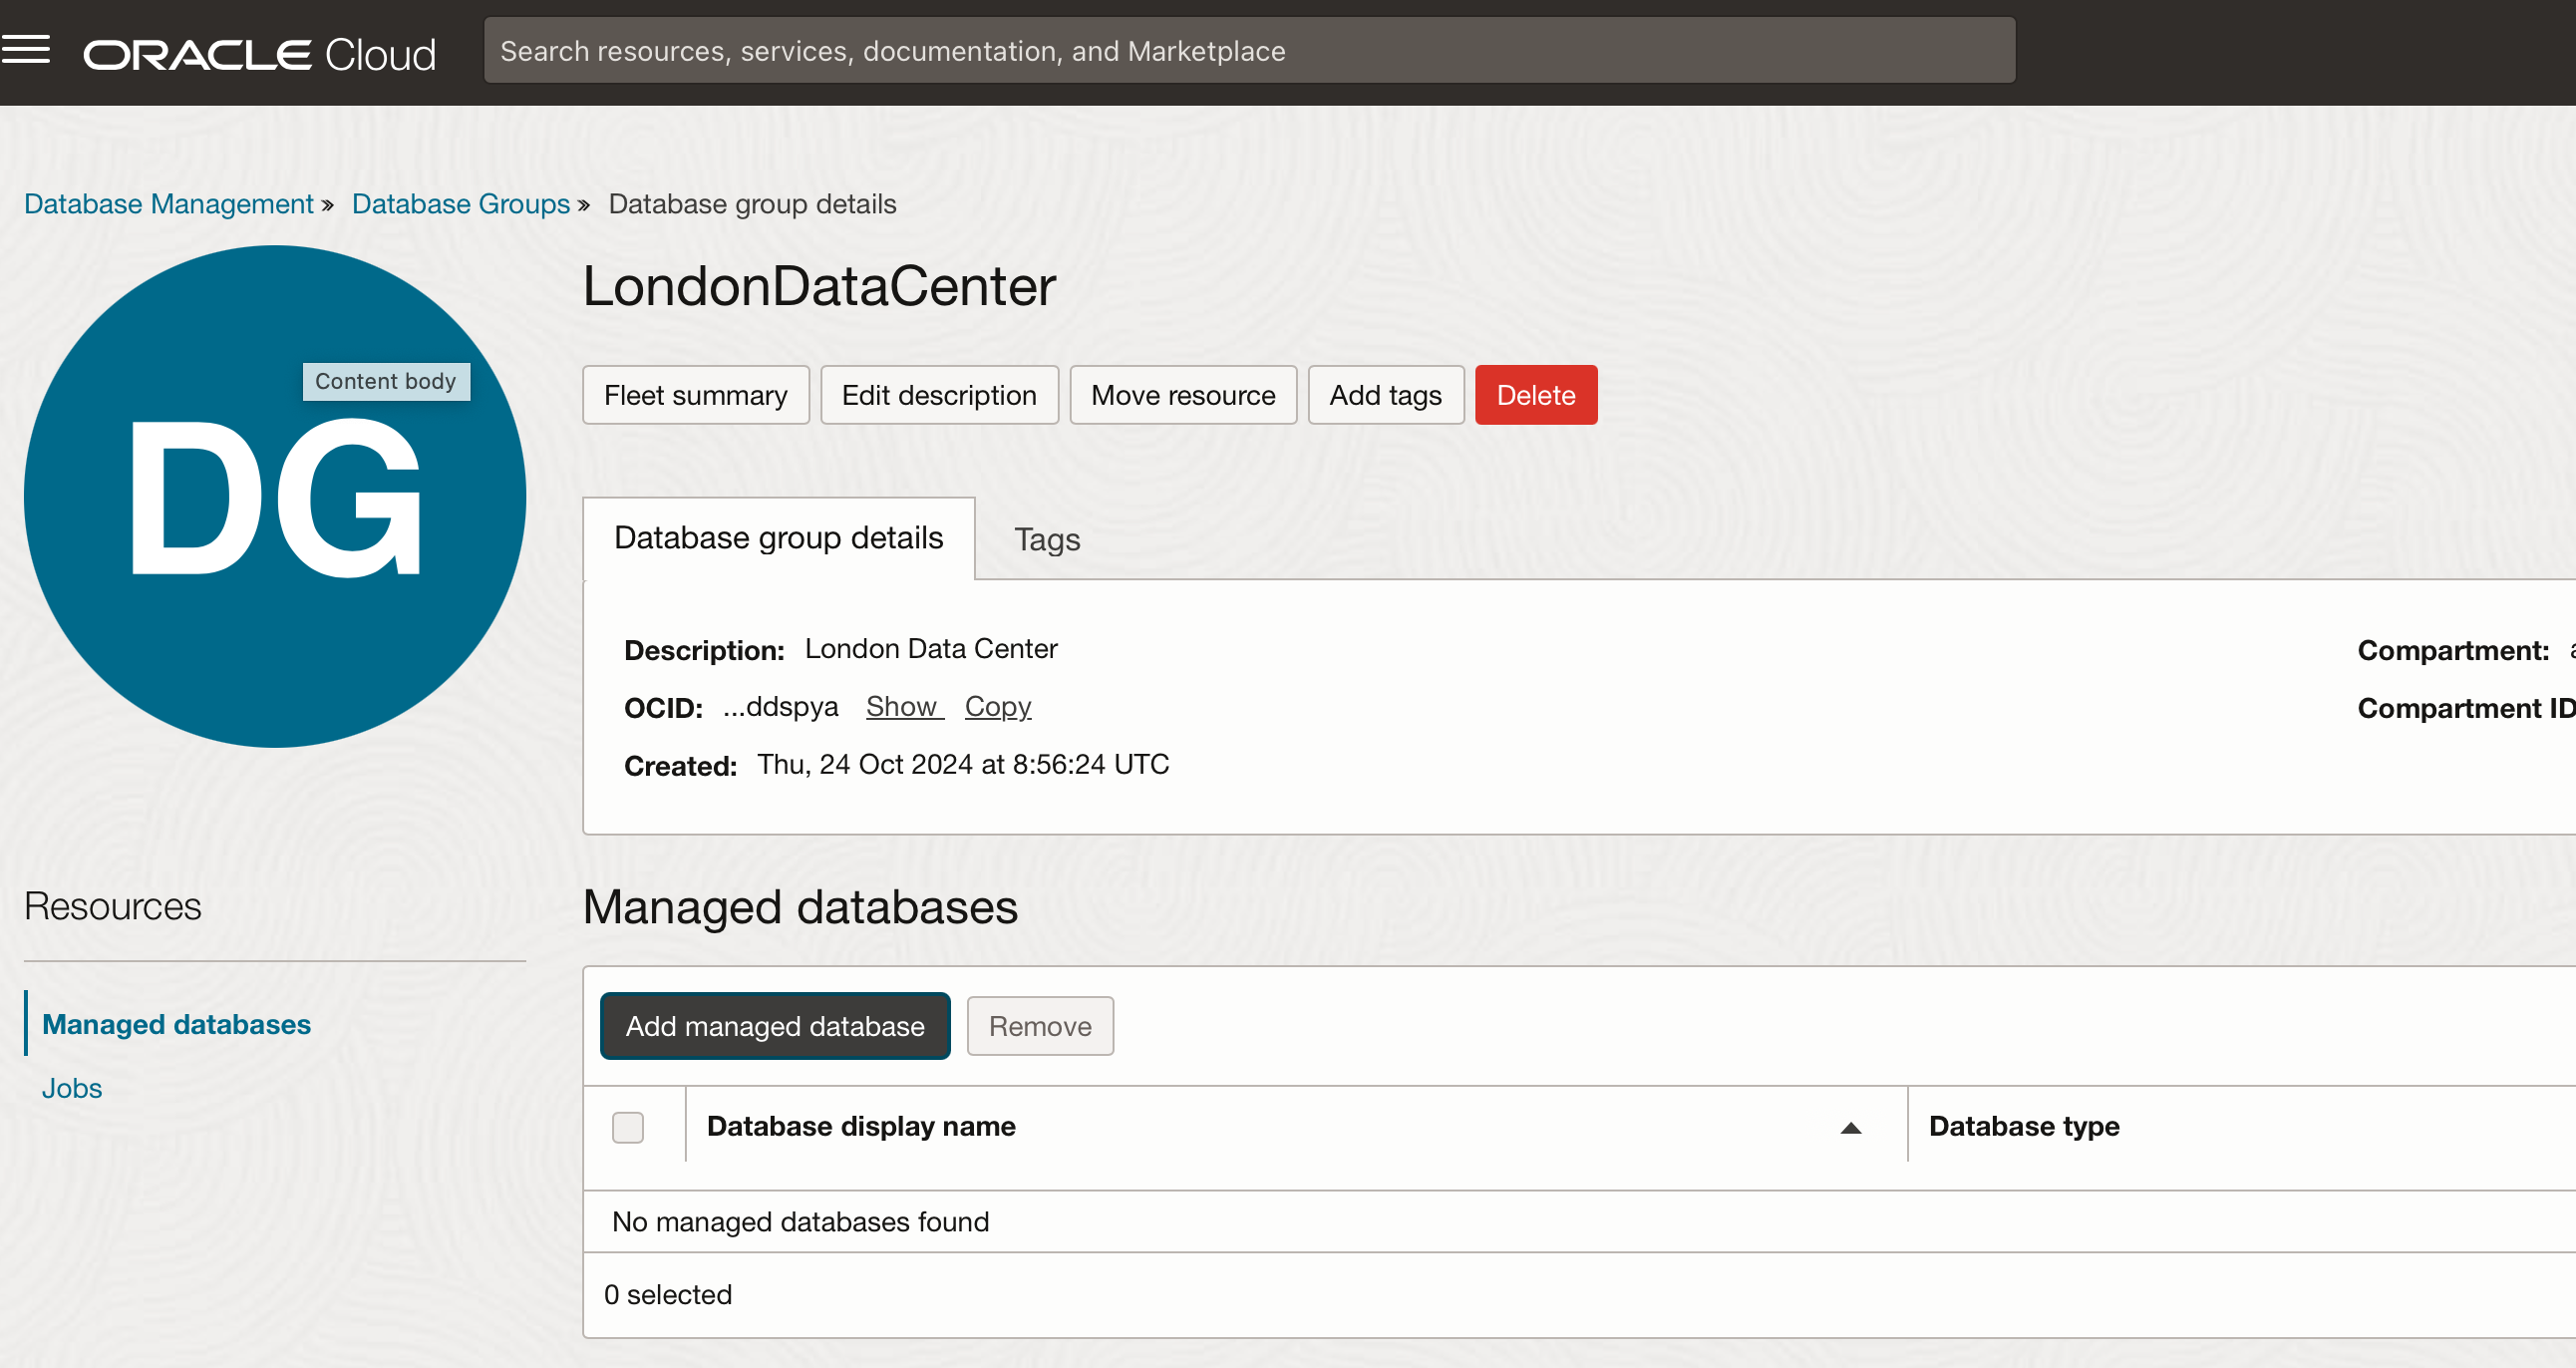
Then simply assign your database instances to the group using the button “add managed database”…
Can an ADB instance belong to more than one group?
Yes. The two instances assigned to my LondonDataCenter group also belong to my other groups – workshops and newsletters.
How can I get high-level diagnostic information about my ADB instances?
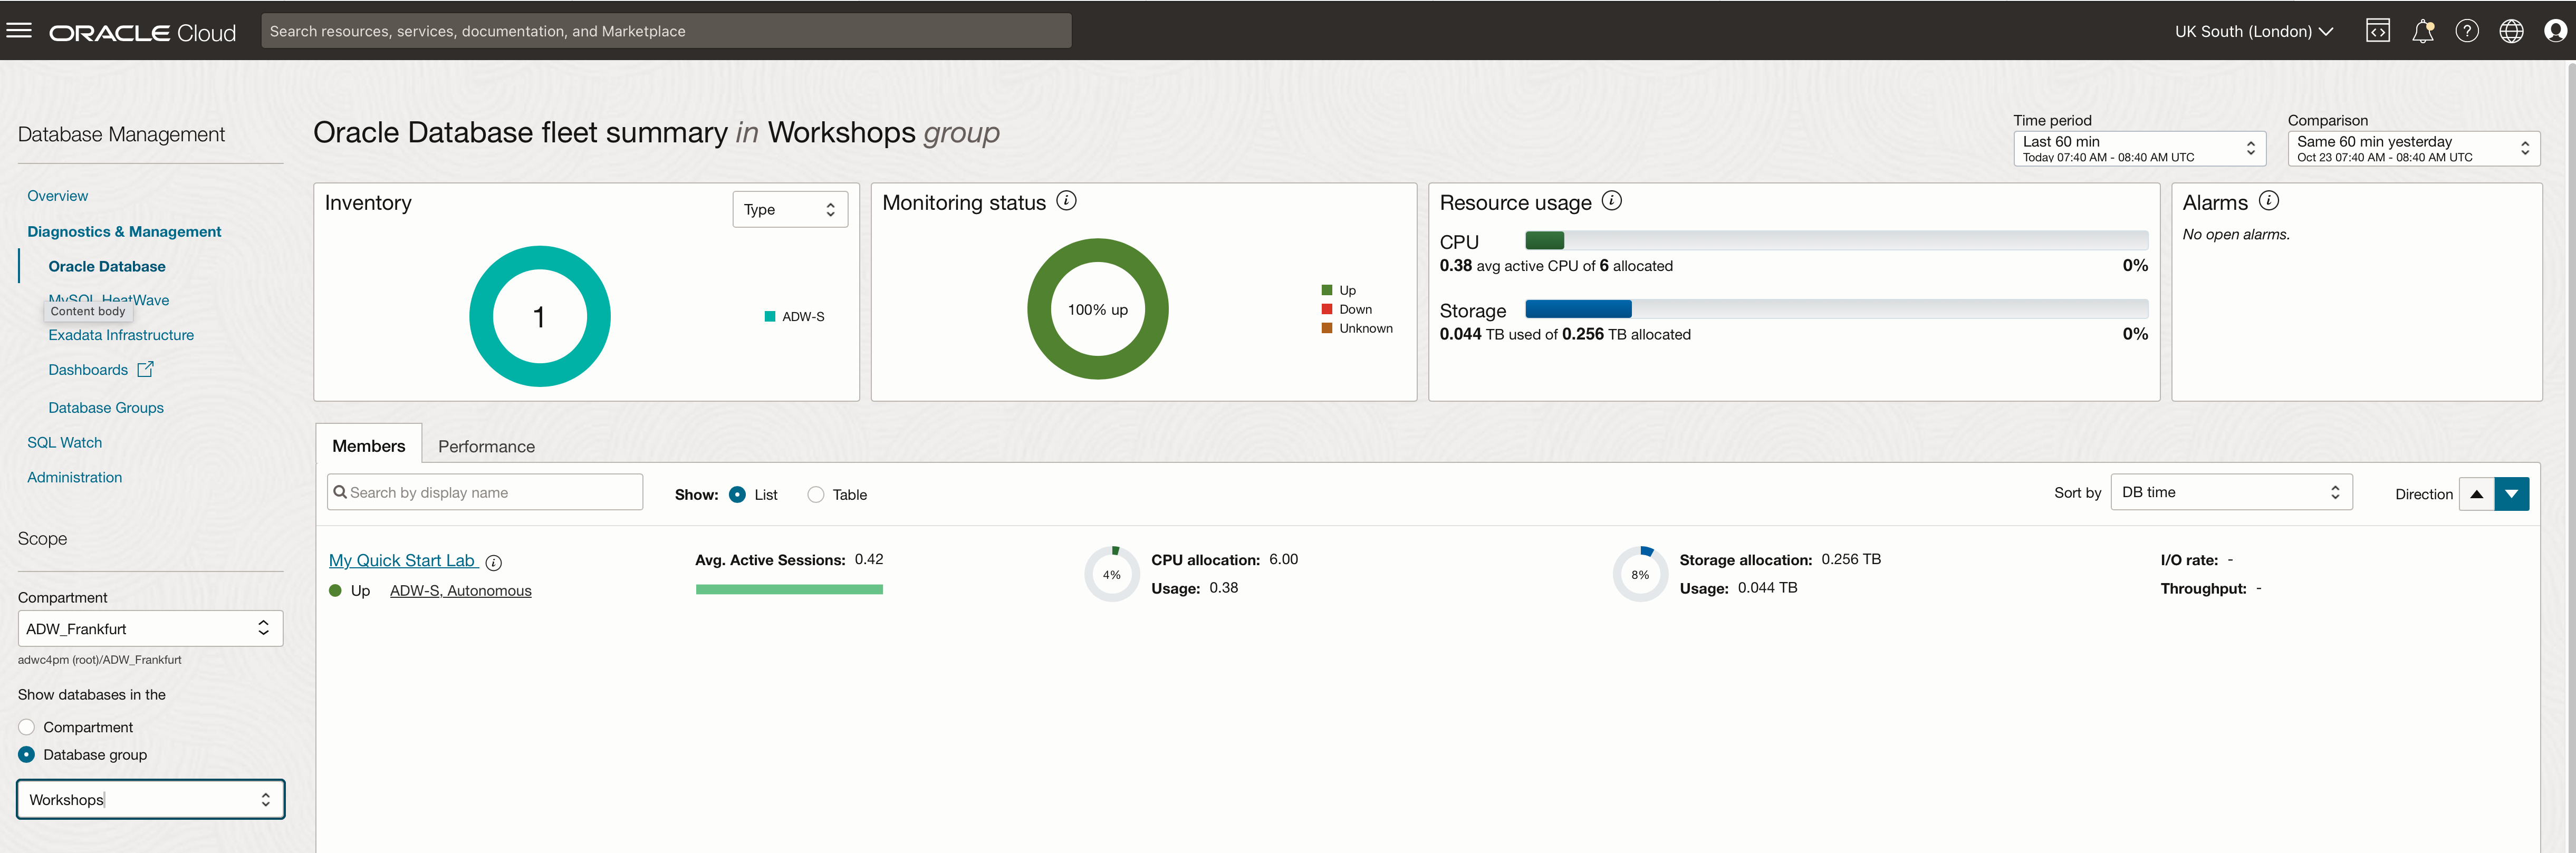
The Diagnostic and Management page for Oracle Database provides information similar to the ADB console summary page. Most importantly, you can set a time window to compare today’s operation with yesterday or seven days ago. This gives you a meaningful way to baseline overall resource usage and performance and an excellent way to start managing and observing your fleet on an ‘exception’ basis. The screenshot shows that my CPU usage today is down 18.36% compared with yesterday. The detailed information relating to each ADB instance is below the summary graphs, where we can see that usage of my QuickStartLab instance is up 4.59%, but my newsletter instance usage is down 28.81%.
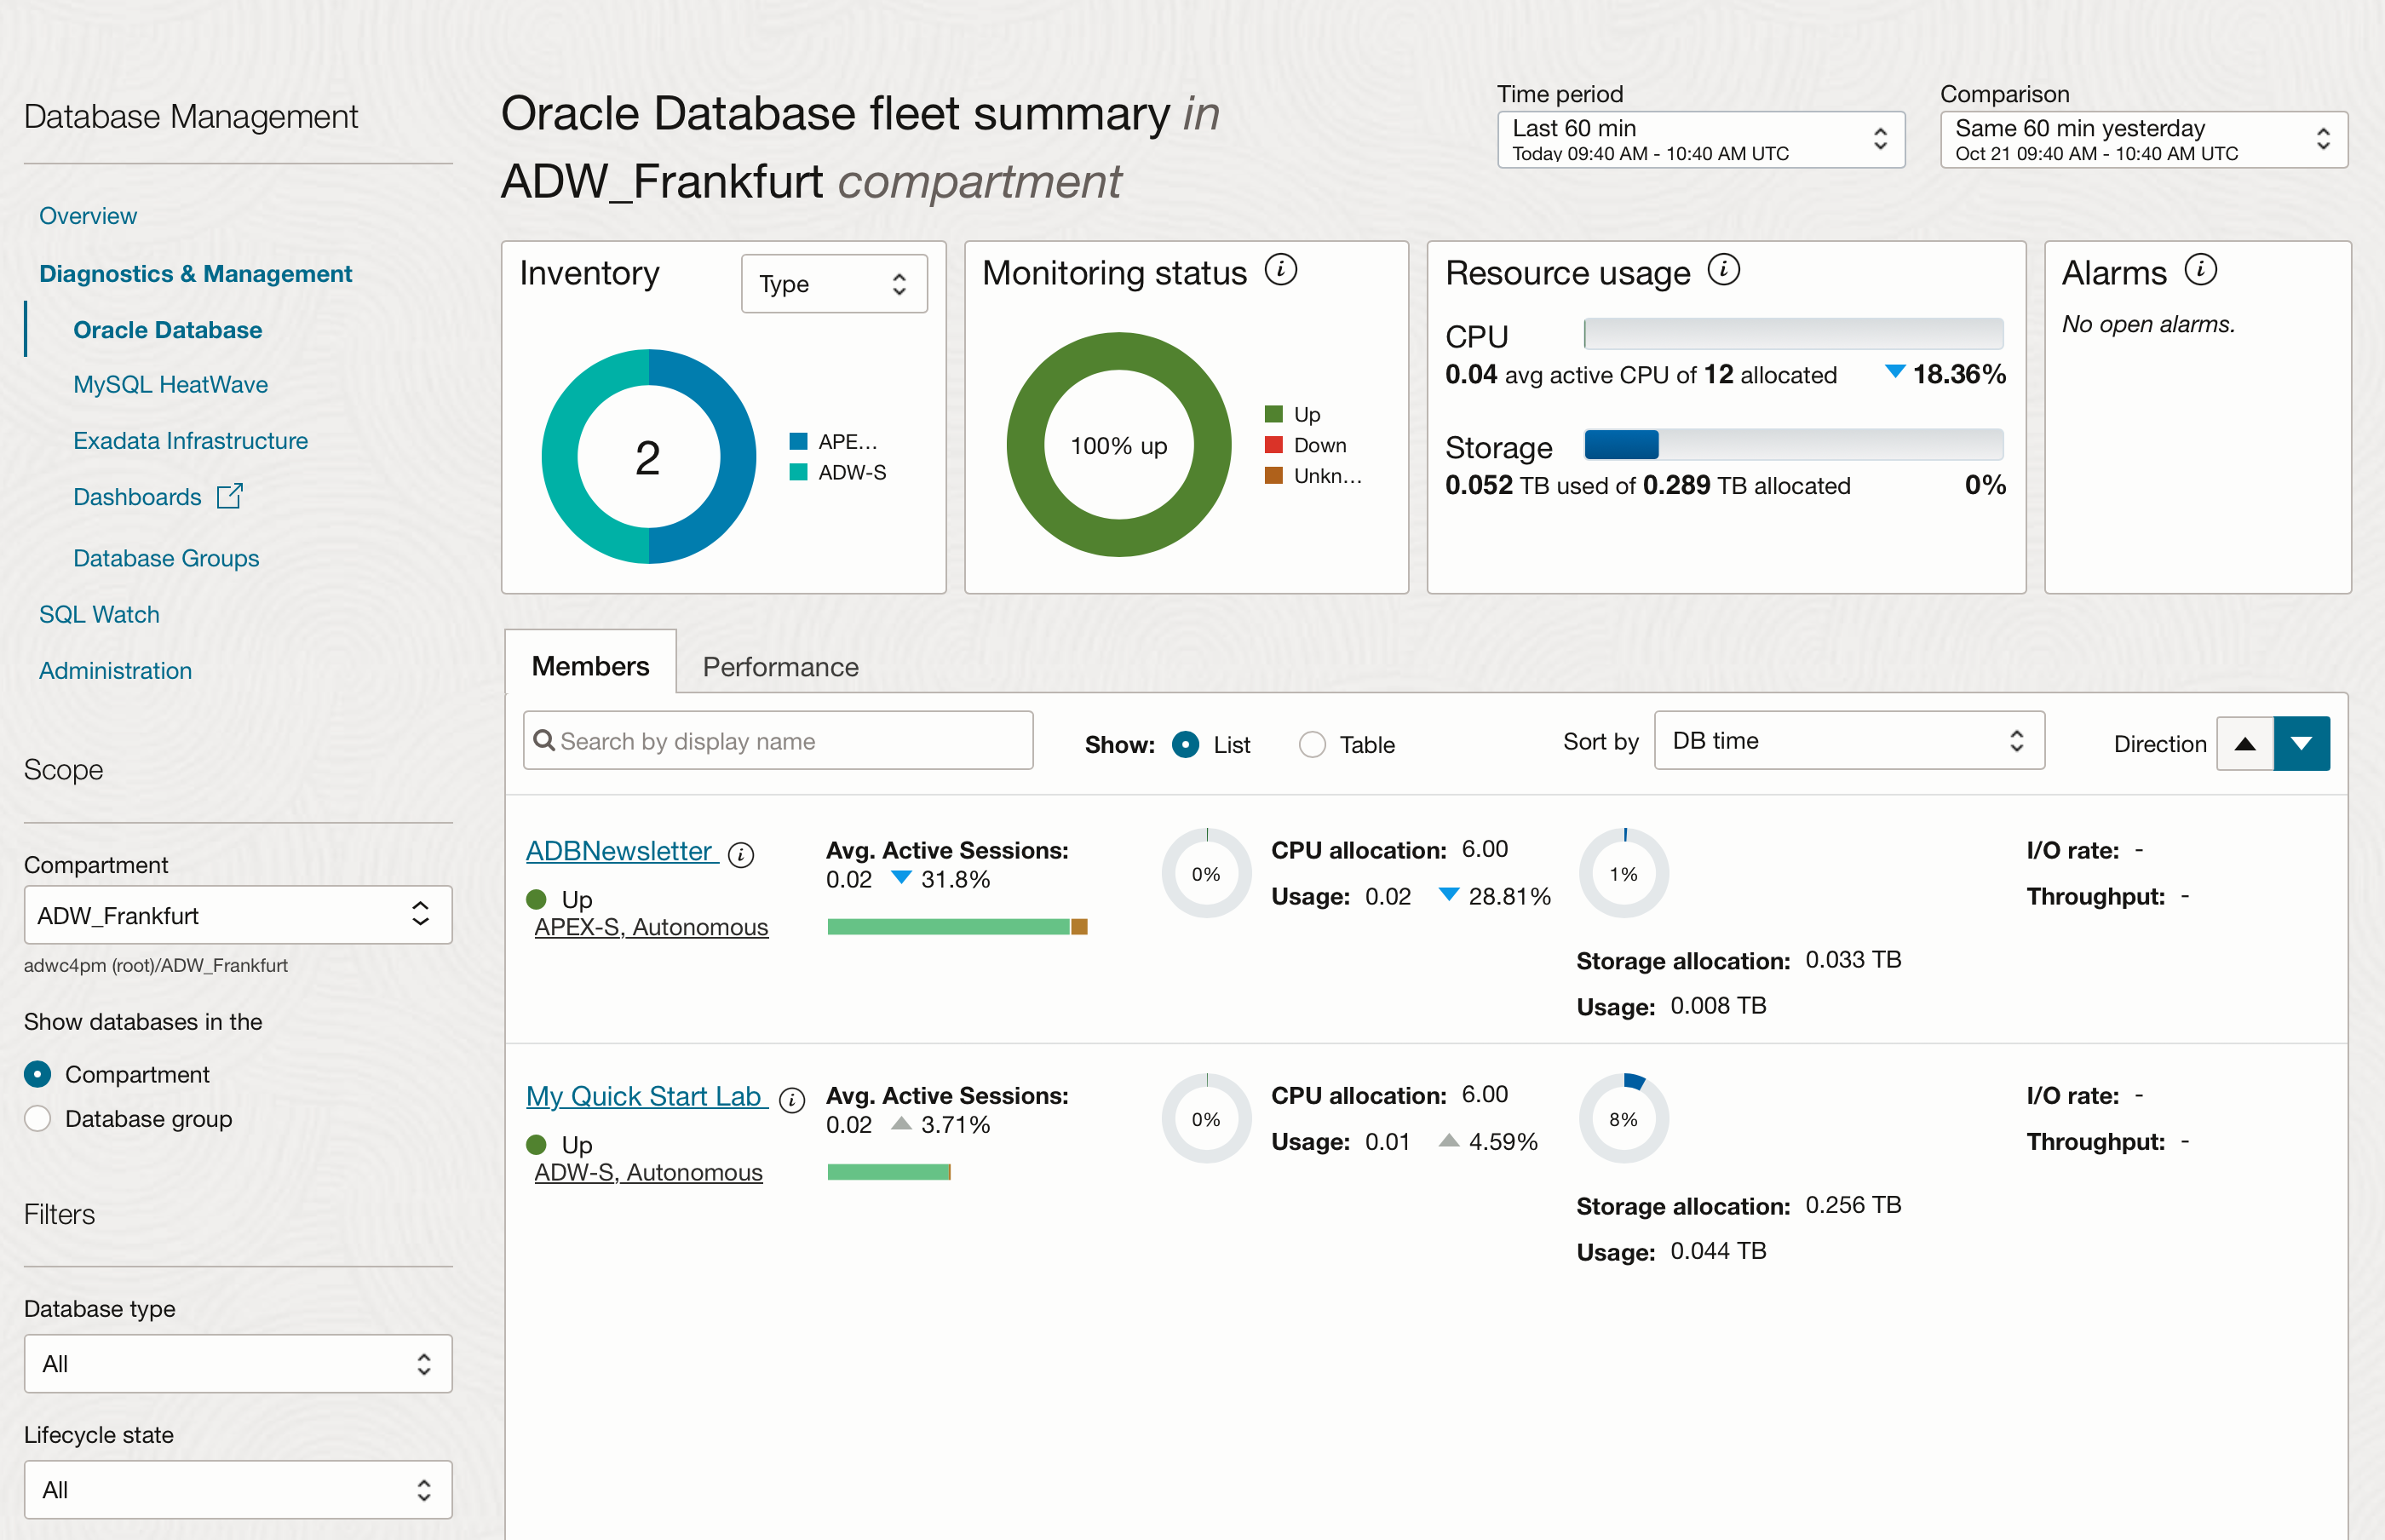
Each ADB instance is shown as a hyperlink, so you can simply click on the instance name to get more information about the performance and resource usage. From the Summary view, you can then drill into the various layers of performance monitoring.

Can I monitor individual SQL statements using the Database Management service?
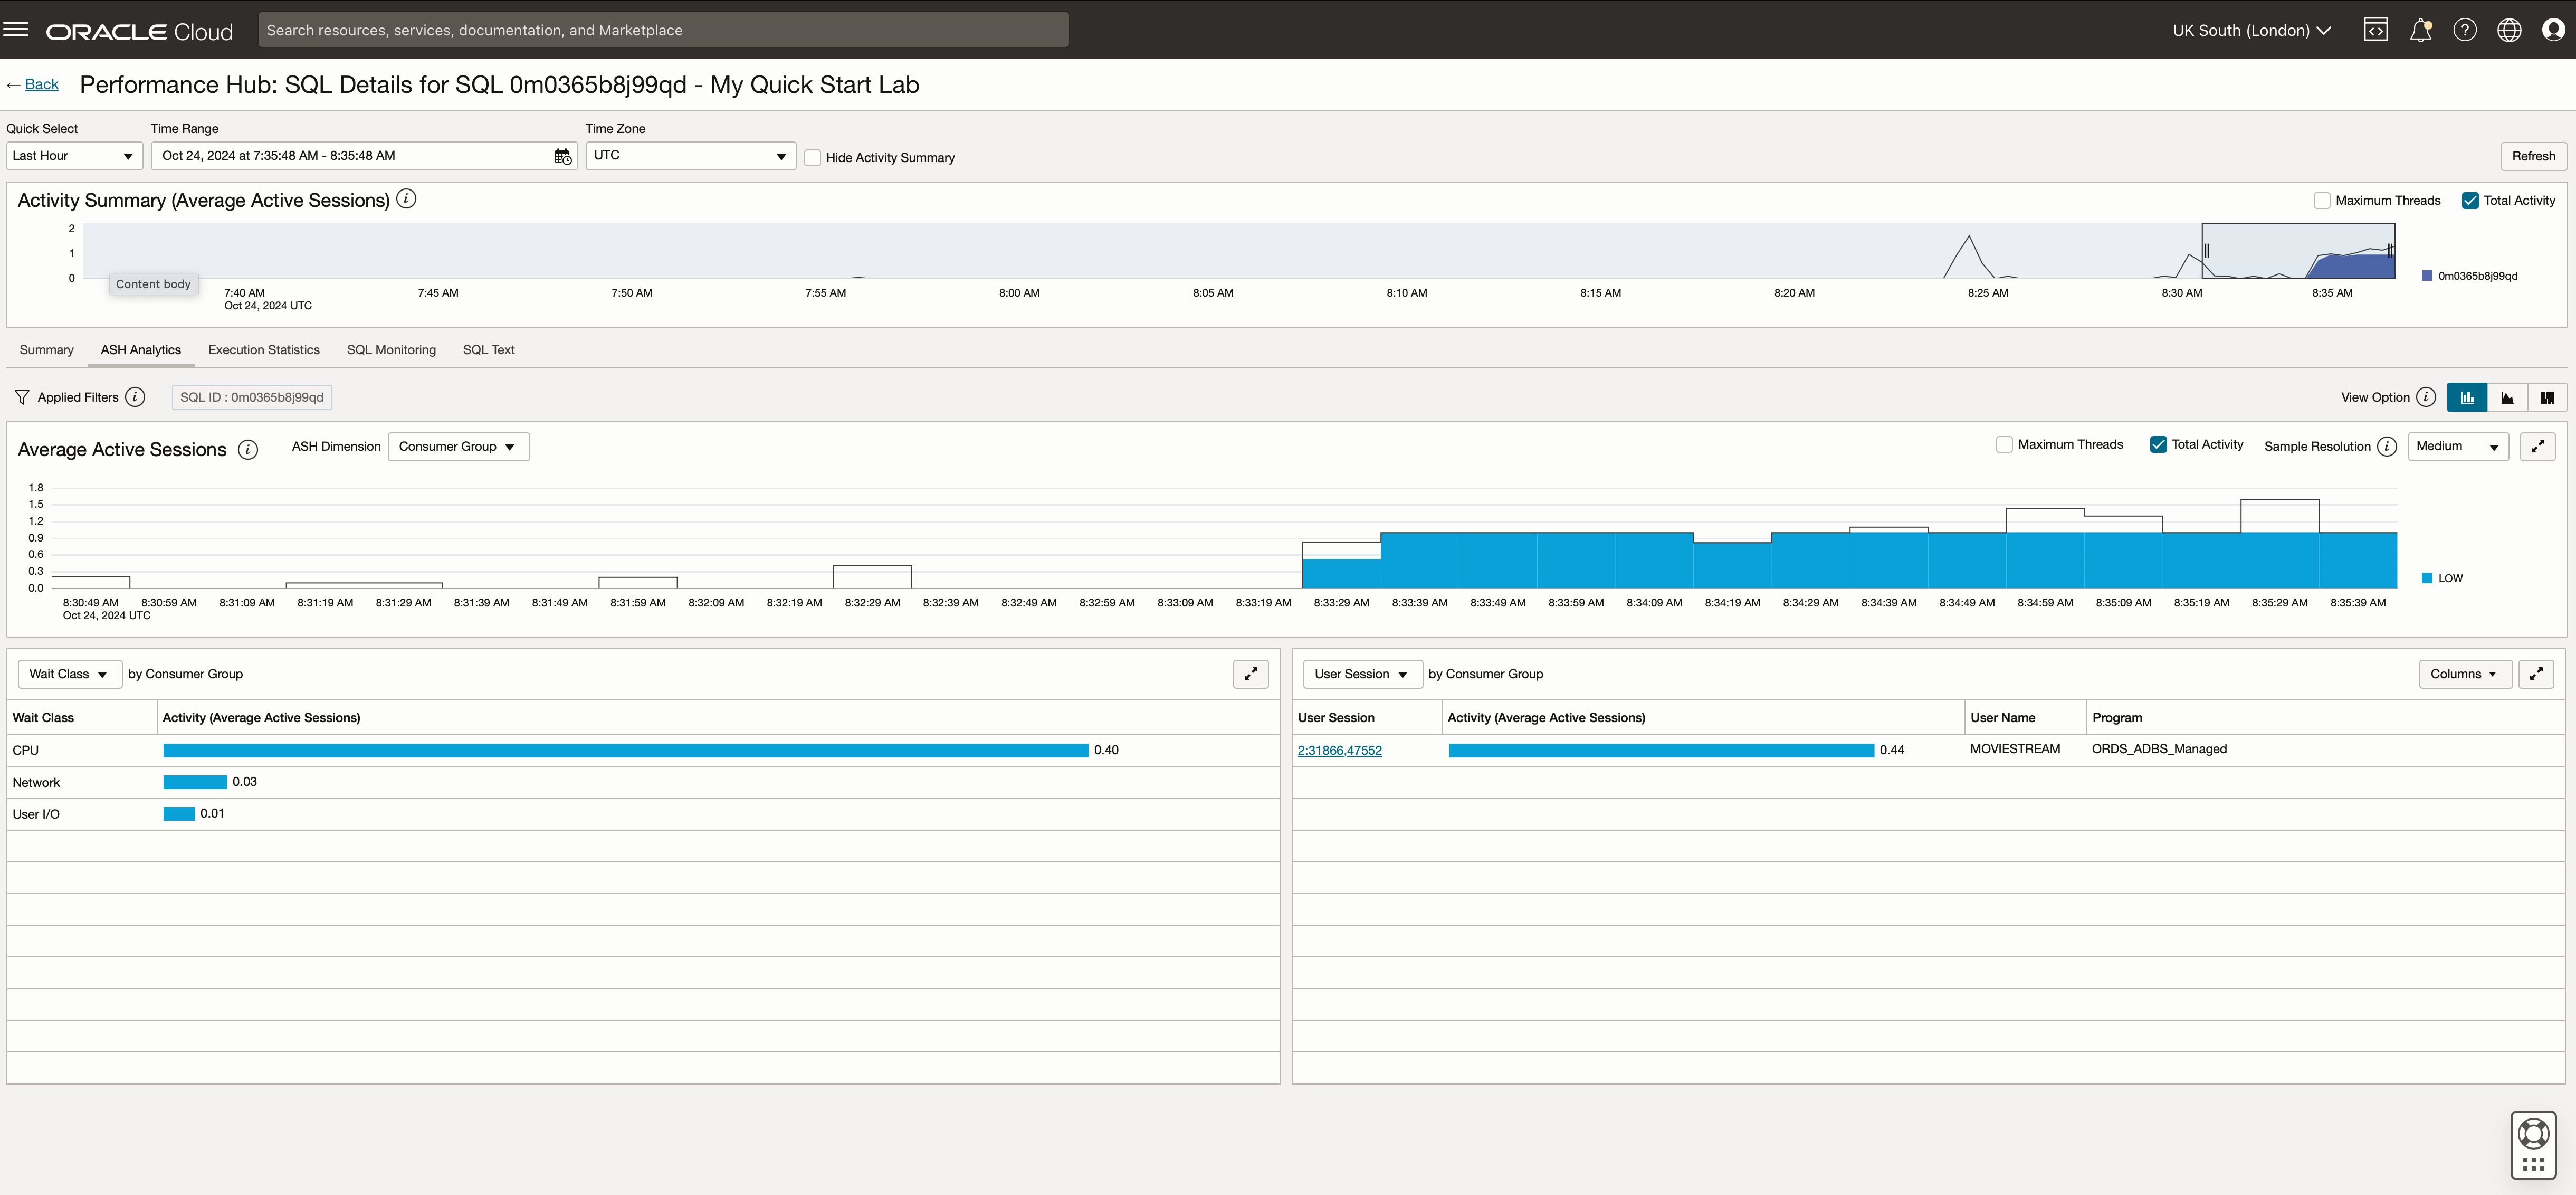
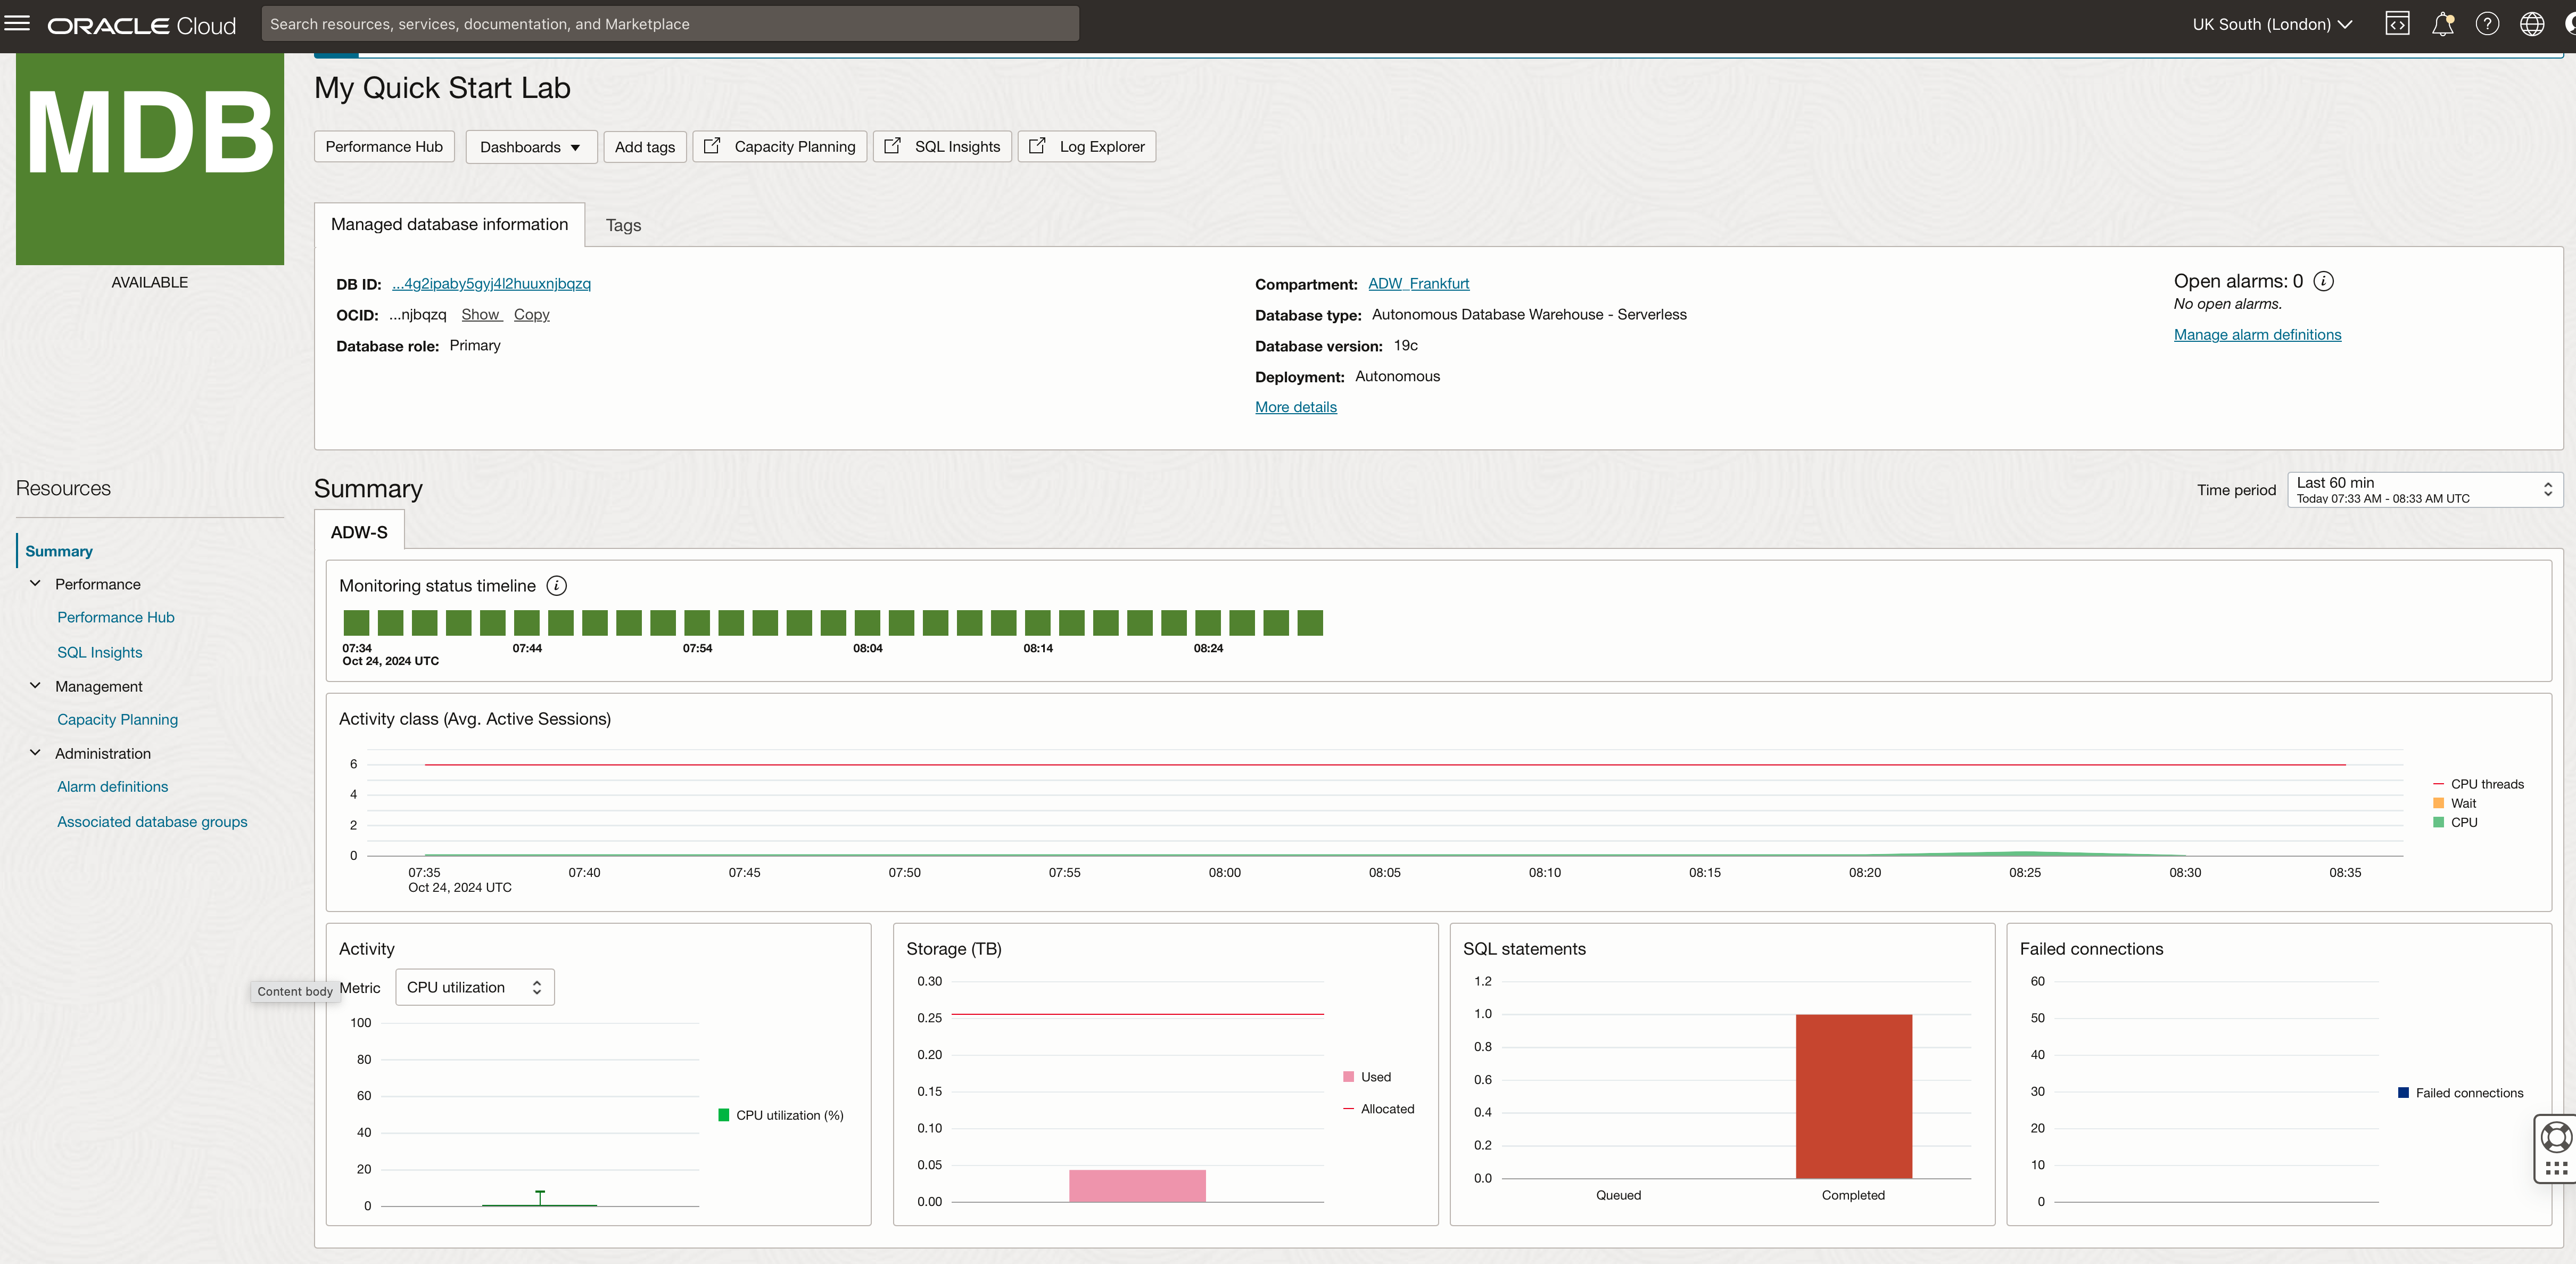
Yes. The Performance Hub button opens up the standard performance monitoring view we saw in the previous blog post about monitoring individual ADB instances. Of course, the performance hub monitoring with Database Management does not require a database username or password, but you get all the same information.
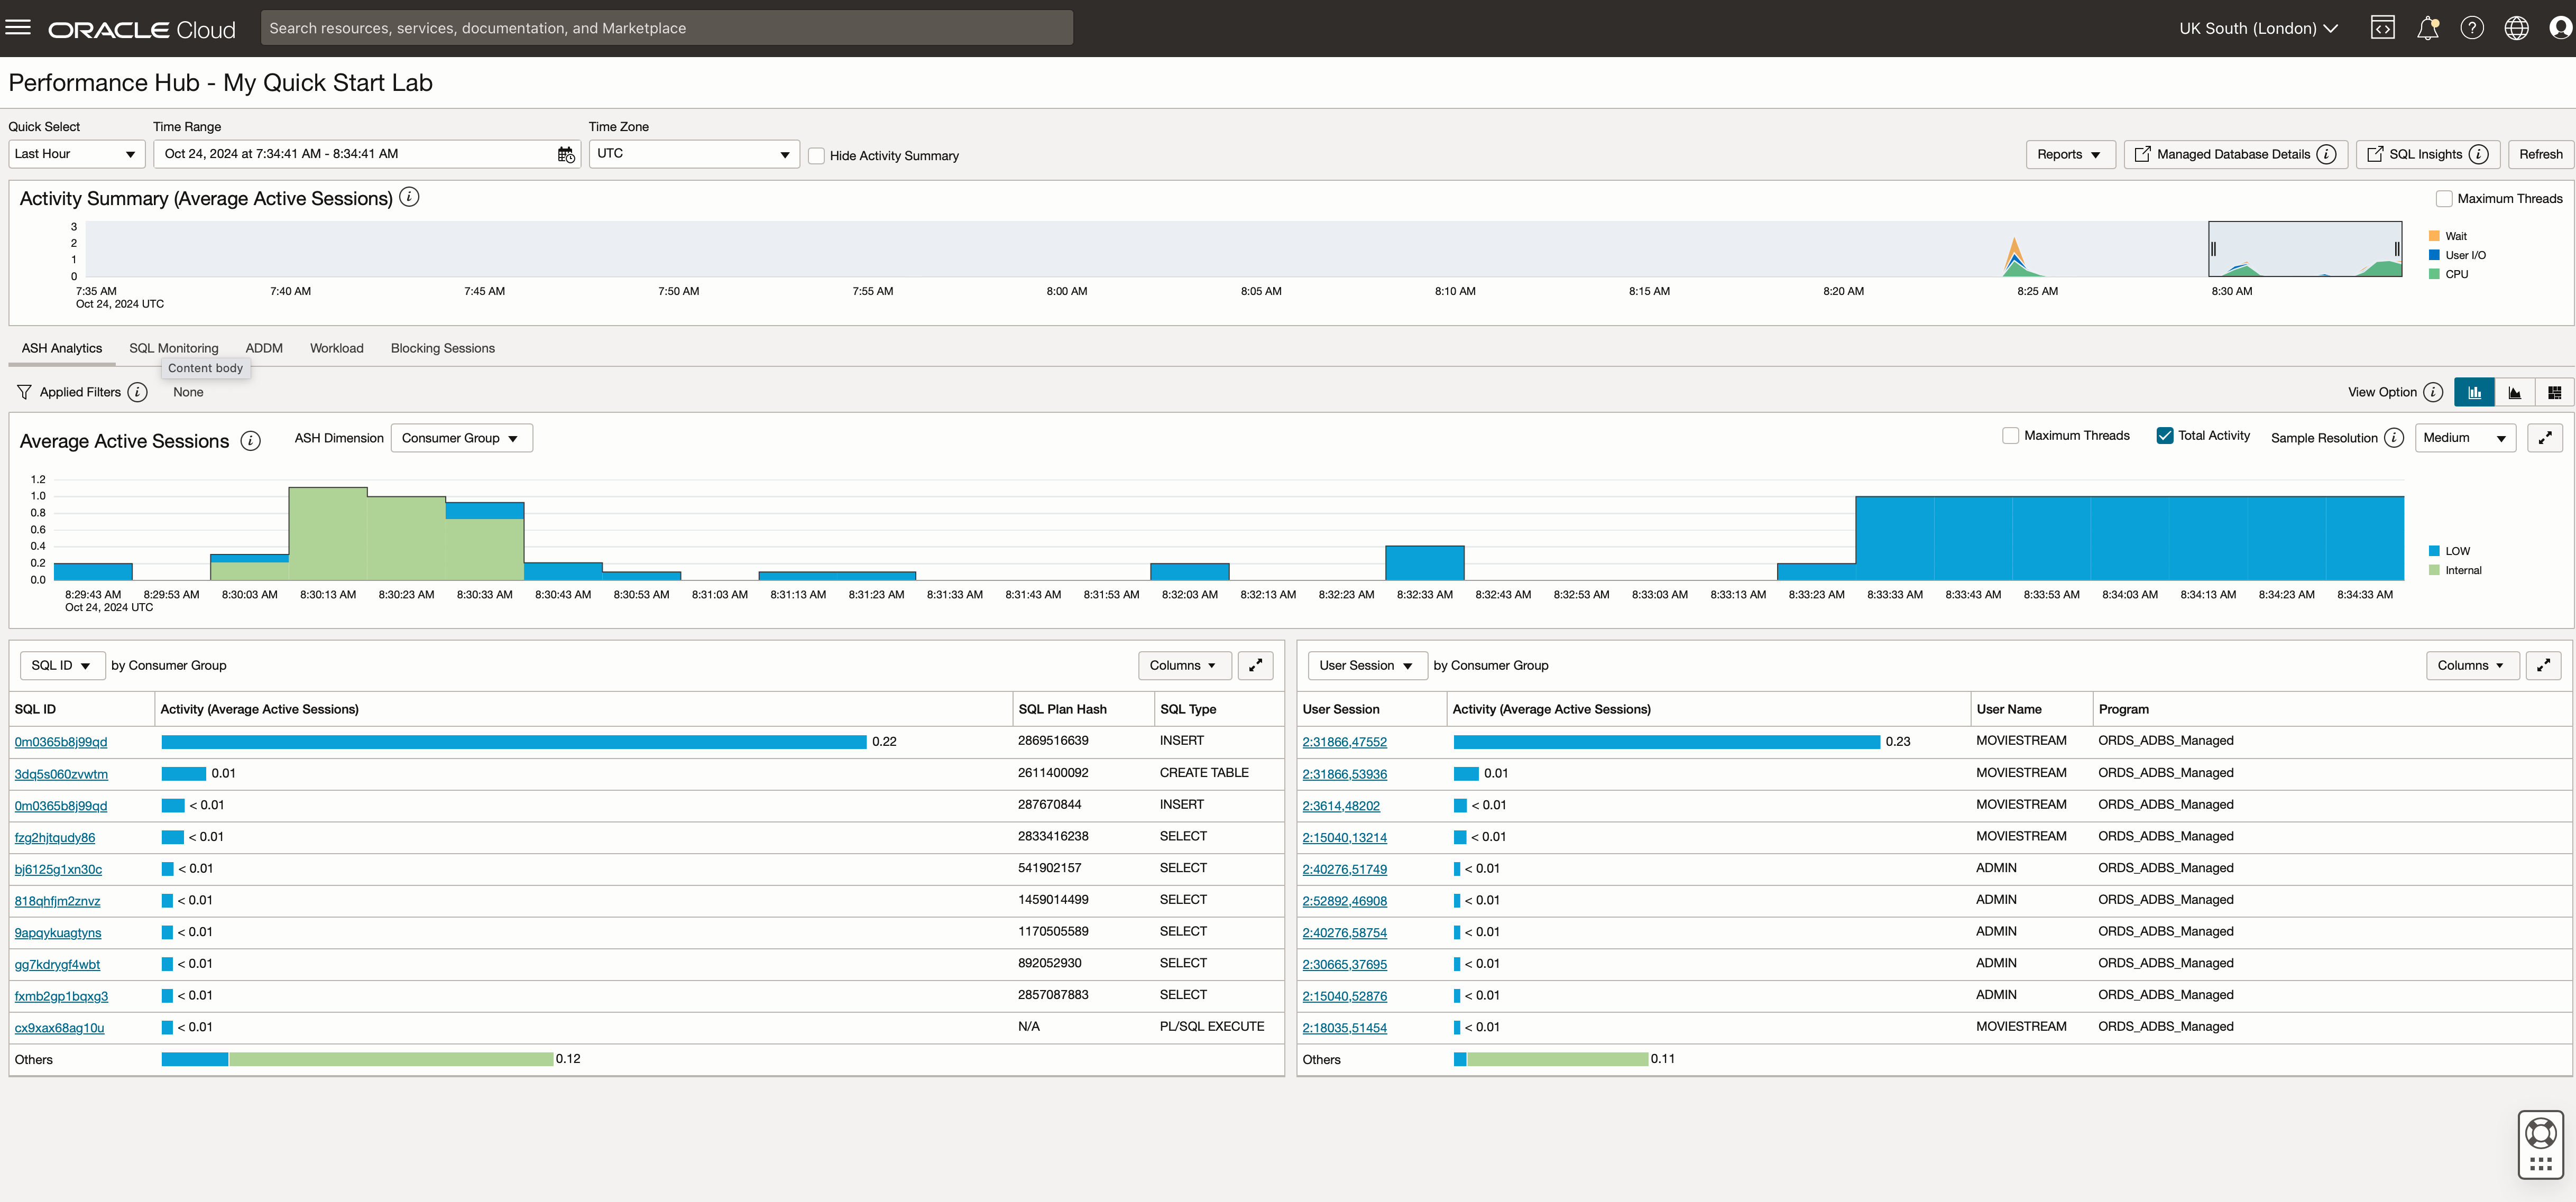
By looking at the most active SQL ID at the top of the list in the table, we can view the execution details:
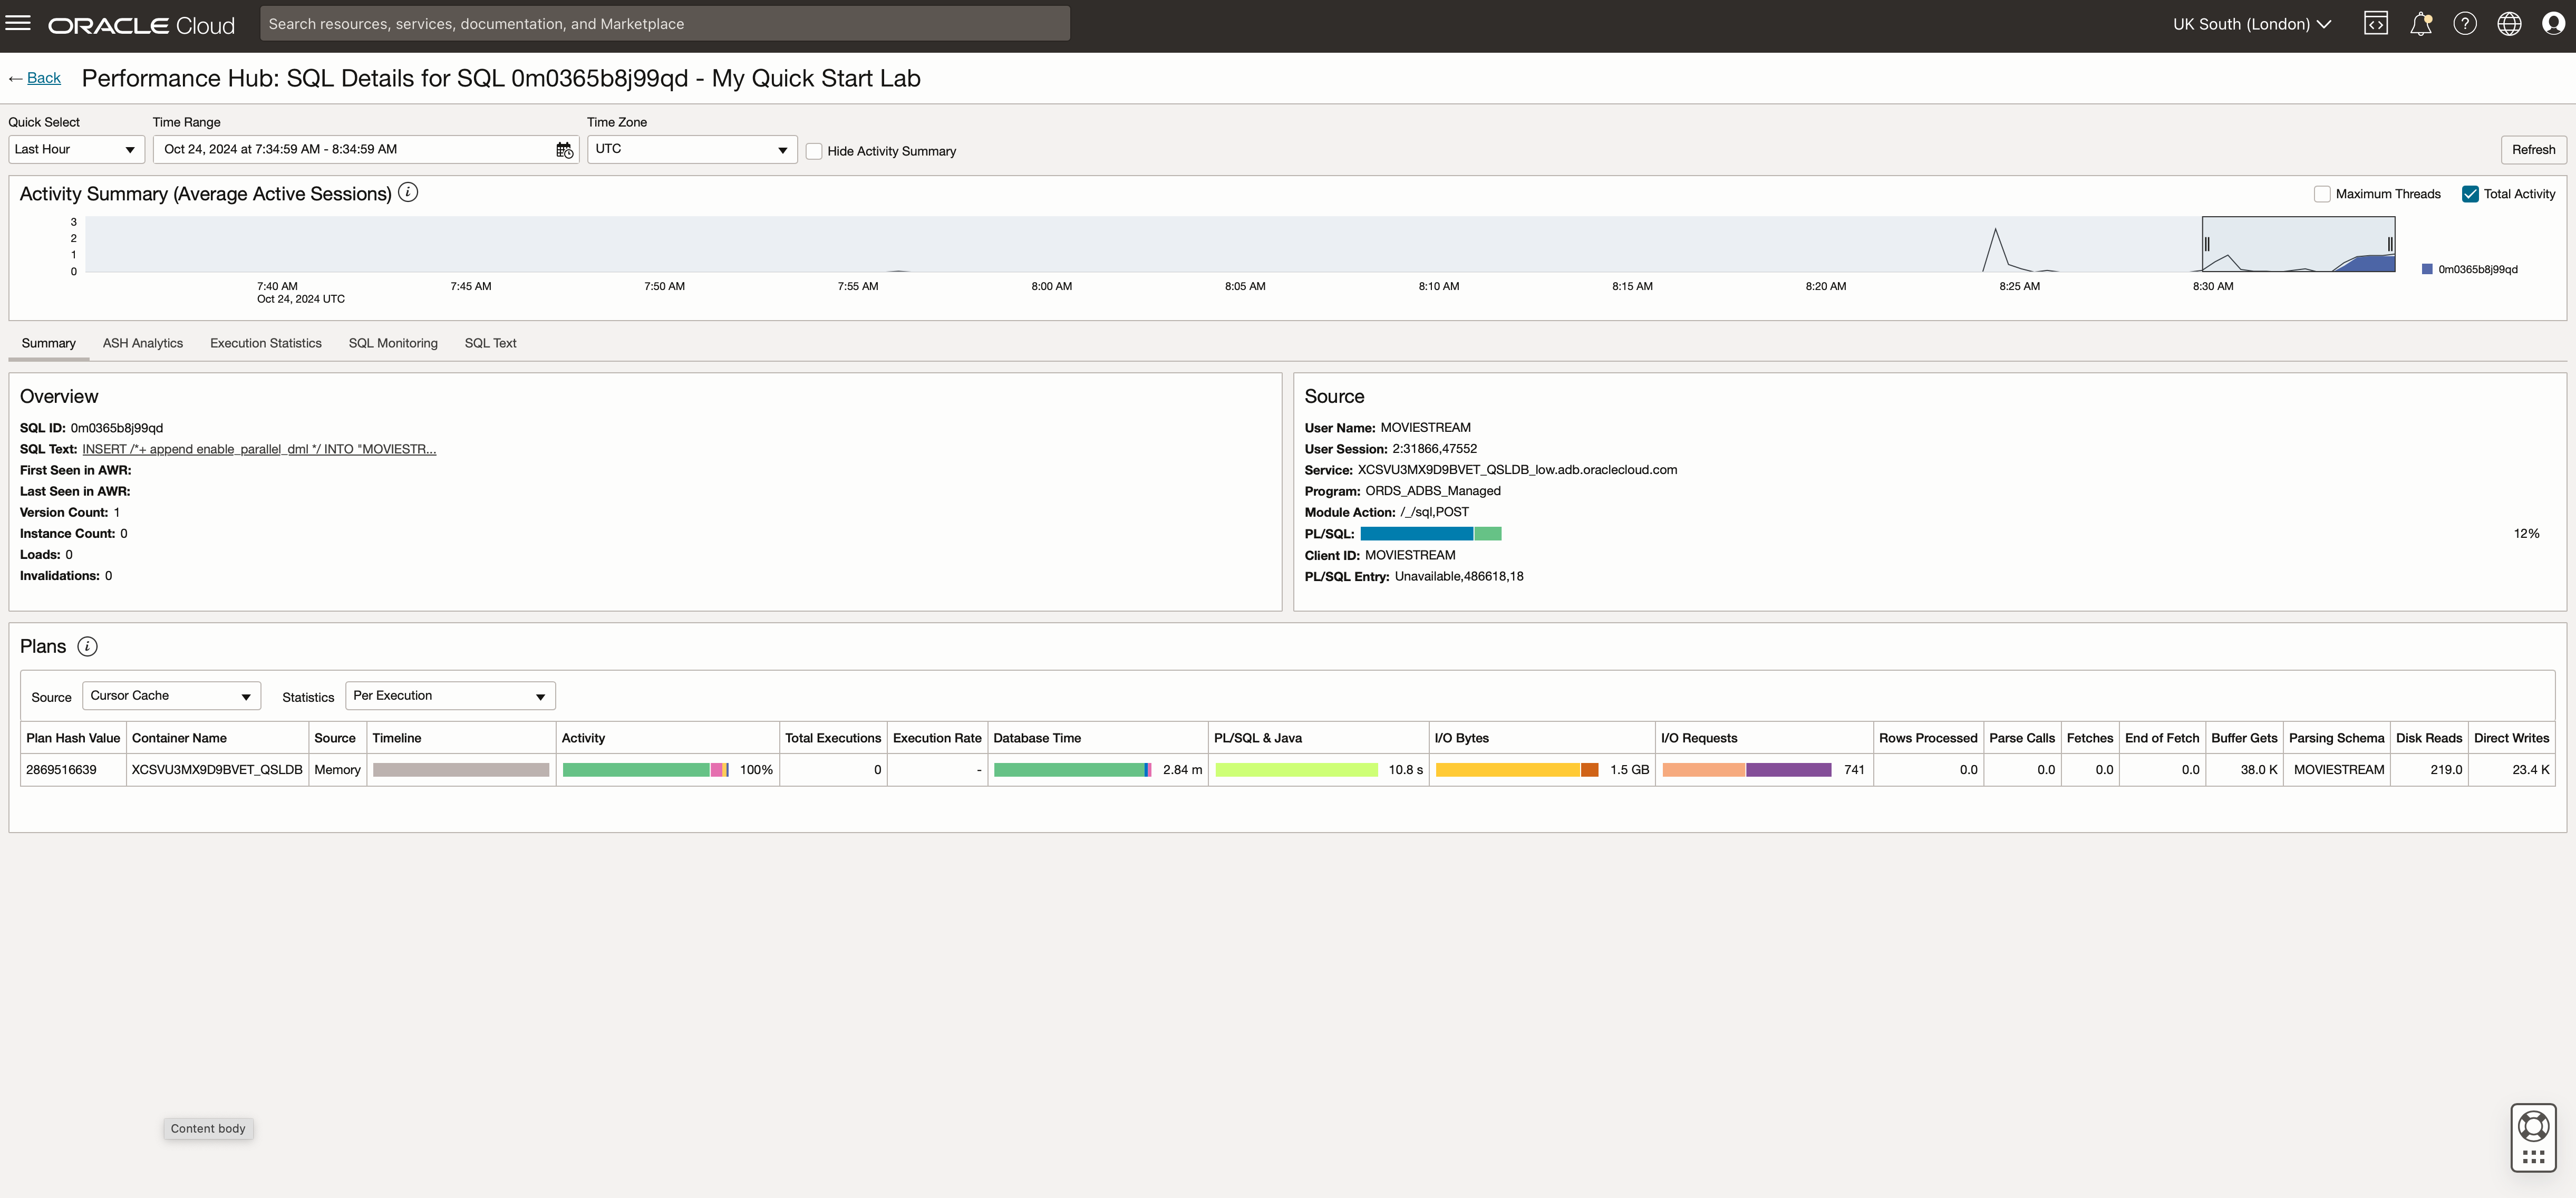
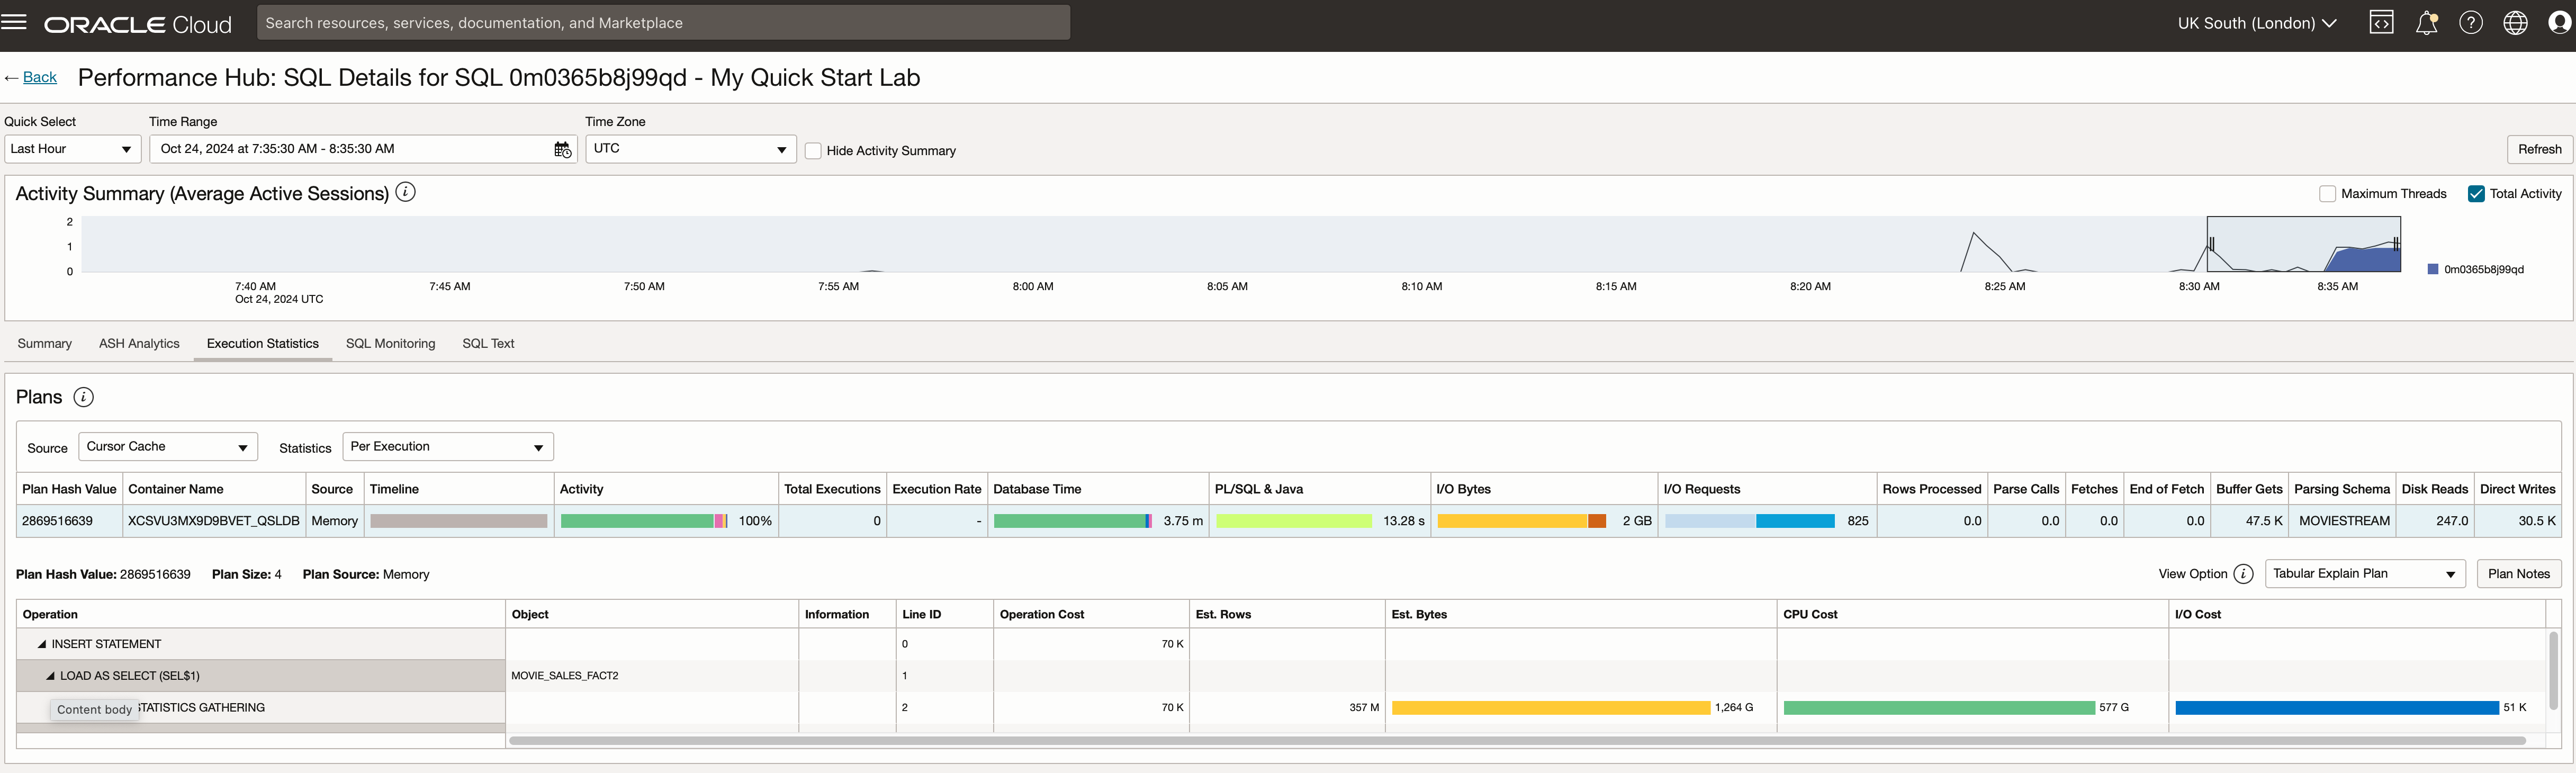
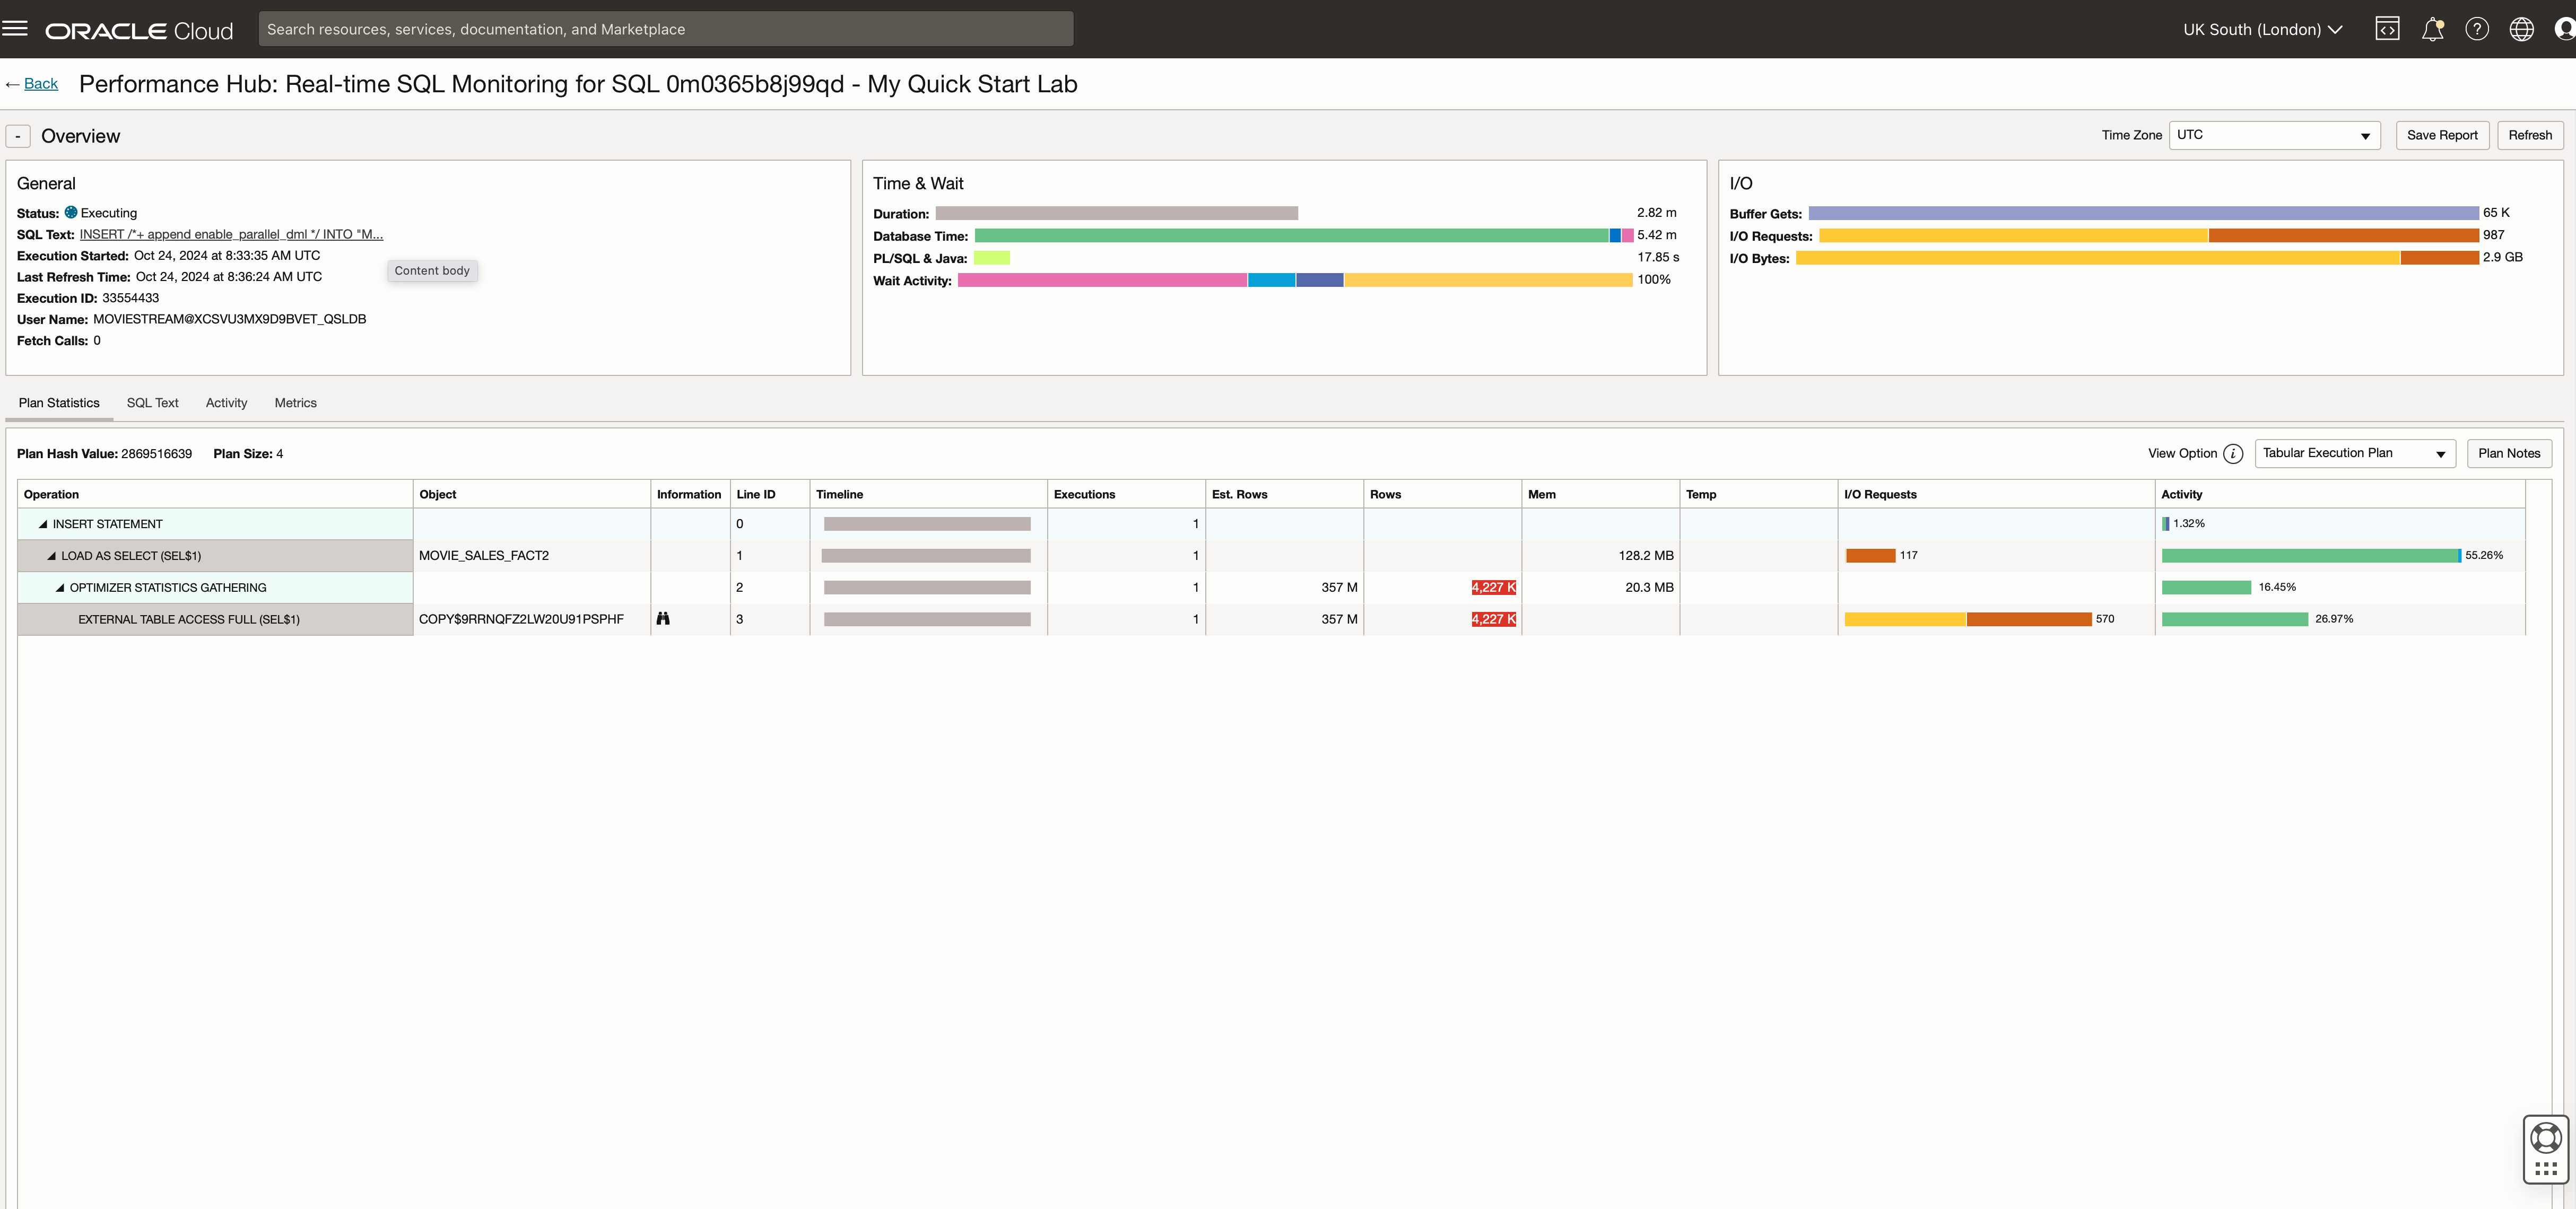
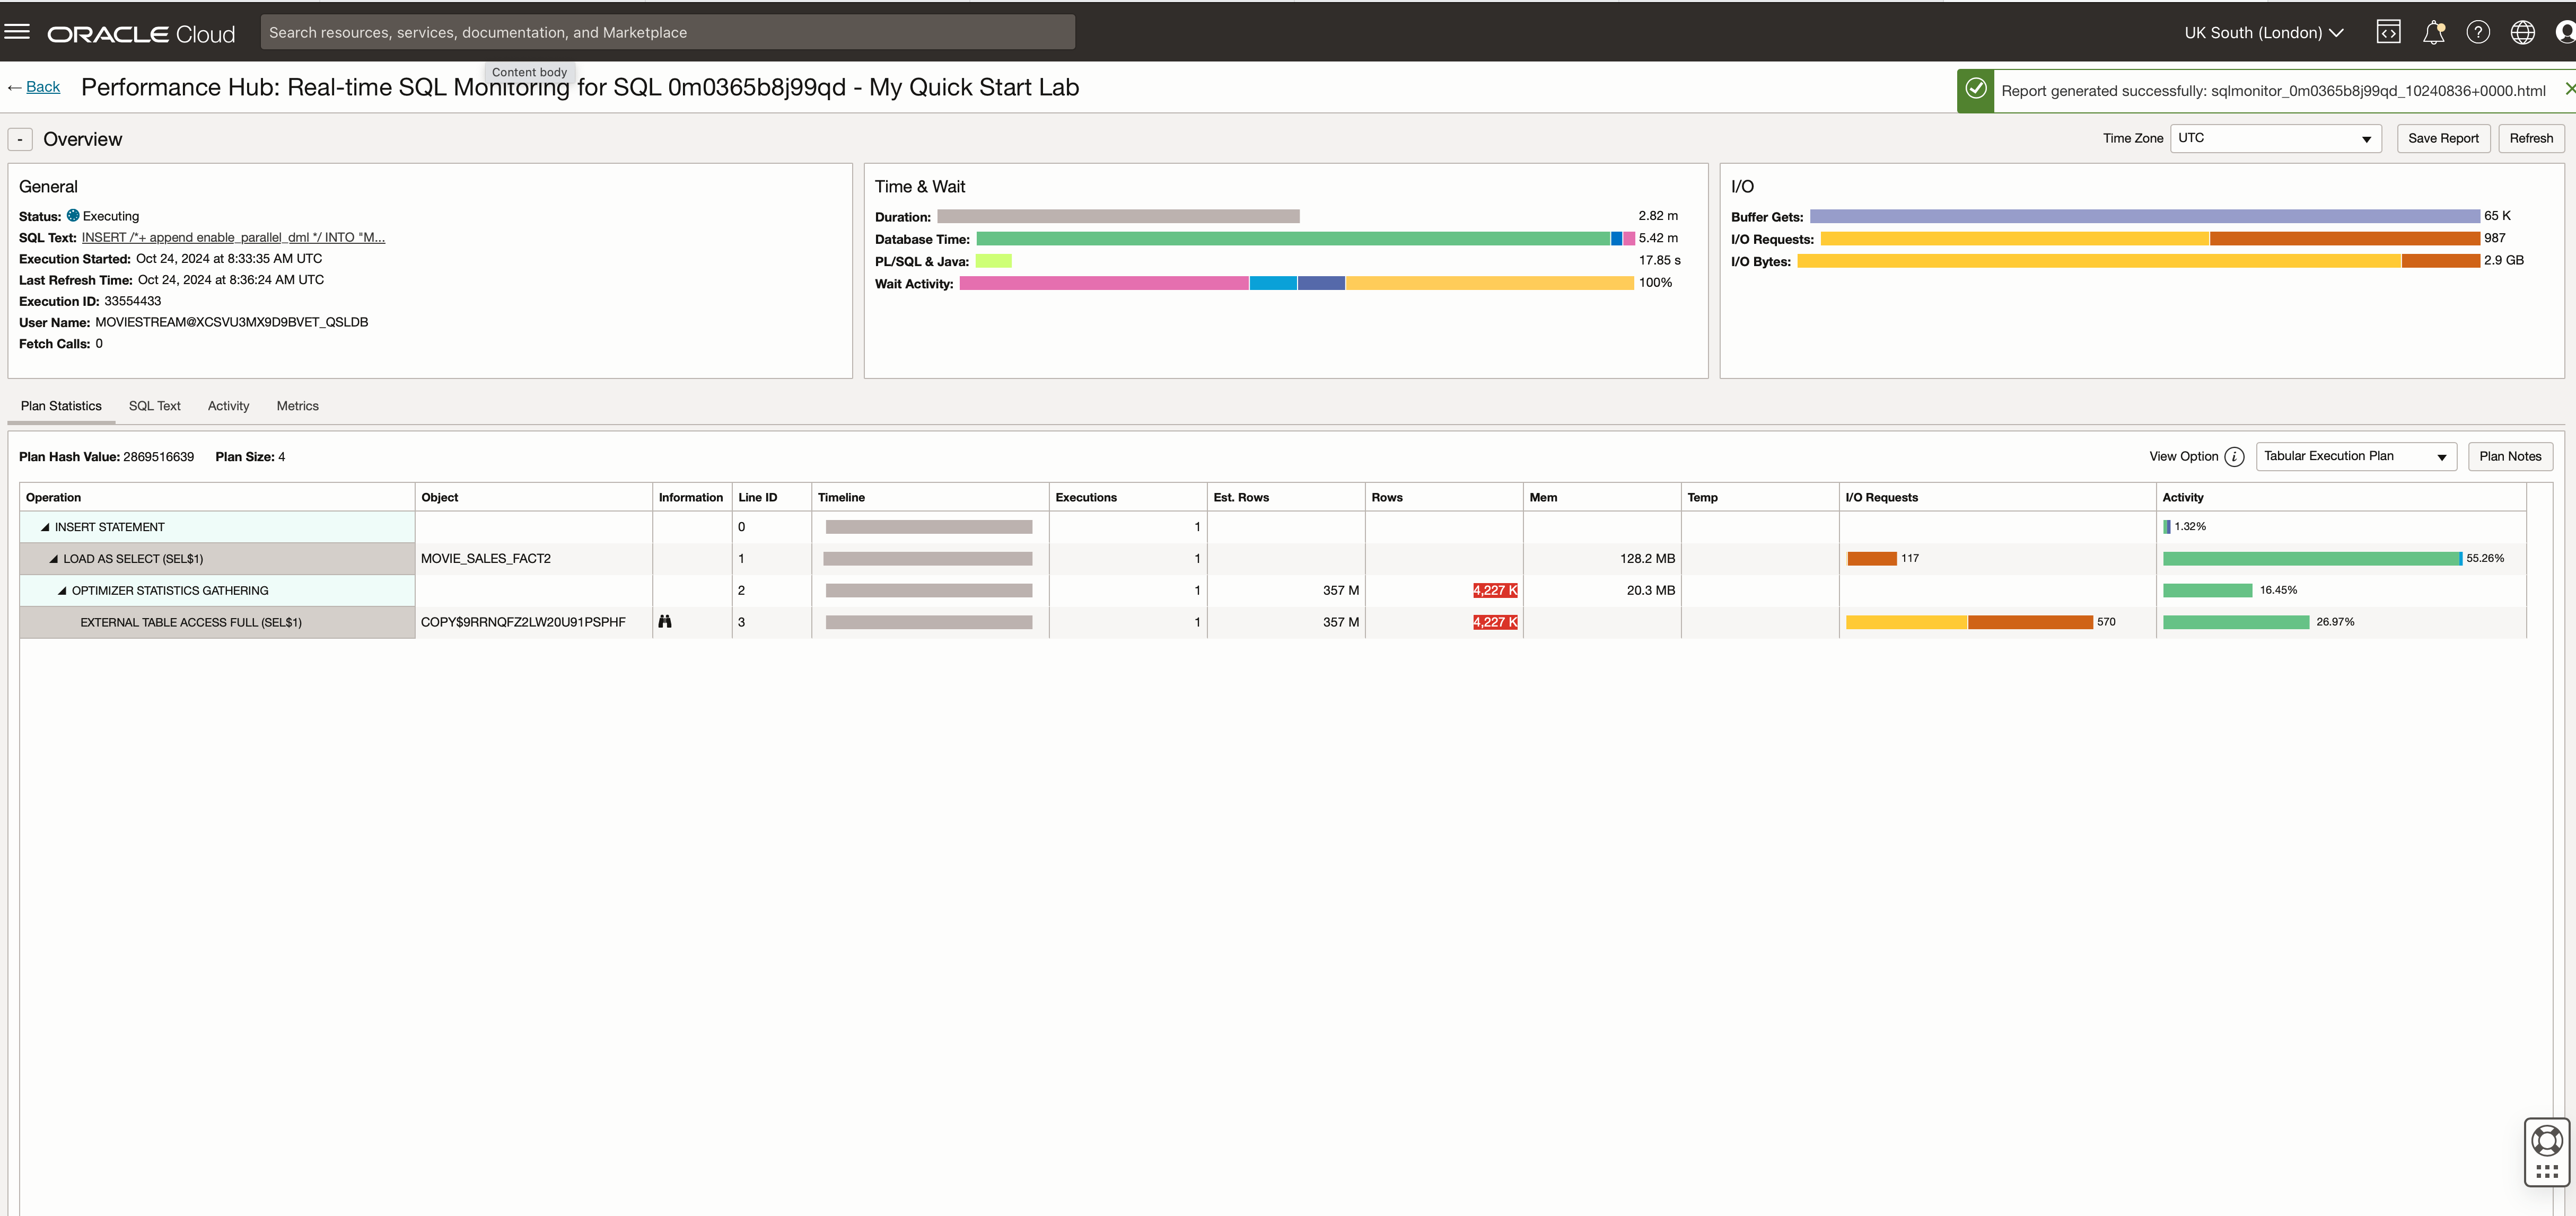
And keep drilling down into the details of how the database resources are being used to run the SQL:
And keep drilling down into the details of how the database resources are being used to run the SQL:
Can I get a high-level monitoring view of activity and resource usage from MY ADB instances?
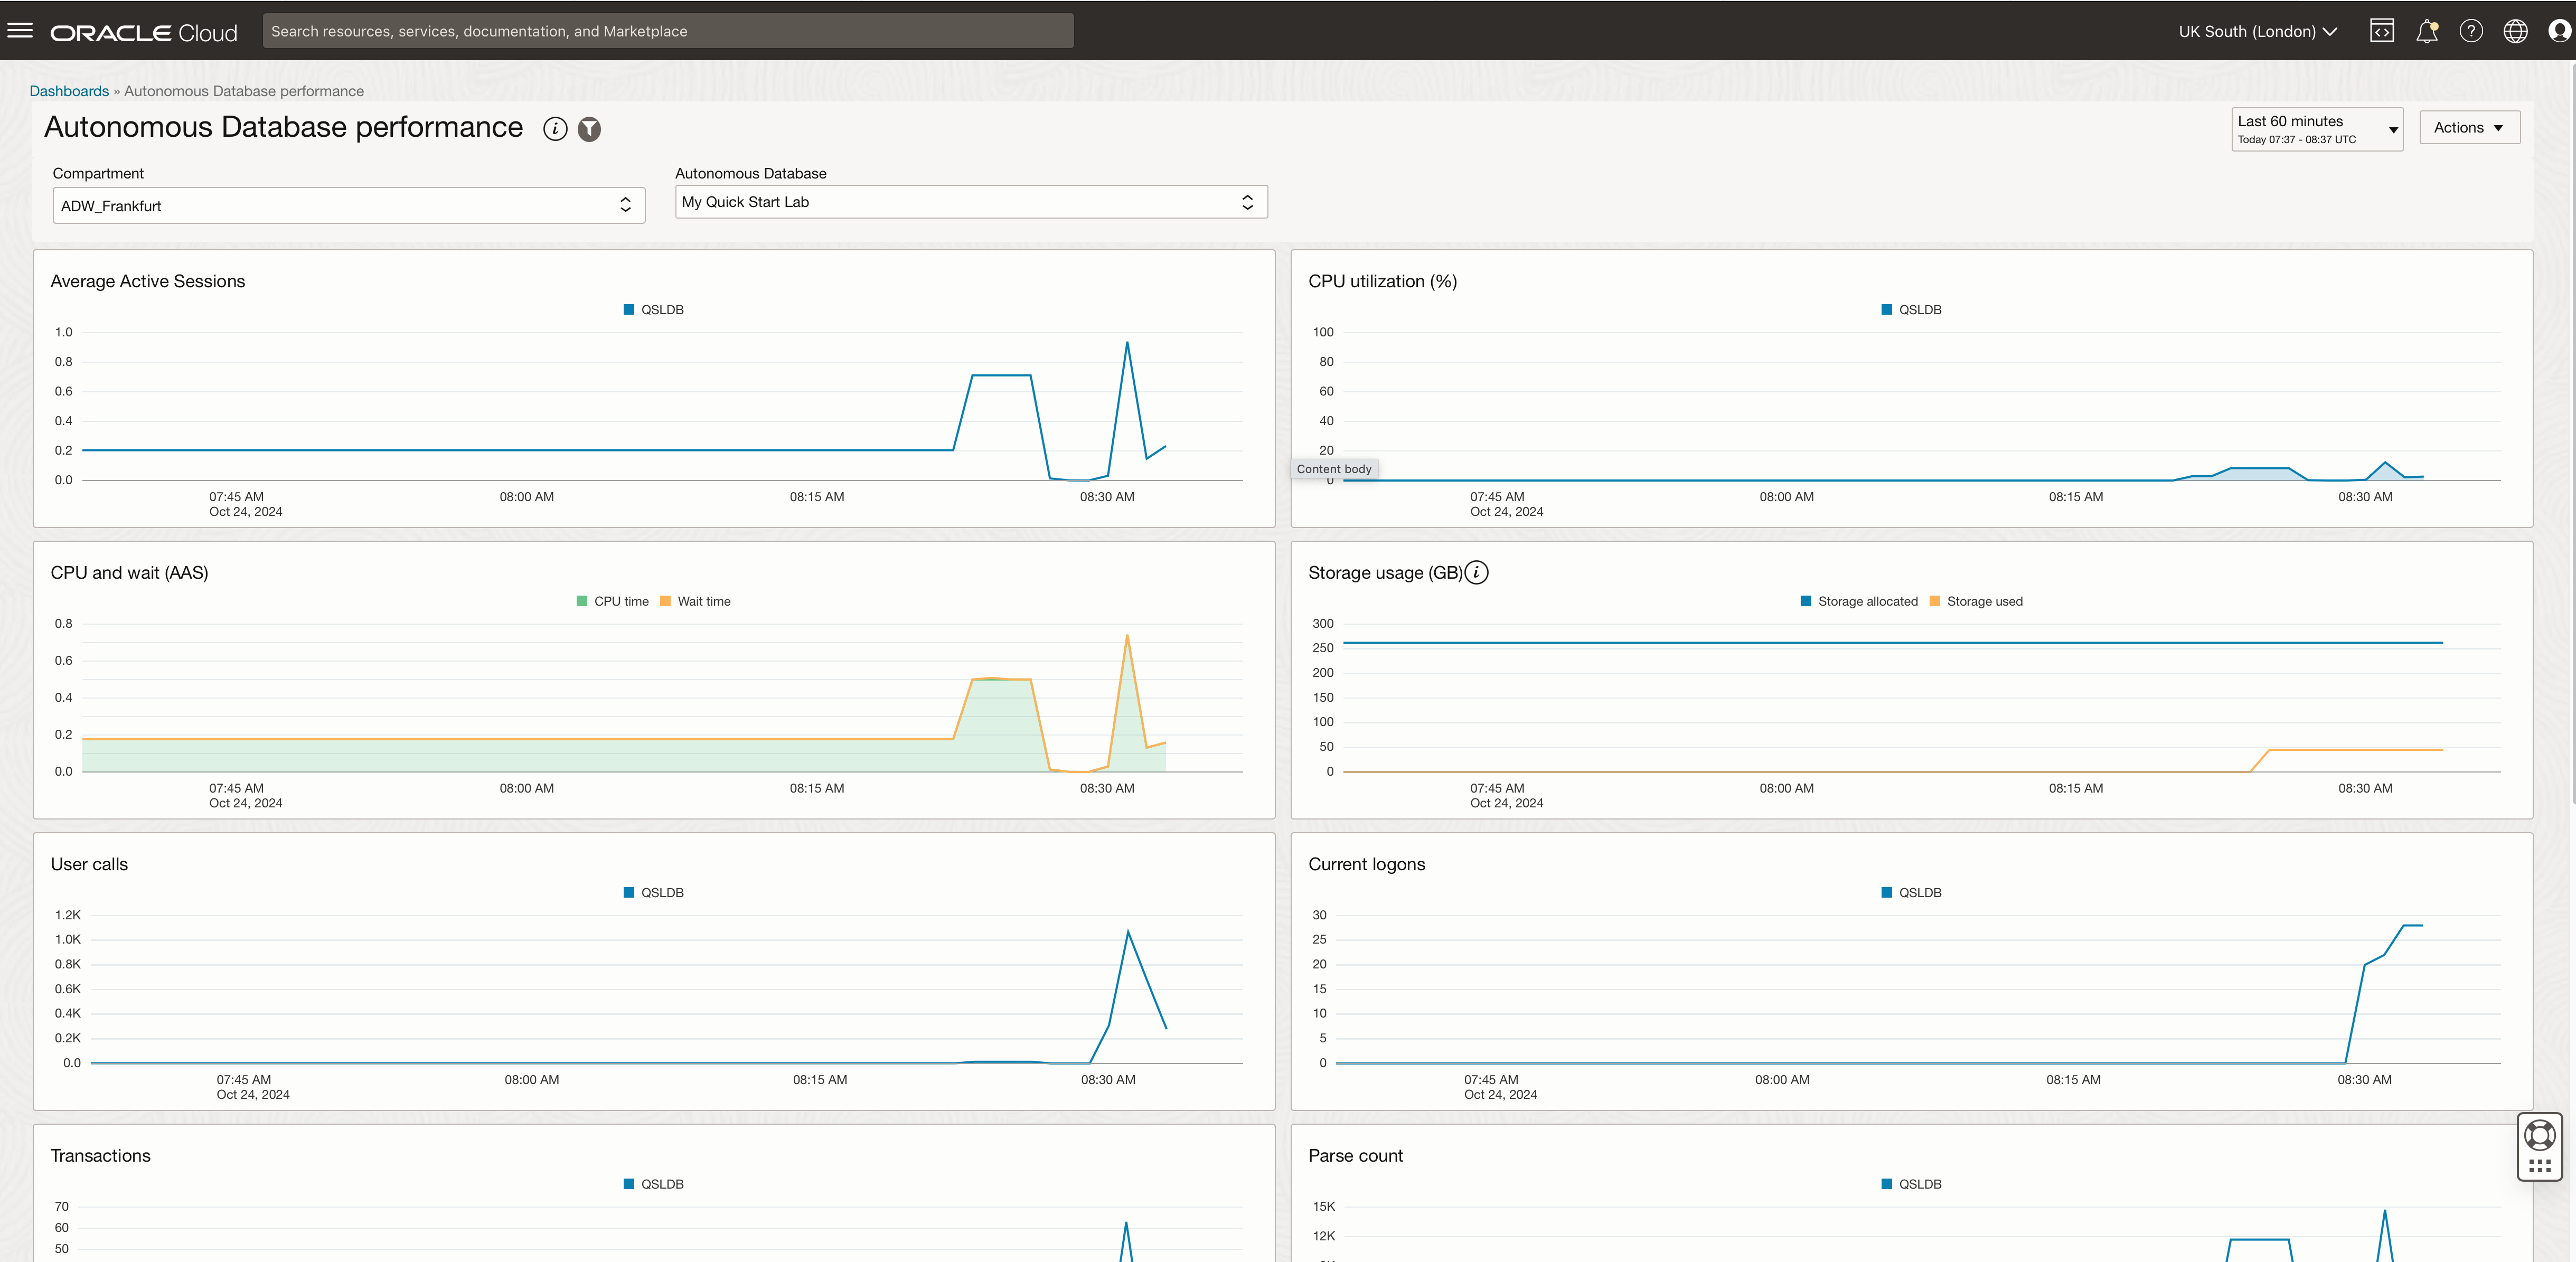
Yes. The summary page has a link to a prebuilt performance monitoring dashboard – clicking on the “Dashboards” button allows you to open that specific set of reports for the selected ADB instance.
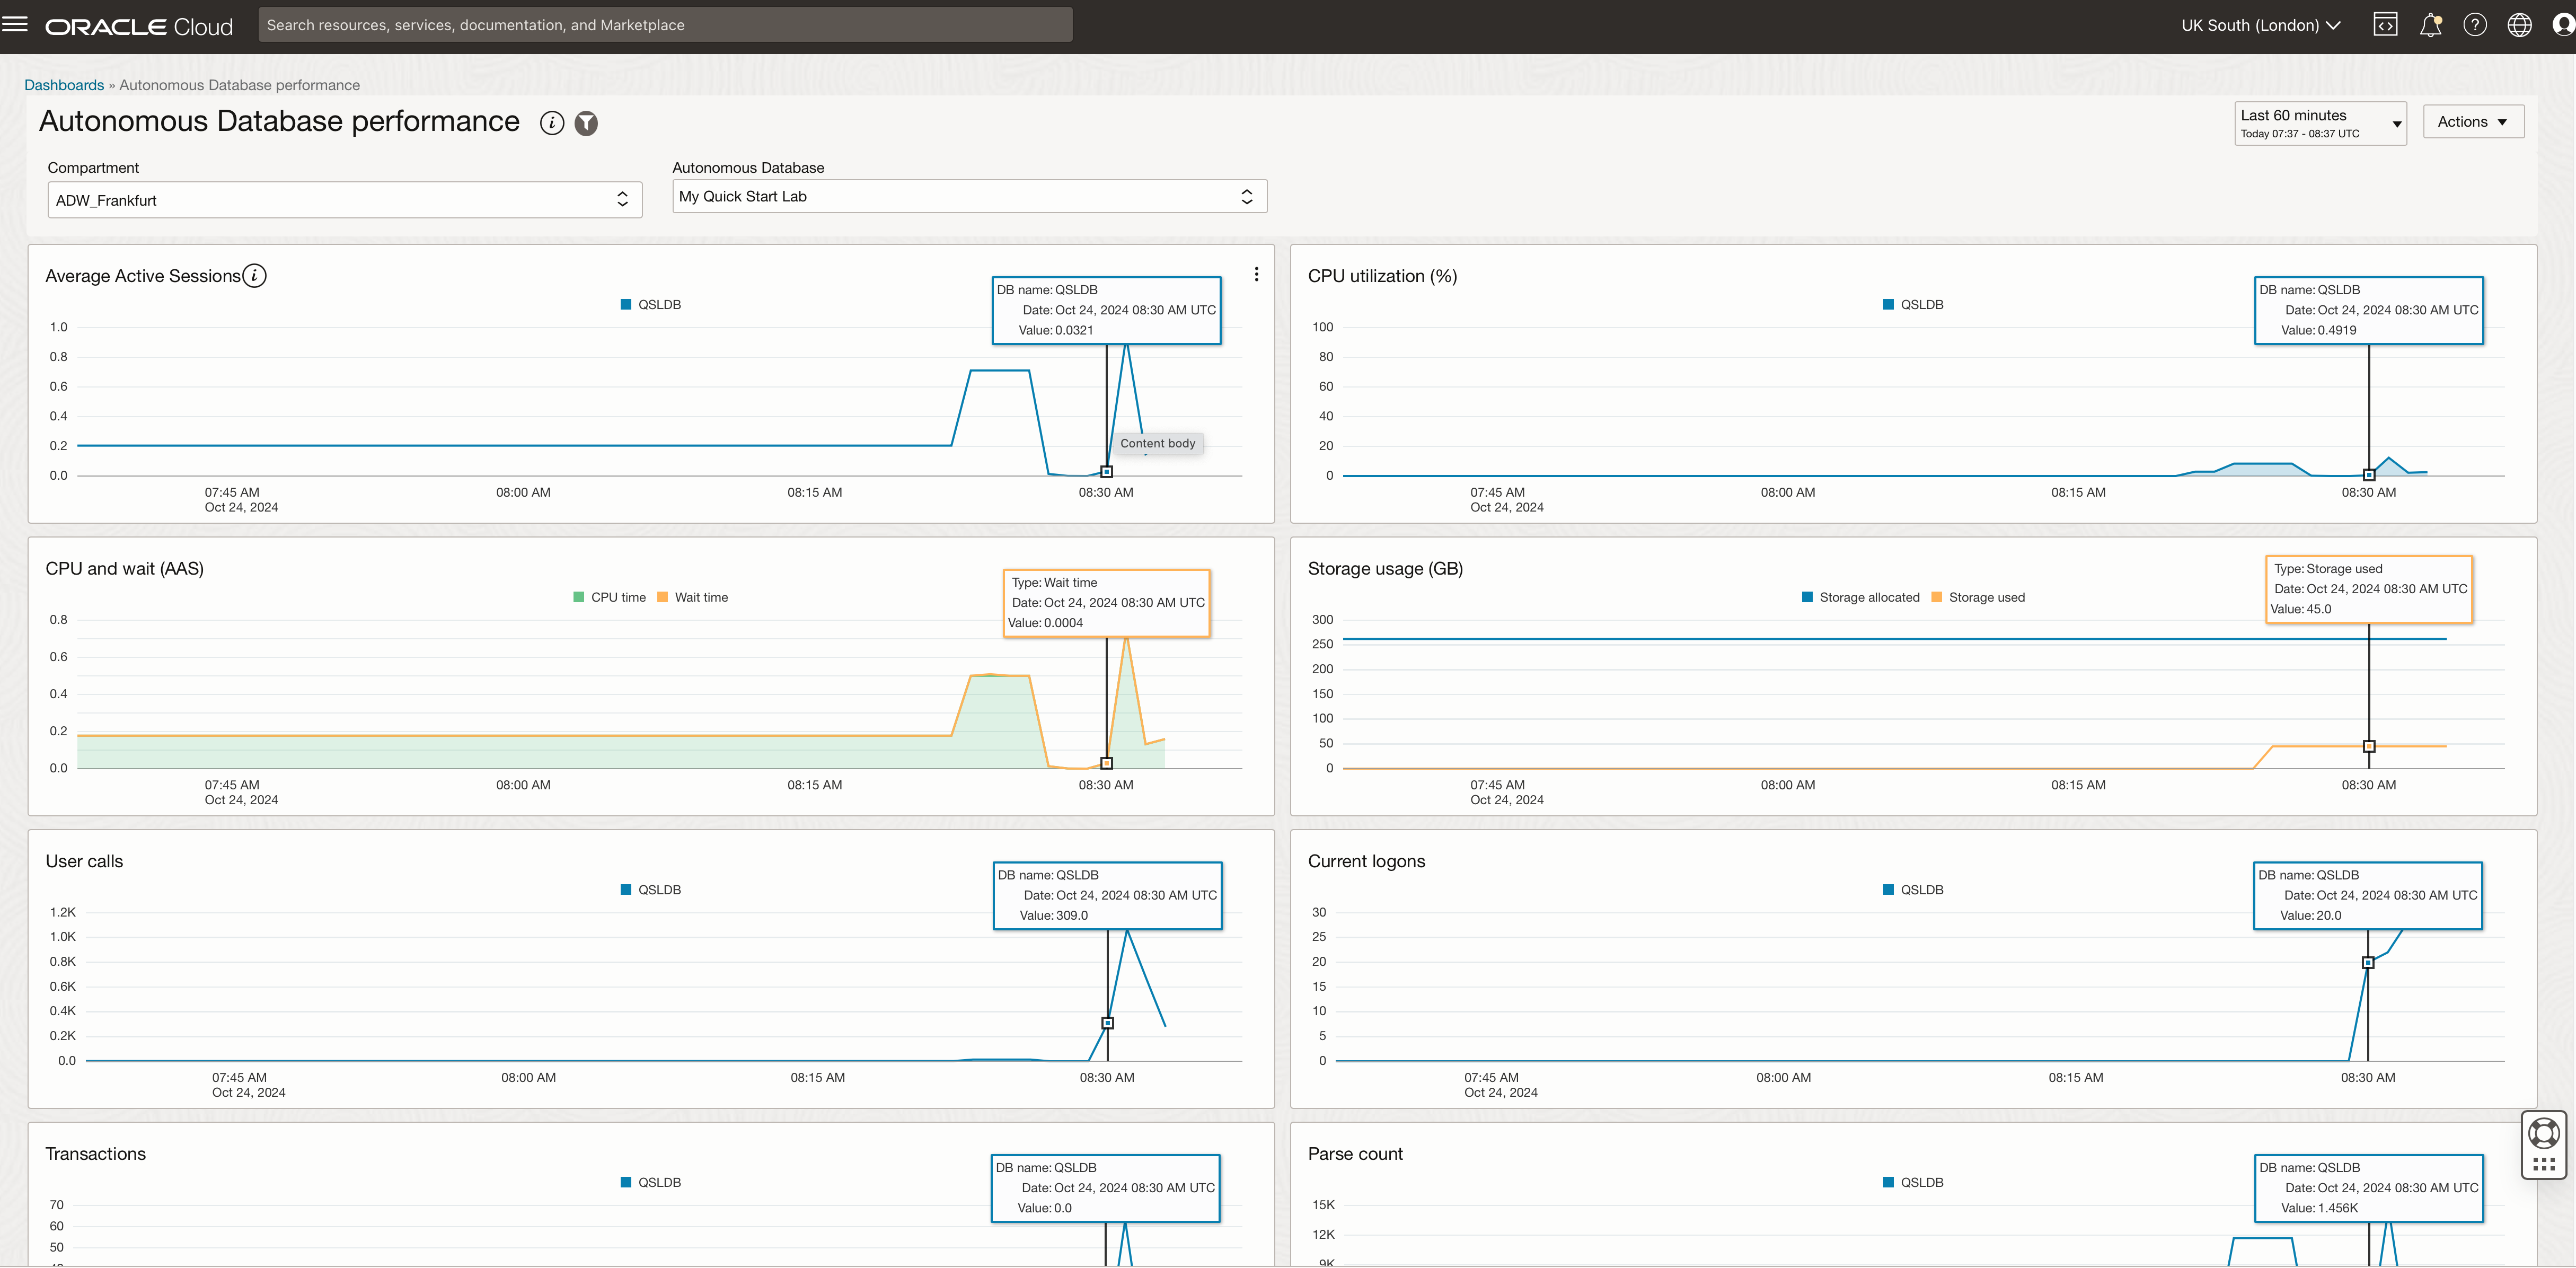
When you select a specific point in time on one of the graphs, a corresponding popup appears on all the other graphs, allowing you to cross-reference information across a range of different metrics. This helps you get more information about your ADB instance’s overall usage at a given time.
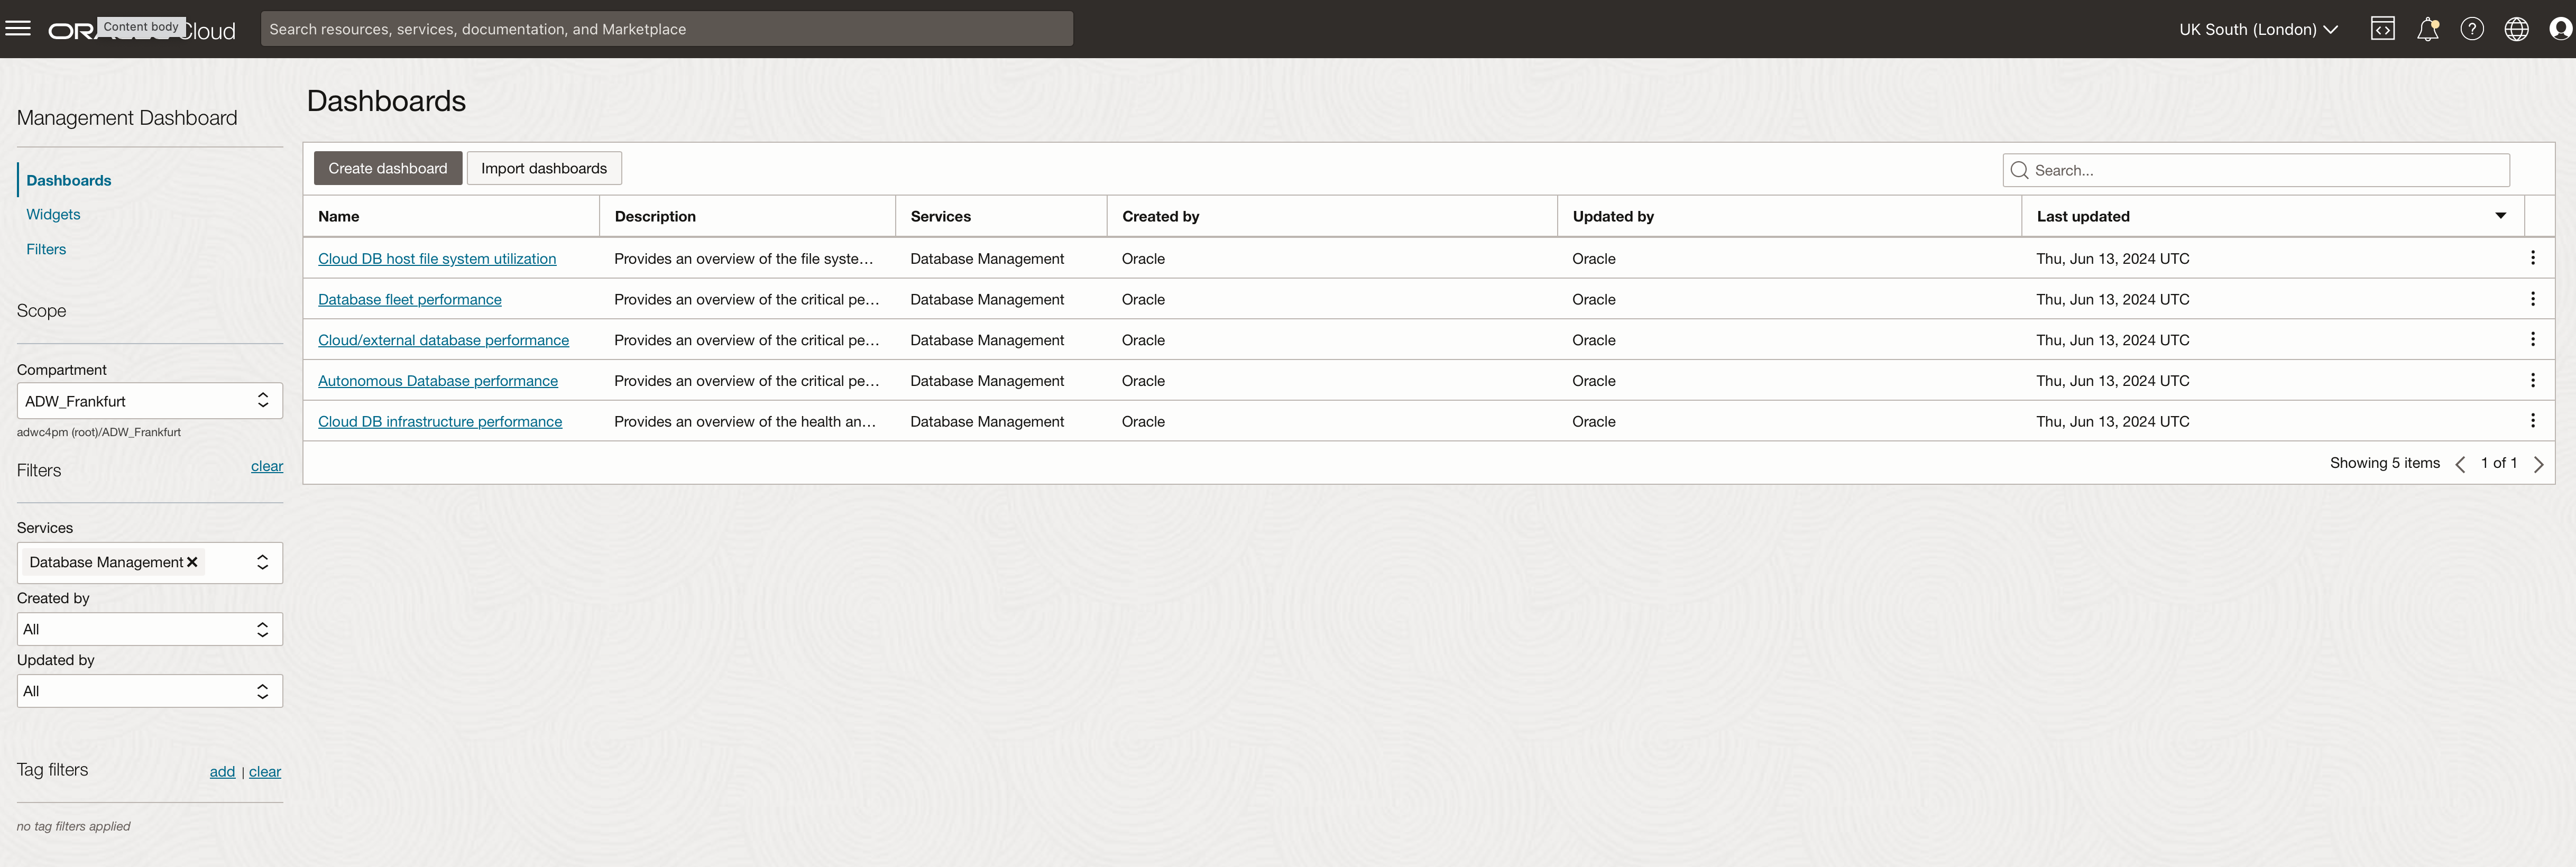
Can I create my own dashboard?
Yes. The “Create dashboard” button allows you to build a monitoring dashboard. The UI is simple, and you can drag and drop graphs and filter widgets onto a canvas.
Why doesn’t SQL Insights work on my ADB instance?
If all the graphs on the SQL Insights page show “no data to display,” the most likely reason is that your ADB instance is on a public endpoint. It must be configured to use a private endpoint to enable complete SQL monitoring of an ADB instance. Once that is in place, the menu structure within the Database Management service will subtly change, and more menu choices will become available.
The following screenshot shows that the menu options for performance monitoring are slightly different because I can now access more advanced levels of monitoring.
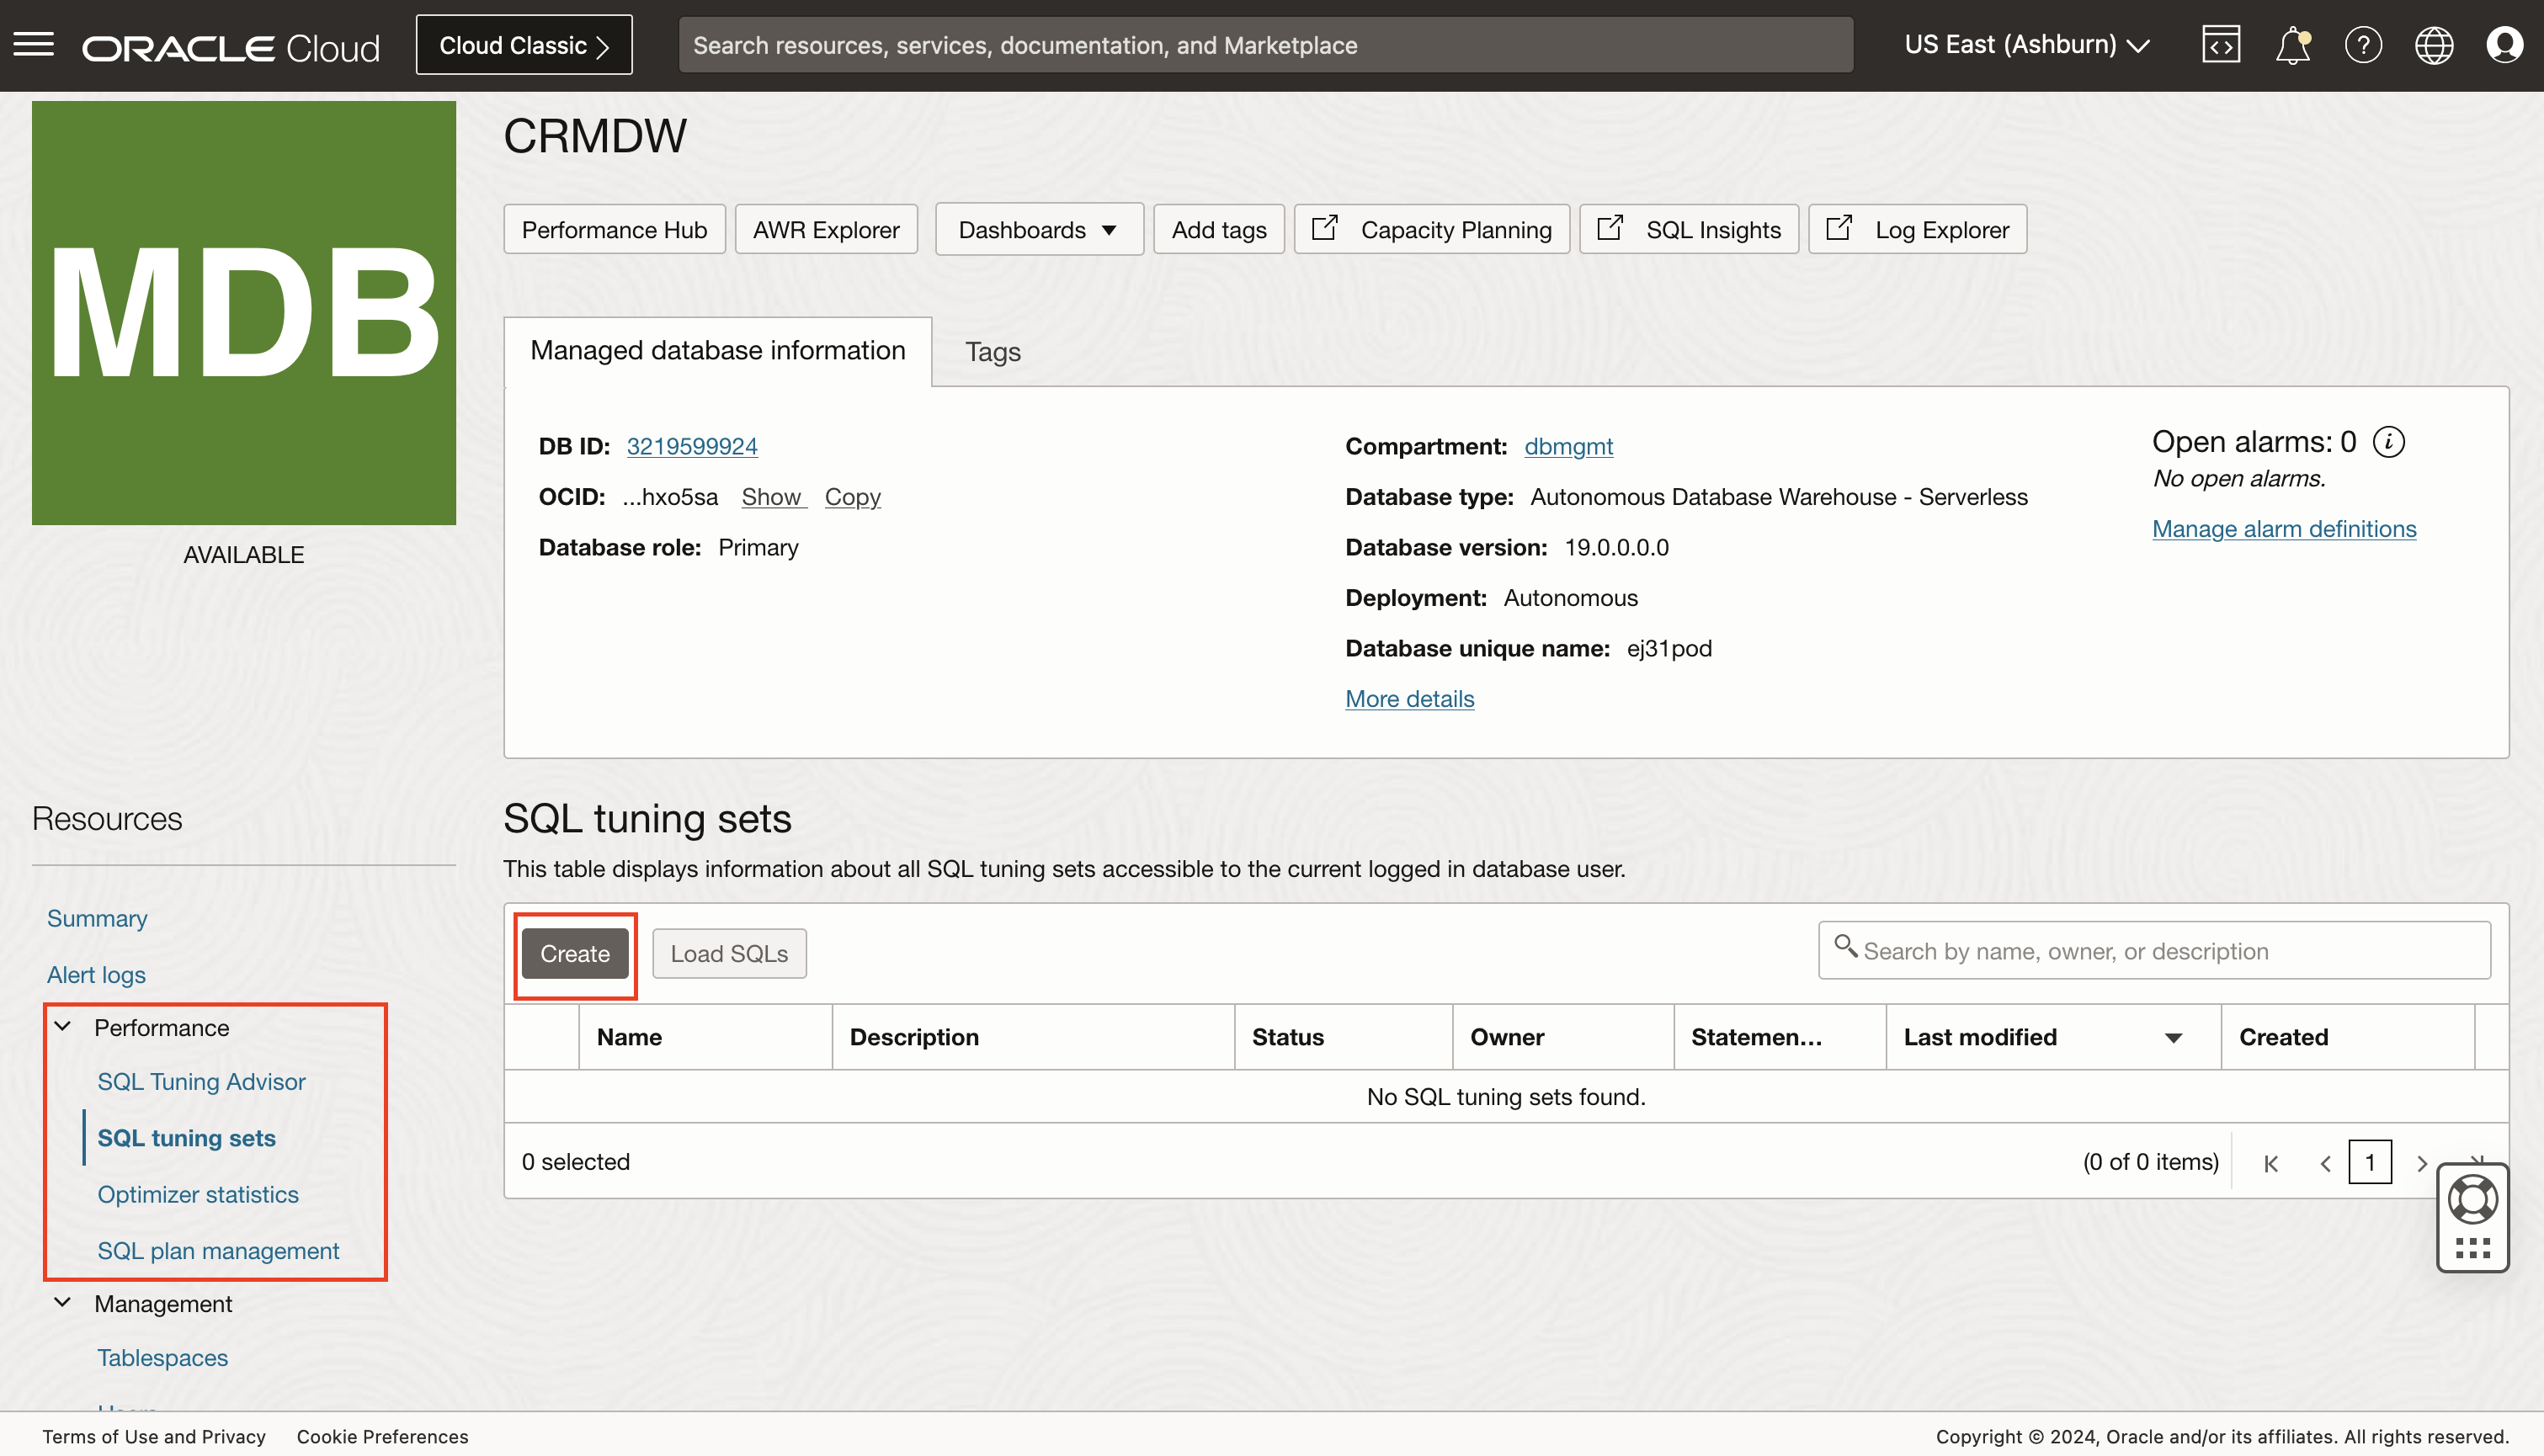
Can I monitor my workload rather than individual SQL statements?
Yes. You need to use the SQL Tuning Sets feature. You must create an SQL tuning set for your workload to get started. There is a walkthrough of this process in this blog post by my colleague Derik Harlow, Senior Product Manager in the Database Management service team. As described earlier in this post, you can think of an SQL Tuning Set as a concept similar to creating a database group within the Database Management service. My colleague Ulrike Schwinn, a Distinguished Data Management Expert, wrote an excellent overview of tuning sets; see here.
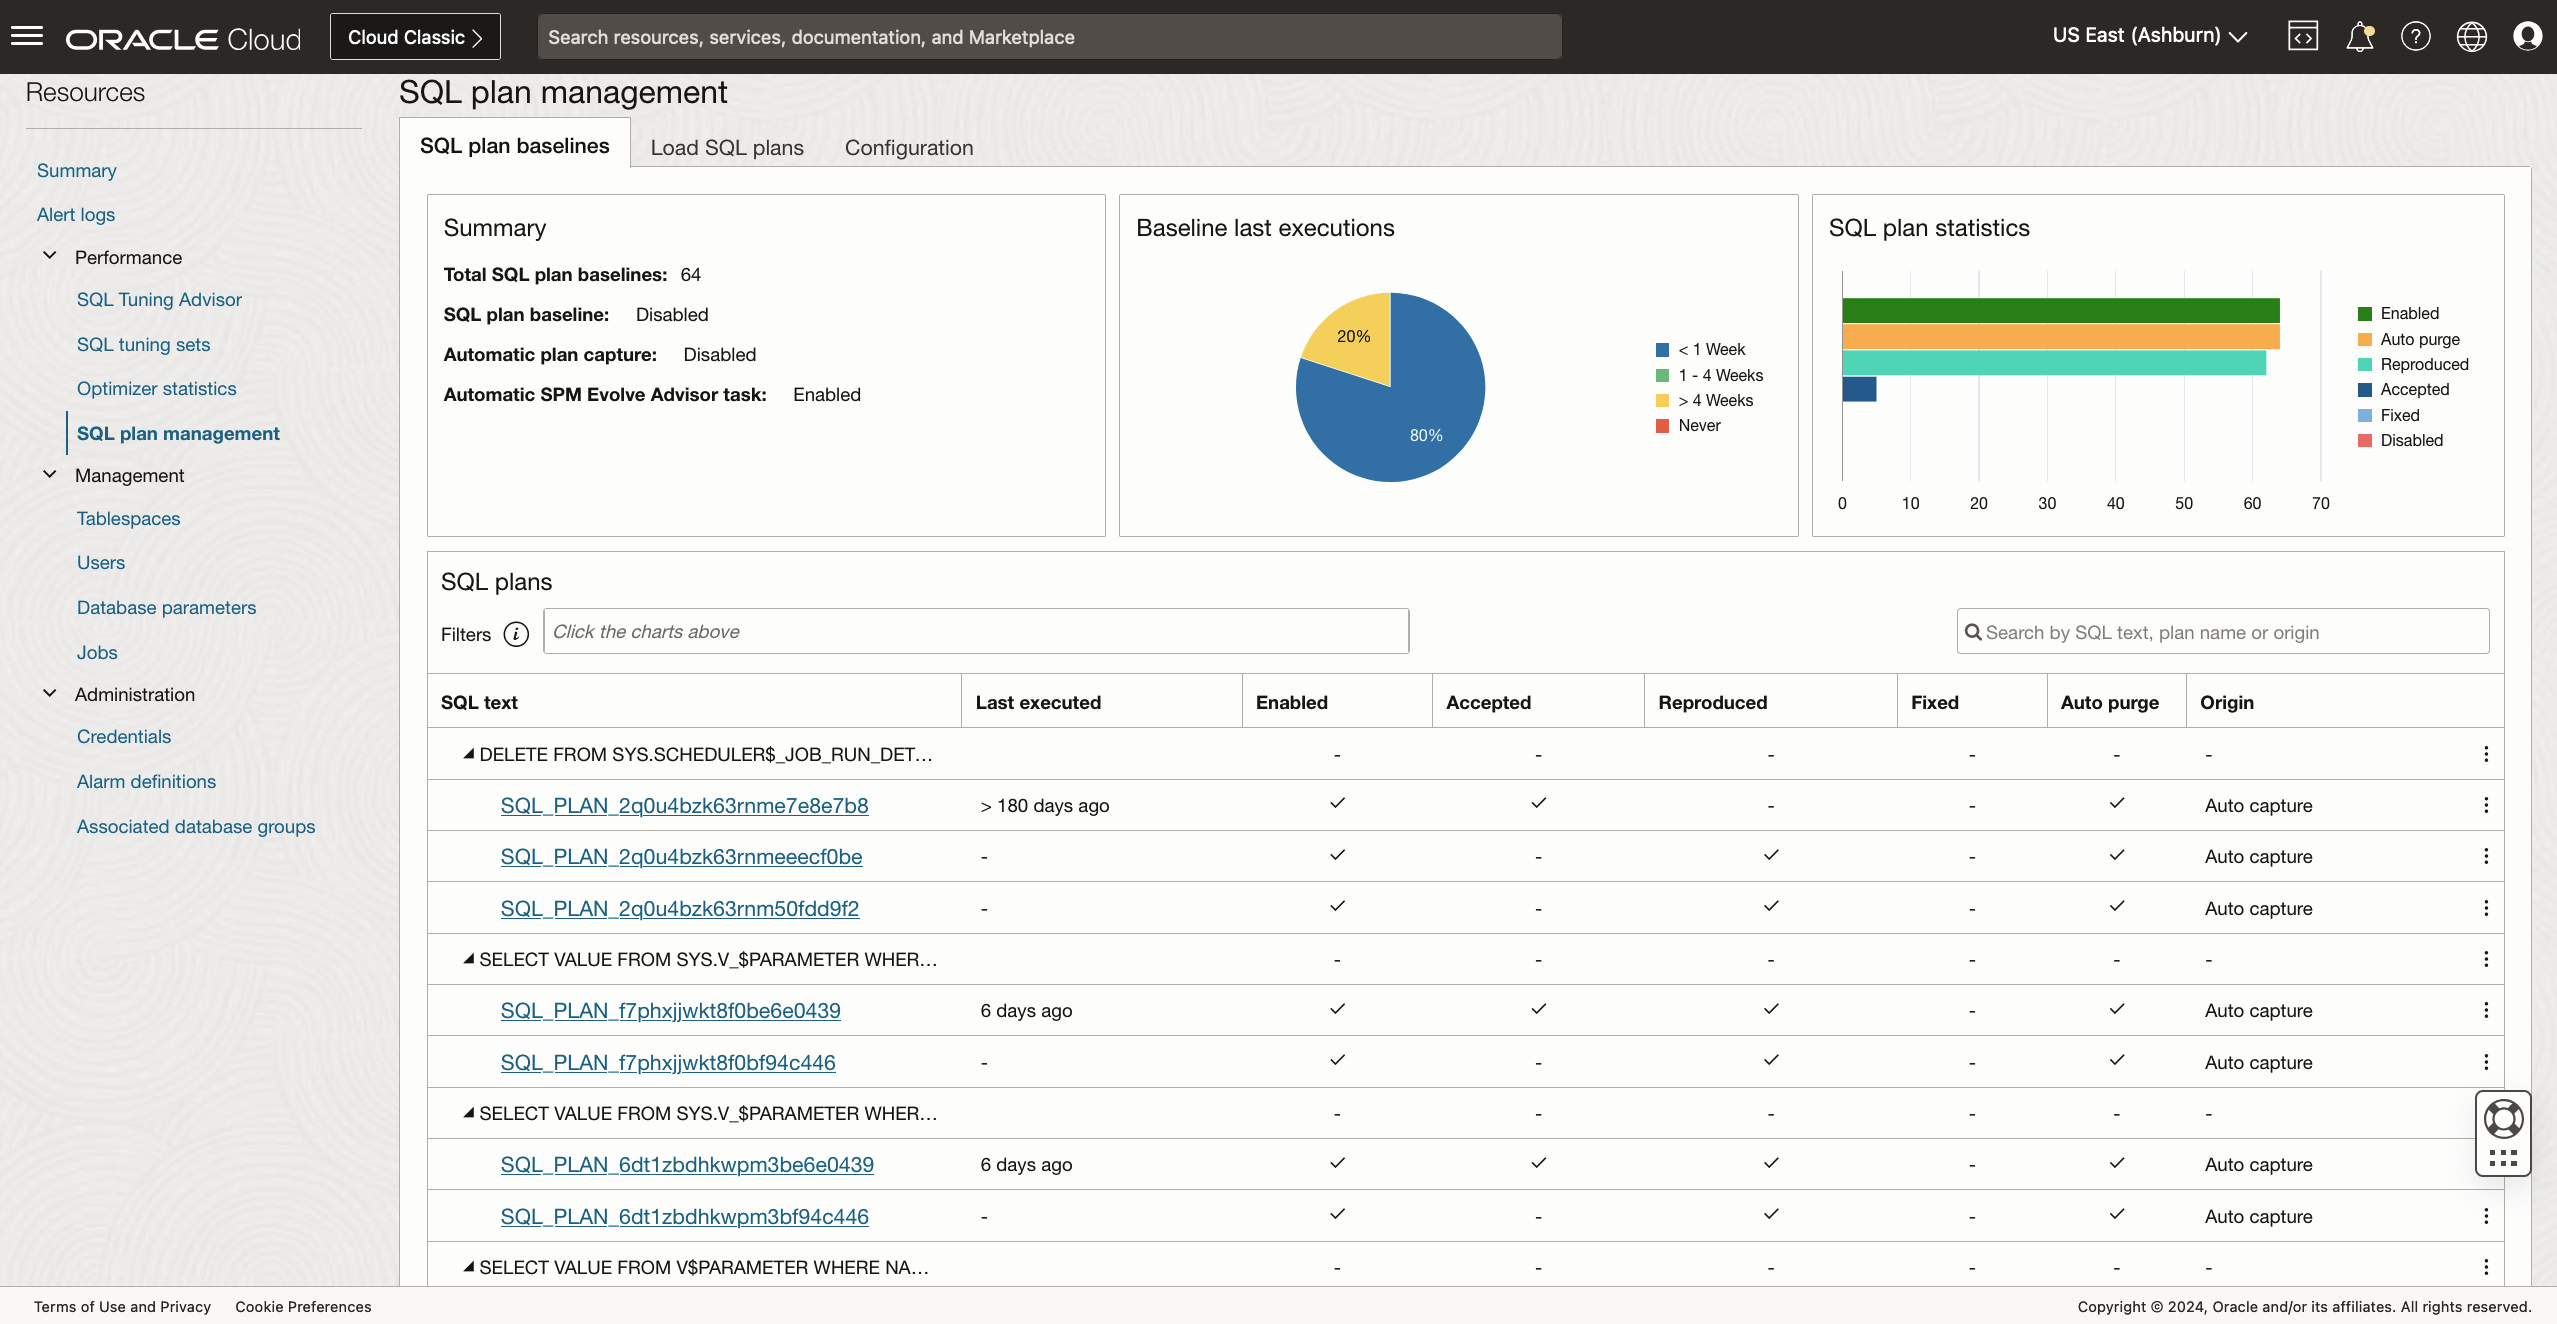
Once created, you can utilize the SQL Plan Management feature to assess the current configuration of SQL profiles running in your ADB. Rich visualizations provide quick analysis of the overall performance of plans, such as how often they are executed and running in the ADB.
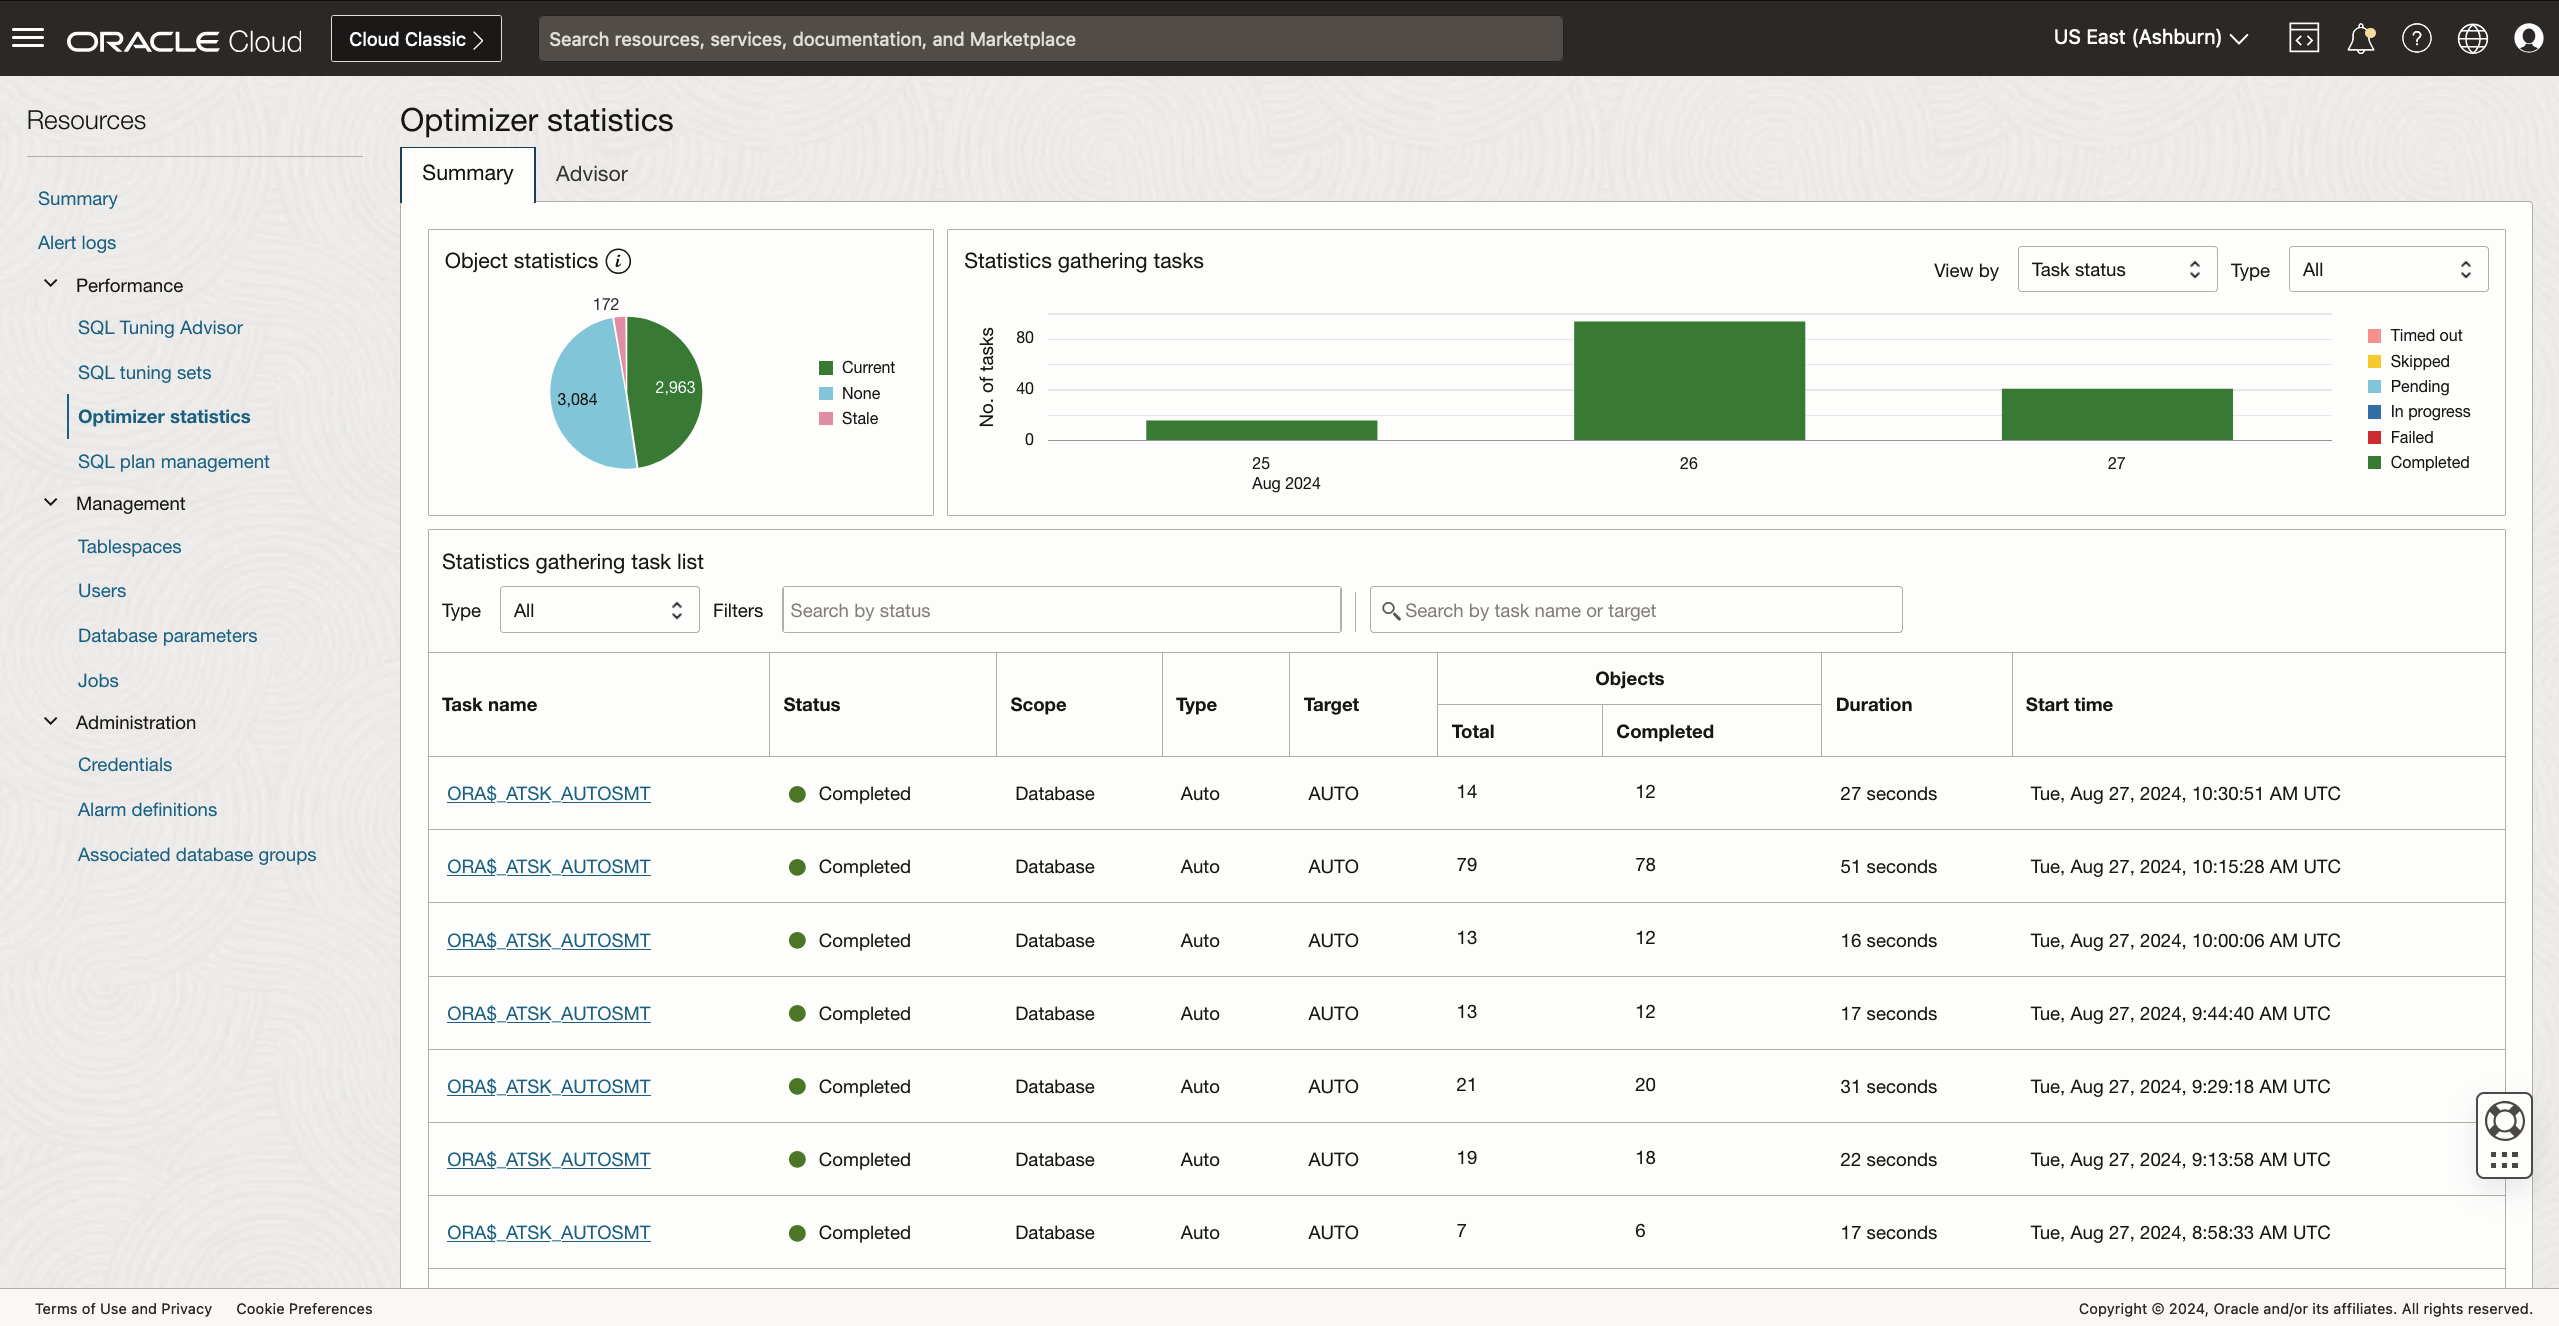
How do I check on the status of the optimizer statistics?
The Optimizer Statistics feature provides a detailed analysis of the statistics collections of your database’s objects. Without up-to-date statistics, the Optimizer cannot provide the best SQL plans for accessing the data in the underlying tables.
How do I automate the monitoring of my ADB instances?
You can use the Administration section – Alarms definitions on the left side of the Database Management console to create alarms for specific metrics.
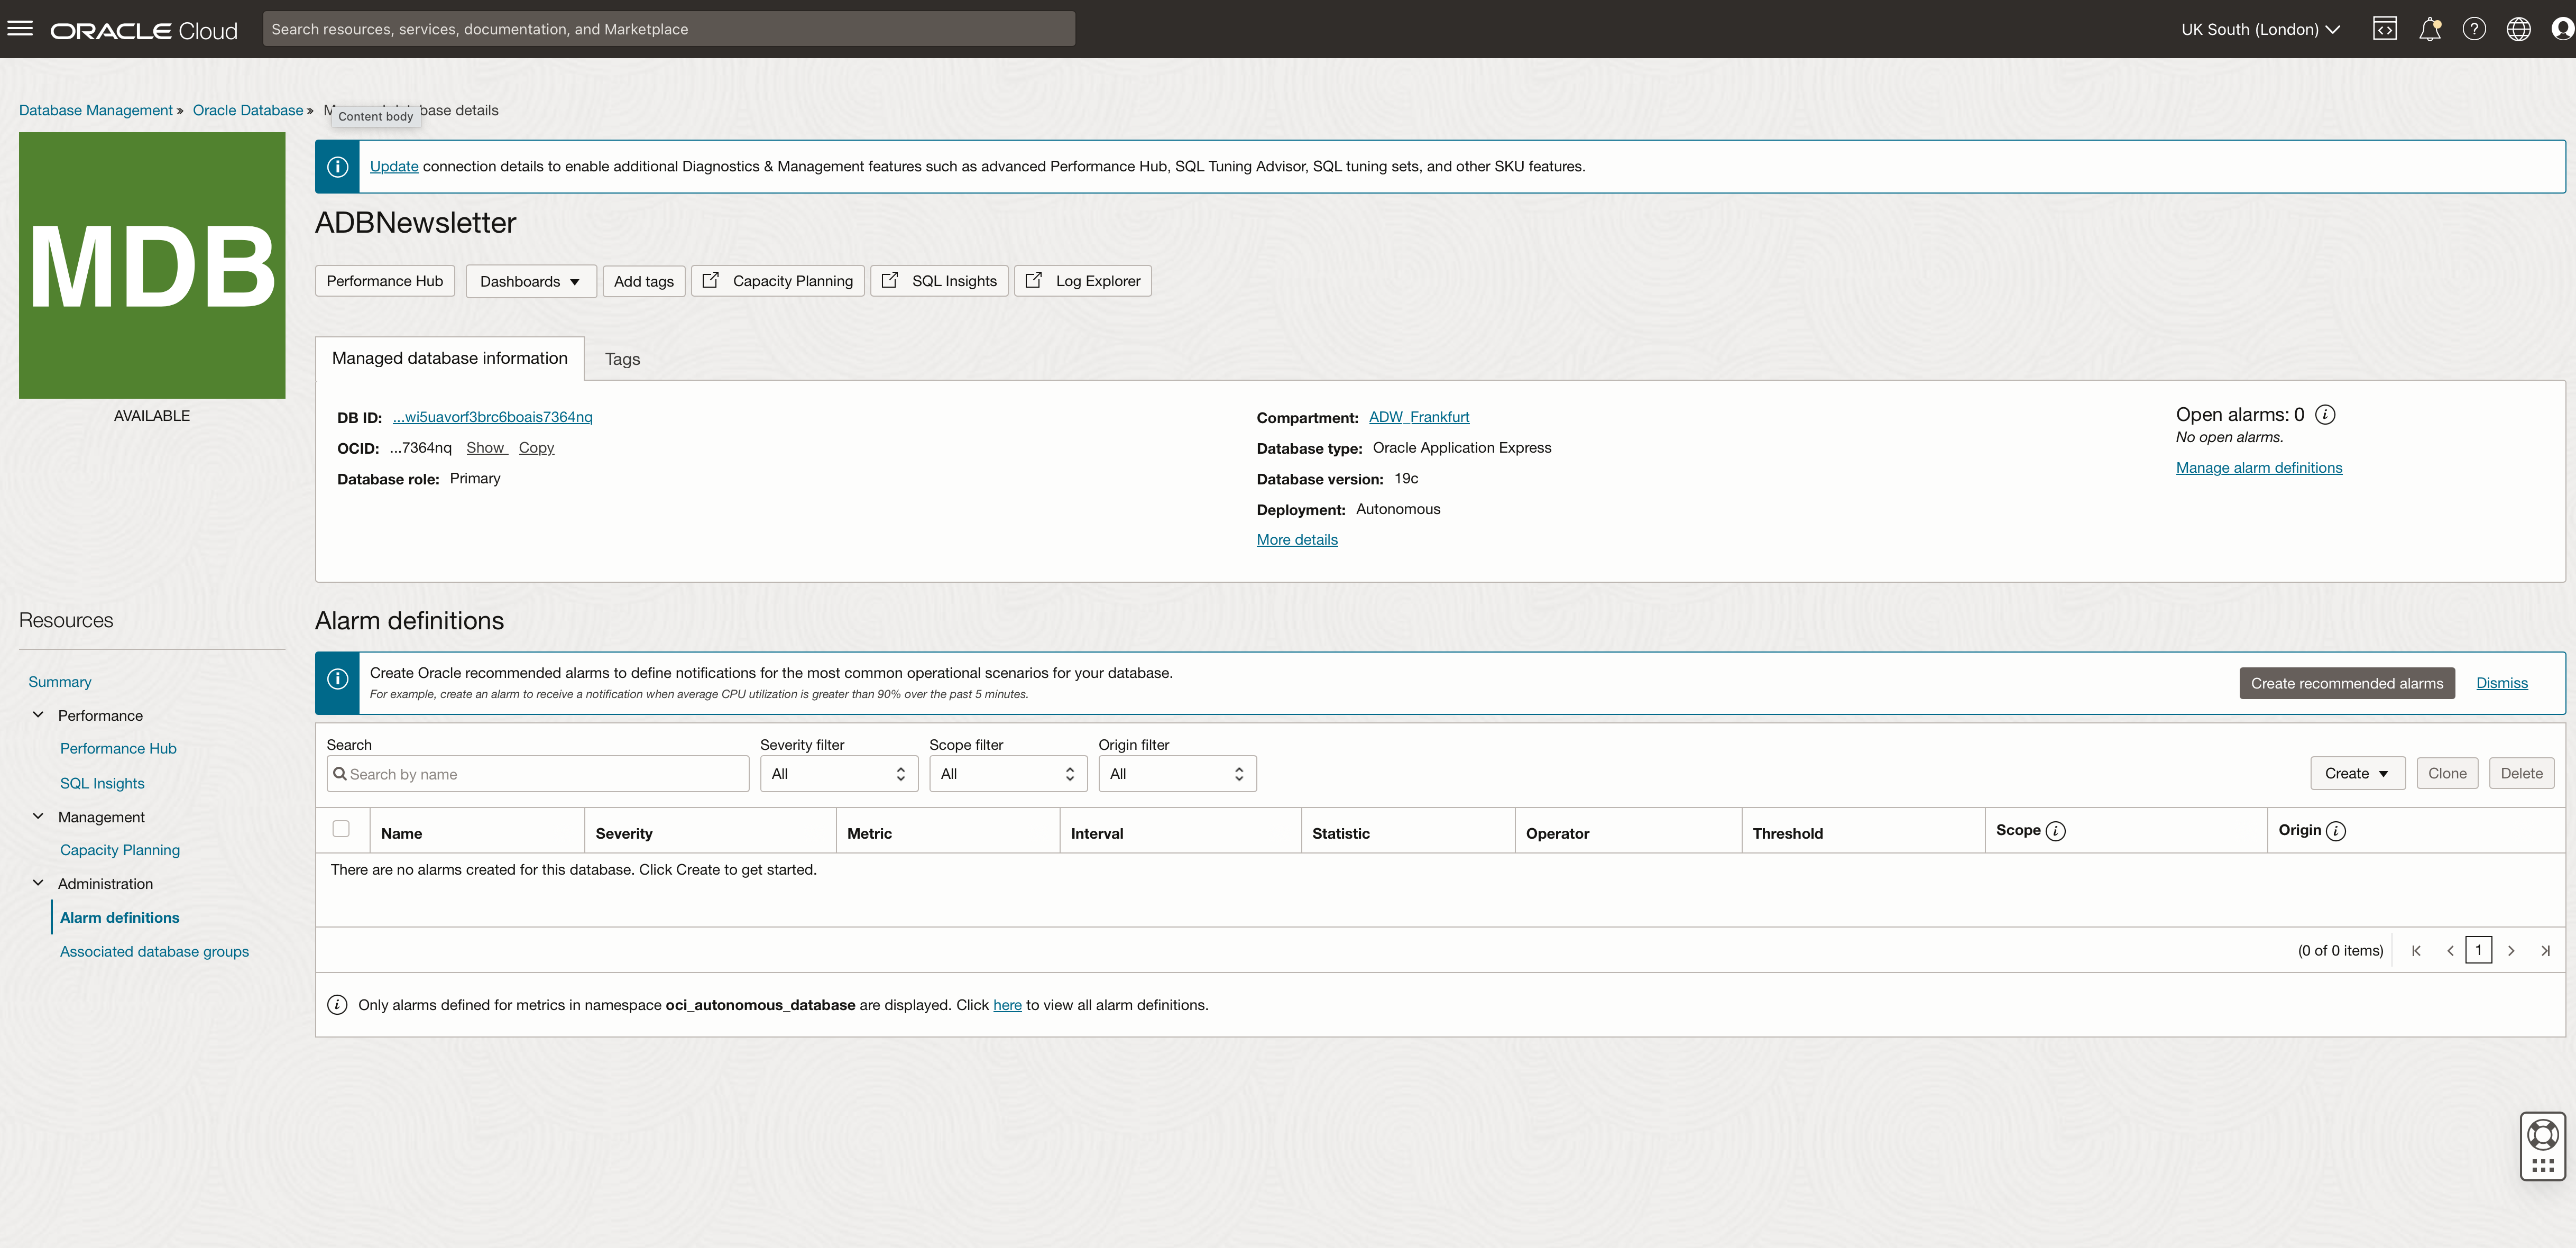
The alarm definition can be customized to set the trigger point based on your desired parameters. The notification of the event being triggered can be sent to any of the usual endpoints—email, SMS, Slack, pager, OCI Function, or HTTPS based on the customer URL.
There is a video showing how to create new alarms and configure the various options in this blog post:
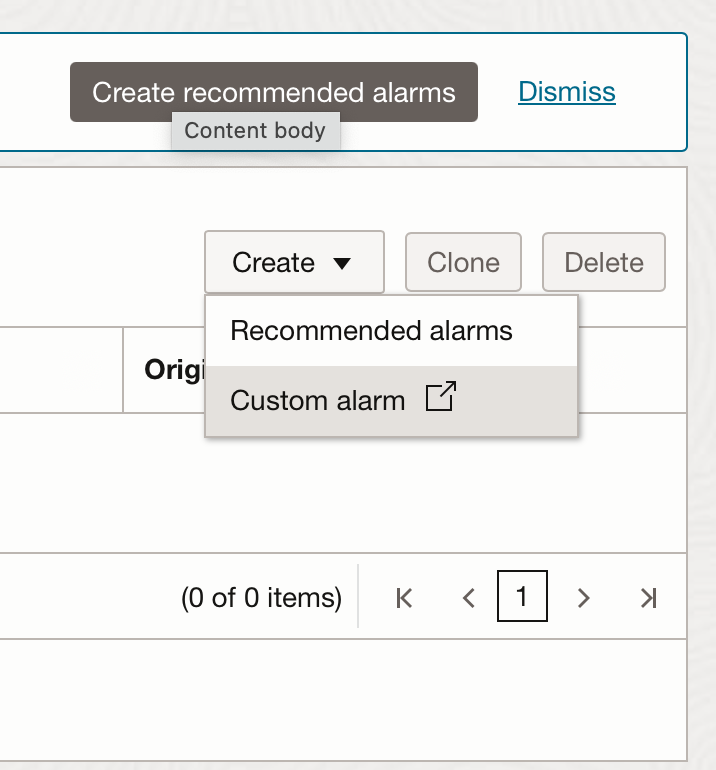
Is there a library of pre-built alarms that I can use?
Yes. The Database Management console allows you to create a set of recommended alarms that can be deployed with a few clicks. There is a video showing how to create new alarms and configure the various options in this blog post:
What does the library of alarms monitor?
On the Alarm Definitions page, you can very easily add a whole suite of valuable alarms that provide the following types of monitoring:
- Critical – Alarm fires when the Mean of CpuUtilization exceeds the threshold value 85.
- Critical – Alarm fires when the Mean of FailedLogons exceeds the threshold value of 30.
- Warning – Alarm fires when the Mean of FailedLogons exceeds the threshold value of 20.
- Warning – Alarm fires when the Mean of Sessions exceeds the threshold value 30.
- Critical – Alarm fires when the Mean of StorageUtilization exceeds the threshold value 85.
- Warning – Alarm fires when the Mean of StorageUtilization exceeds the threshold value of 75.
If the pre-configured thresholds don’t match your precise requirements, you can modify these alarms using the edit feature to use different thresholds. There is a video showing how to create new alarms and configure the various options in this blog post:
Can I create a customer alarm?
Yes. In addition to creating recommended alarms, you can also create your own customer alarm.
There is a video showing how to create a customer alarm in one of my earlier blog posts: How to quickly enable a set of smart alarms to monitor your Autonomous Databases
Can I create a bespoke alarm based on a SQL query?
Yes. My colleague German Viscuso has just posted the steps to define a service to fetch a bespoke metric and publish it to OCI Monitoring, enhancing your ability to monitor, analyze, and react to database performance metrics efficiently. See here: Publishing Custom Autonomous Container Database Metrics on Oracle Cloud Infrastructure Monitoring Service.
Can I monitor my ADB instances using an on-premise tool like Enterprise Manager?
Yes. You will use Oracle Enterprise Manager (EM or OEM) for this task. EM is Oracle’s on-premise management platform that provides a single dashboard to manage all Oracle deployments in data centers or the cloud. EM gives you the ability to:
- Monitor and respond to performance and configuration-related alerts
- Manage users, schema, roles, space, etc
- Diagnose and improve application-level SQL logic
- Do lifecycle operations like service instantiation, termination, scale-up/down, etc., orchestrated via cloud-native APIs
Many of our customers were already EM users observing on-premise Oracle database fleets. They also use it for seamless, fleet-wide management of Autonomous Databases with Oracle Enterprise Manager 13c. EM allows DBAs to transfer their knowledge and tooling know-how to efficiently manage cloud and on-premises environments encompassing Oracle Database, Oracle Engineered Systems, Oracle Middleware, Oracle Apps, and Oracle Cloud. A specific Database plug-in allows you to apply your Oracle Enterprise Manager skillset to the Autonomous Database. While Autonomous Database eliminates the work associated with most DB management tasks, you can leverage the best diagnostic and lifecycle capabilities from EM to control the customer-managed portion of your Autonomous Database instances completely.
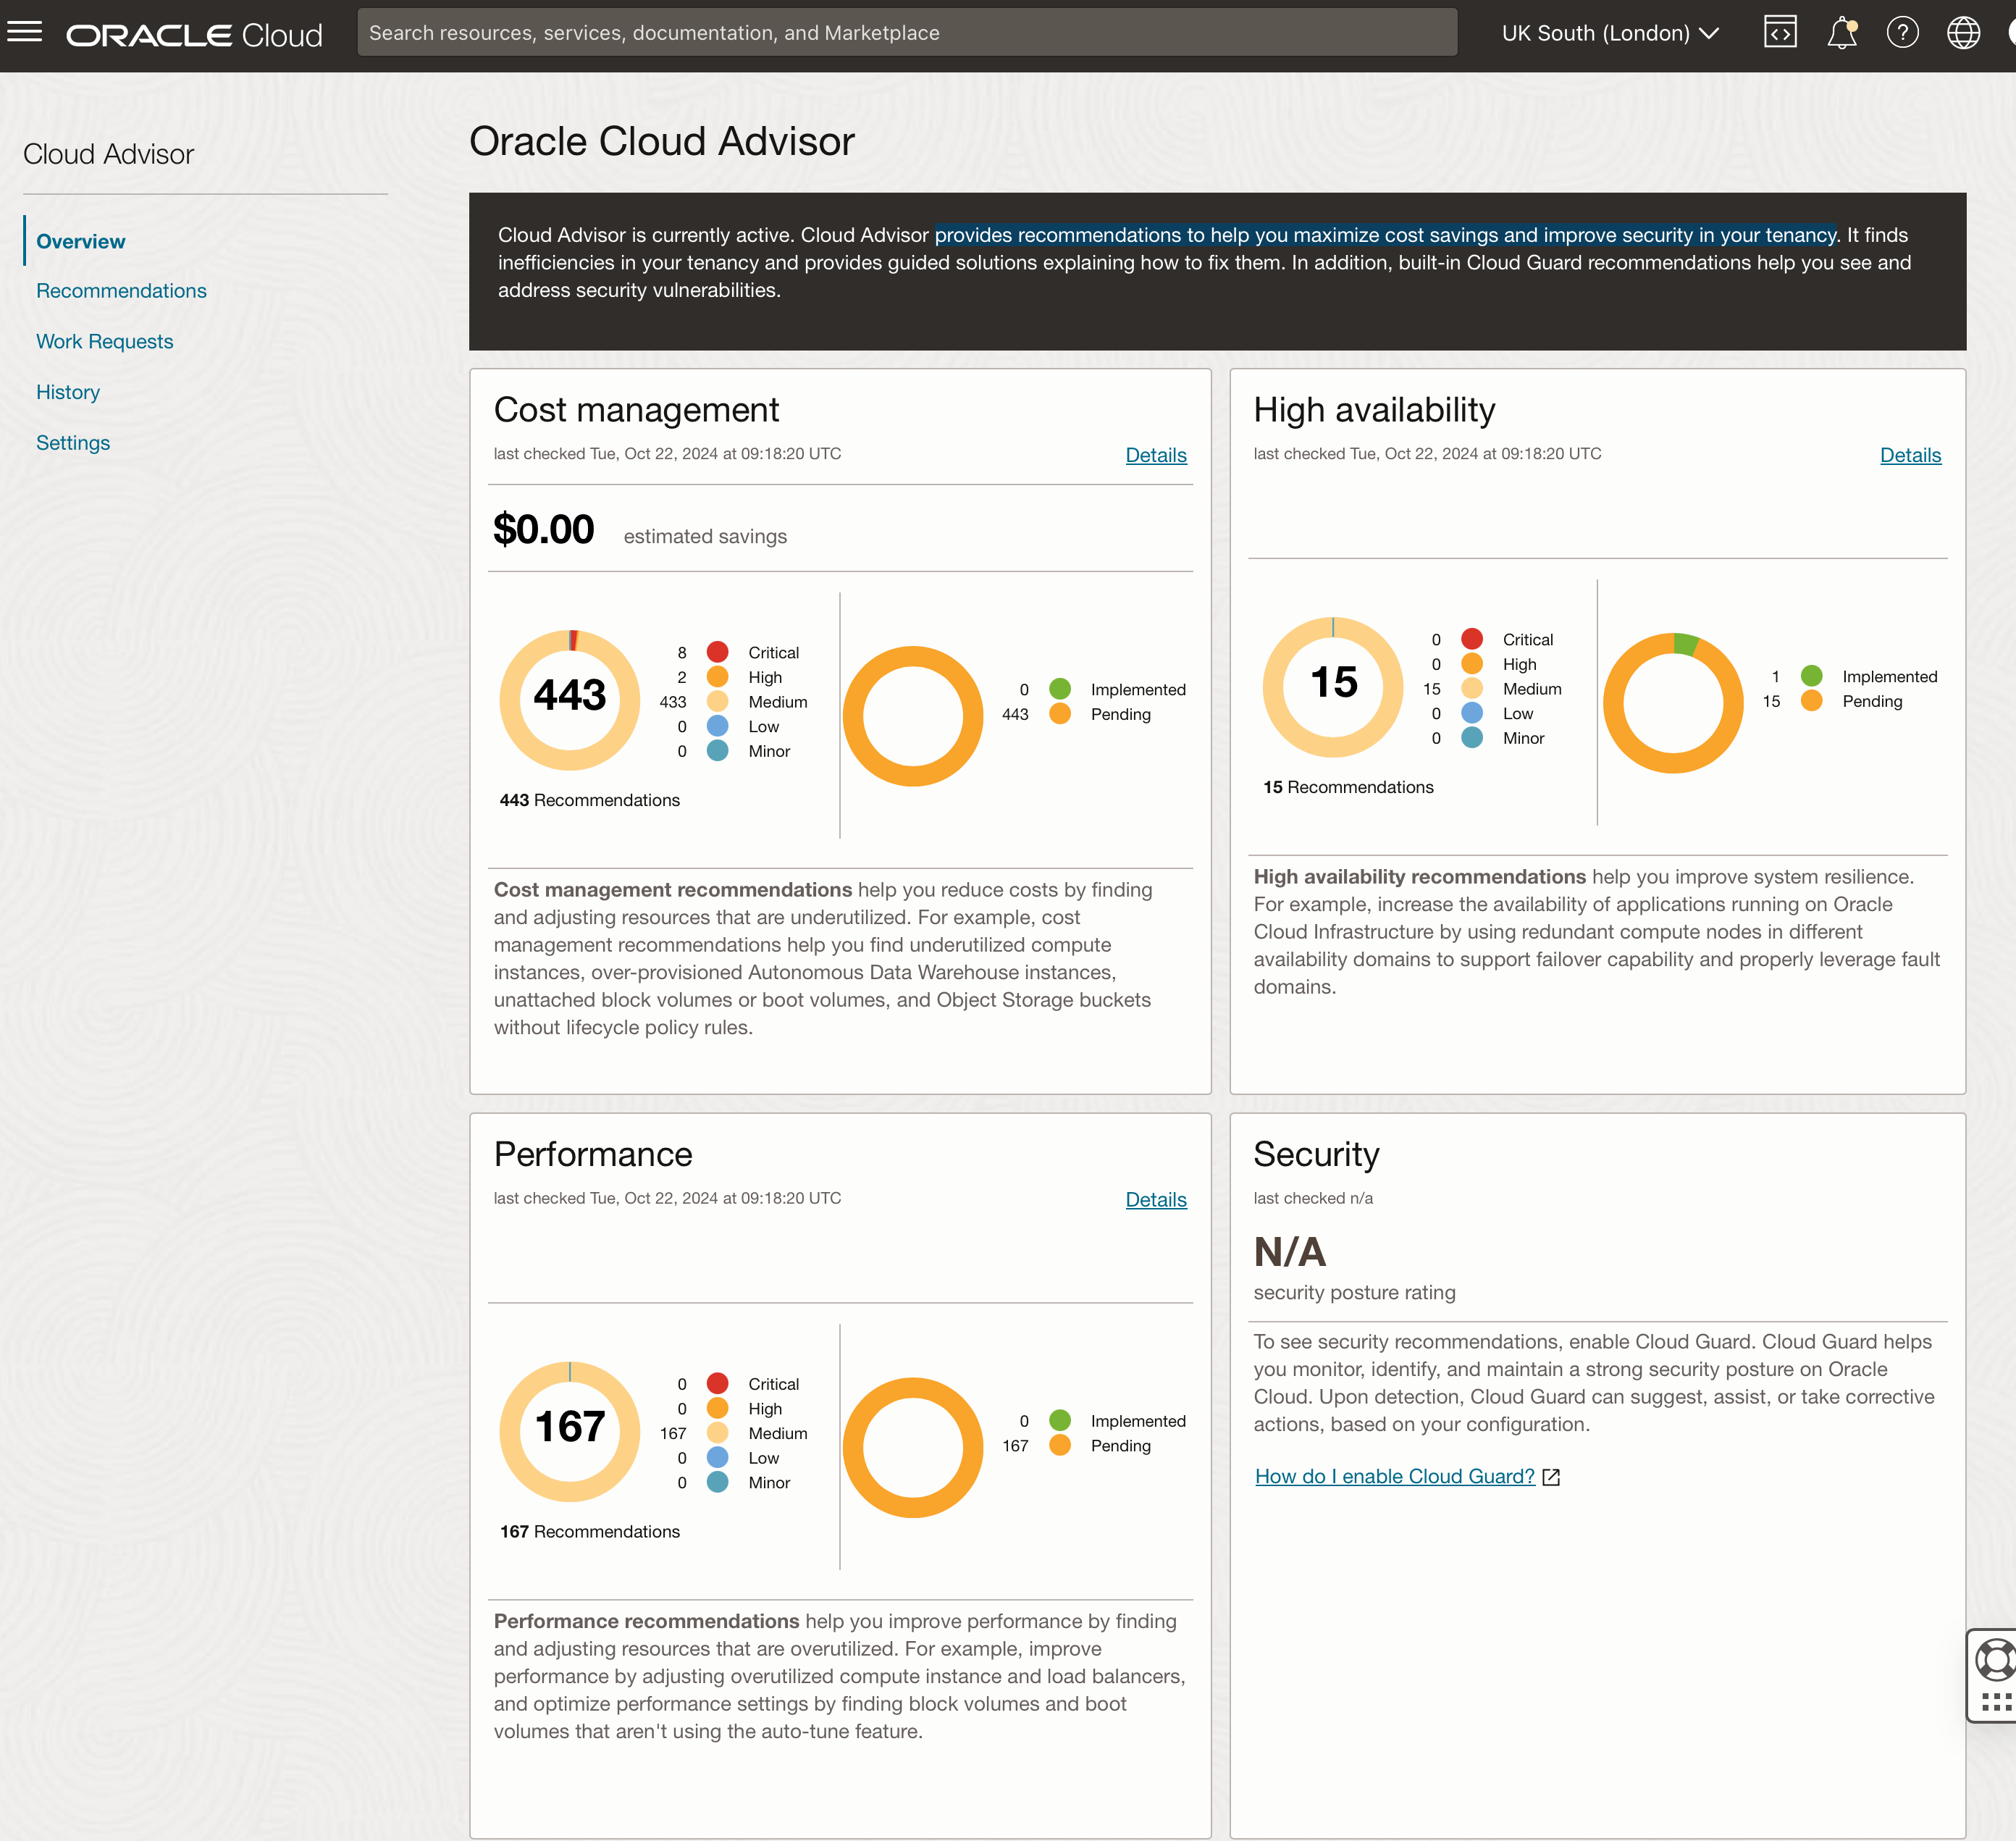
Can I get auto-generated recommendations to help me optimize my ADB fleet?
Cloud Advisor is a portal for viewing the automated recommendations generated by OCI that cover four specific areas:
Cost management recommendations – help you reduce costs by finding and adjusting underutilized resources. For example, cost management recommendations help you find underutilized compute instances, over-provisioned Autonomous Data Warehouse instances, unattached block volumes or boot volumes, and Object Storage buckets without lifecycle policy rules.
High availability recommendations – help you improve system resilience. For example, increase the availability of applications running on Oracle Cloud Infrastructure by using redundant compute nodes in different availability domains to support failover capability and properly leverage fault domains.
Performance recommendations – help you improve performance by finding and adjusting overutilized resources. For example, improve performance by adjusting overutilized compute instances and load balancers and optimize performance settings by finding block volumes and boot volumes that aren’t using the auto-tune feature.
Security recommendations – Enable Cloud Guard to see security recommendations. Cloud Guard helps you monitor, identify, and maintain a strong security posture on Oracle Cloud. Upon detection, Cloud Guard can suggest, assist, or take corrective actions based on your configuration – How do I enable Cloud Guard?
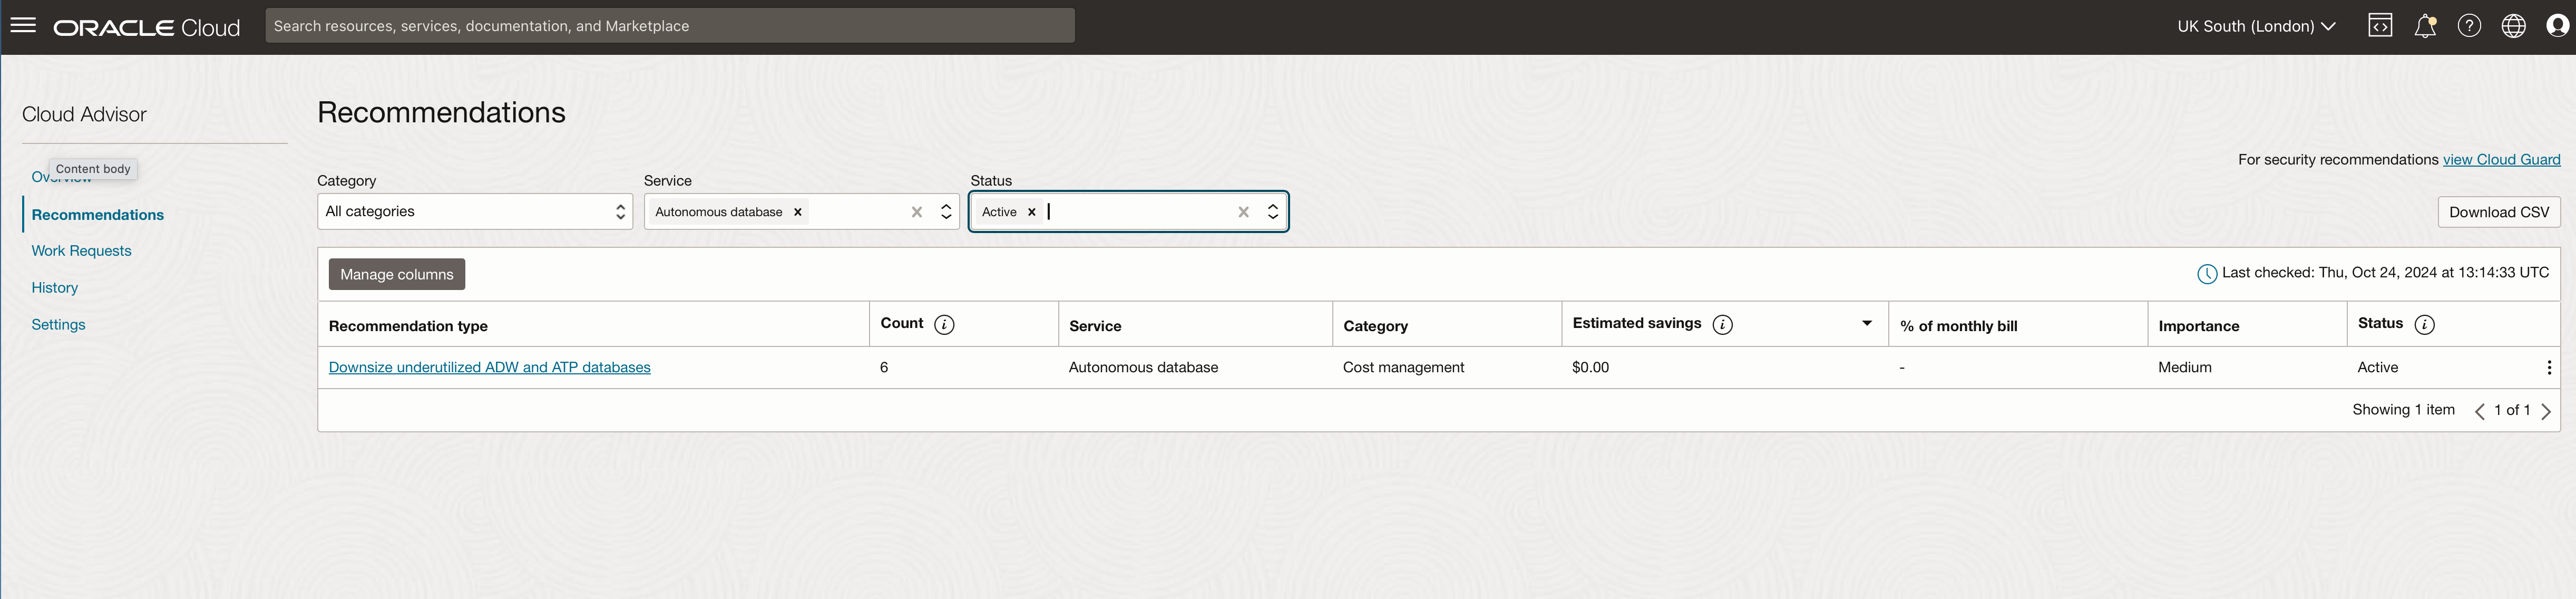
Focusing on the recommendations page, I could reduce my cloud bill by resizing some of my ADW and ATP instances to use few base resources, which is nice to know!
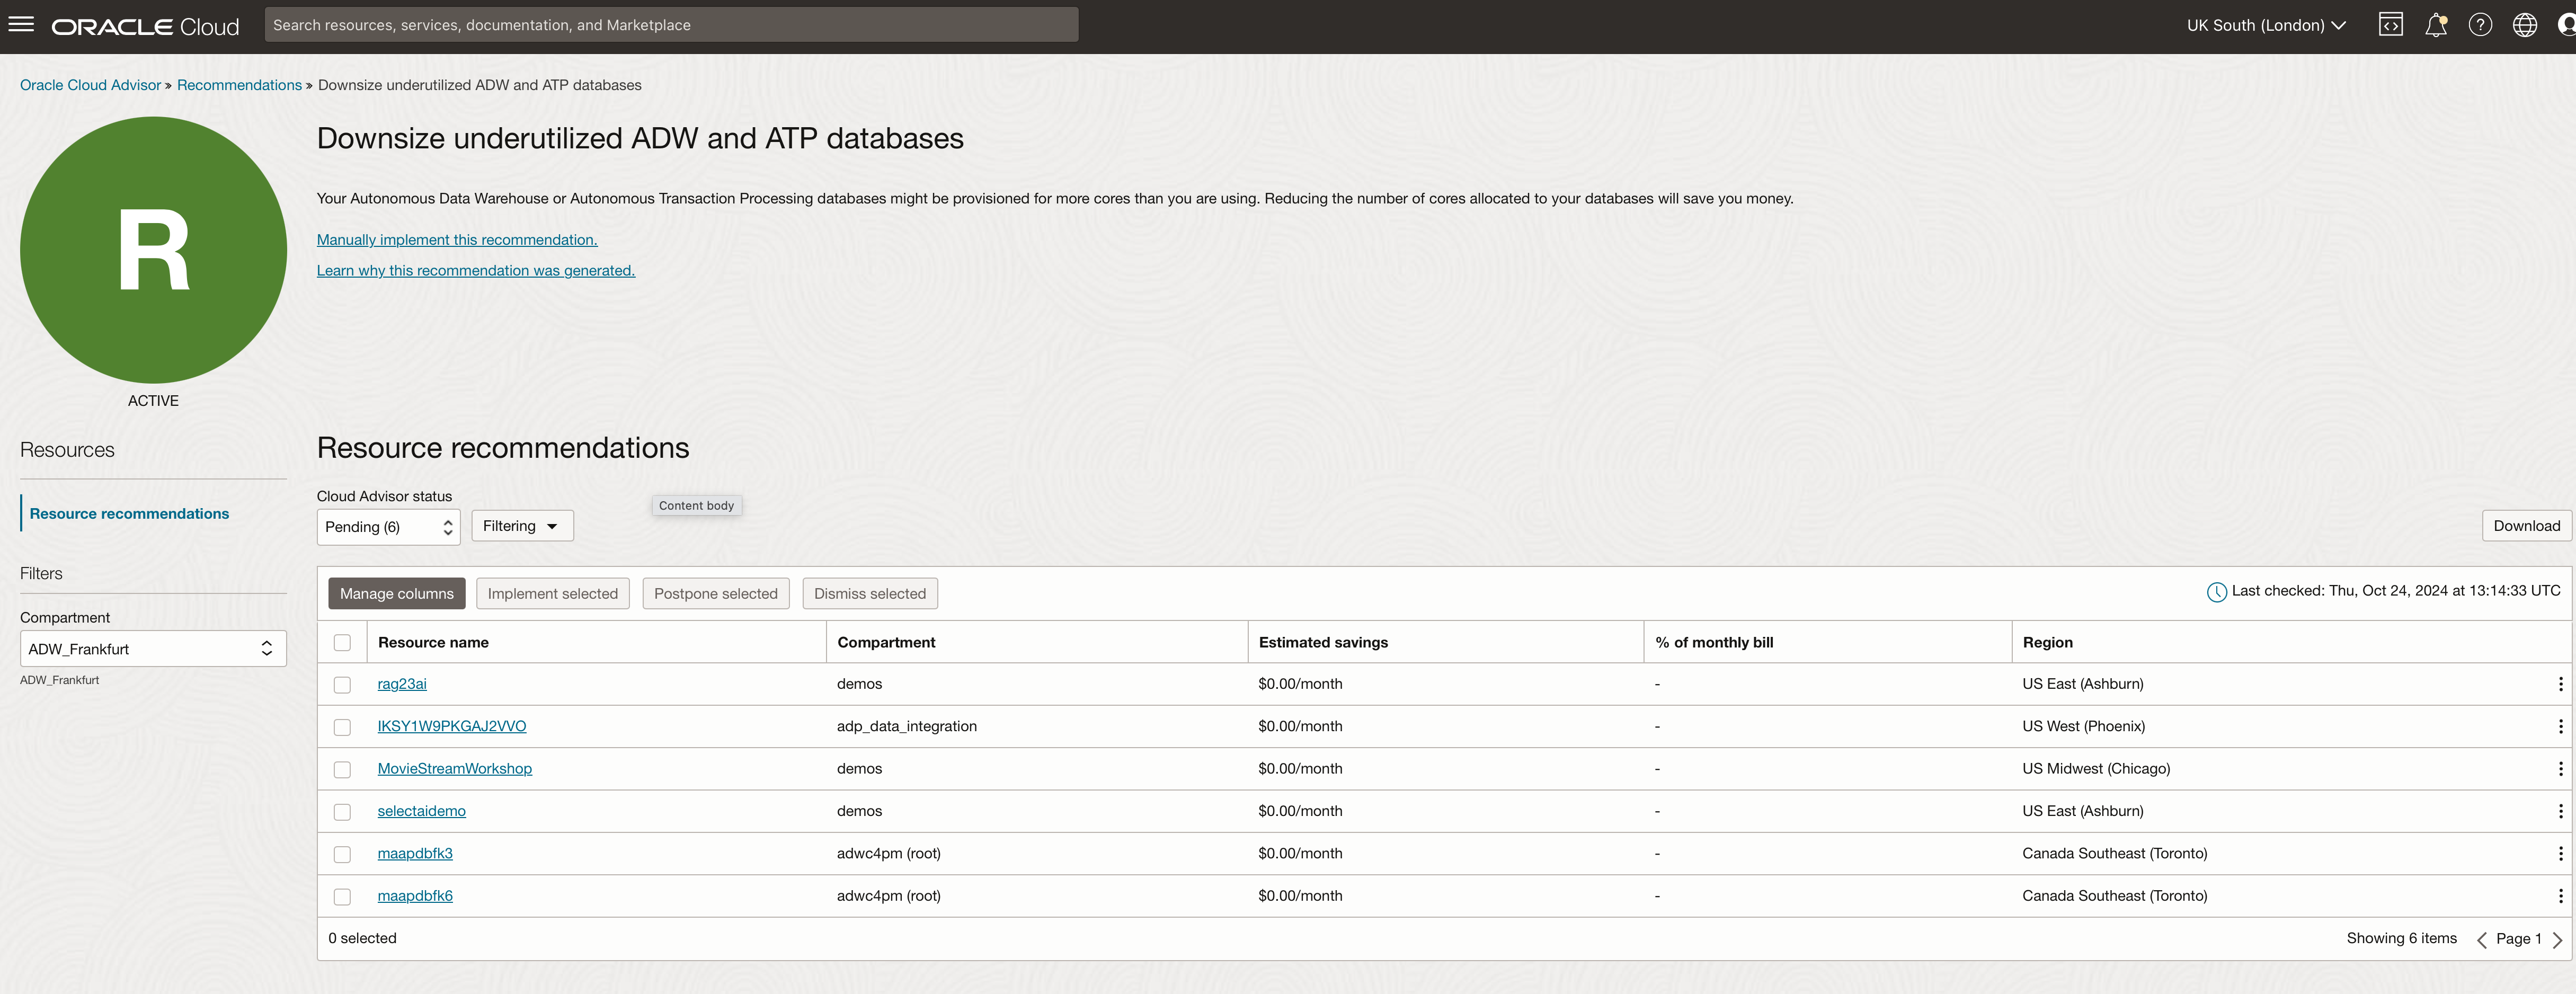
…and here is the list of ADB instances that I should consider resizing. As you can see from the screenshot, the instances are located in different data centers and compartments, so this is truly a fleet-wide view of my resources.
Wrap up
Let’s quickly recap…if we shown how to use the built-in tools and services to monitor a fleet of ADB instances:
- Autonomous Database Overview page
- Database Management service
- Ops Insights service
- Enterprise Manager 13c
- Cloud Advisor
I have shown how you can get fleet overviews and then drill down in to detailed workload and query performance metrics using only a cloud account. I have looked at how to automate your monitoring using alarms so you can take an “exception-based” approach to observing and monitoring your autonomous database instances. Finally, I explored the Cloud Advisor service that is design to provide recommendations to help improve overall security, performance, availability, and costs within your tenancy.
Hopefully, the above was useful. Don’t forget that if you only want to monitor a single ADB instance then take a look at my earlier post: Part 2 – focusing on observability and monitoring of a single ADB instance.