This is the second post on observability and management services for Autonomous Database Serverless. In the first post, I outlined the different observability and management personas and provided a list of the tools and services available to monitor ADBs.
In this post, I will focus on the observability and monitoring of a single ADB instance.
The Cloud Administrator and Database Engineer are the primary personas tasked with monitoring a single ADB instance.
A Cloud Administrator has a cloud account that allows them to sign in to their corporate tenancy and manage the complete lifecycle of their ADB instance(s) using the cloud console (OCI console, Azure console, or Google Cloud console). The Database Engineer only has a database username and password and uses similar tools to the Cloud Administrator, but those tools are built into the ADB instance.
What tools and services are available to monitor a single instance?
Every Autonomous Database comes with a built-in set of services that provide information about how the resources are being used.
| Account Type |
Tool-Service |
| Cloud account |
ADB Console metrics |
| Database Account |
Database Actions – Database Dashboard |
Can I monitor resource usage in my single ADB instance?
Yes. You will use the OCI console page for this task, which requires a cloud account.
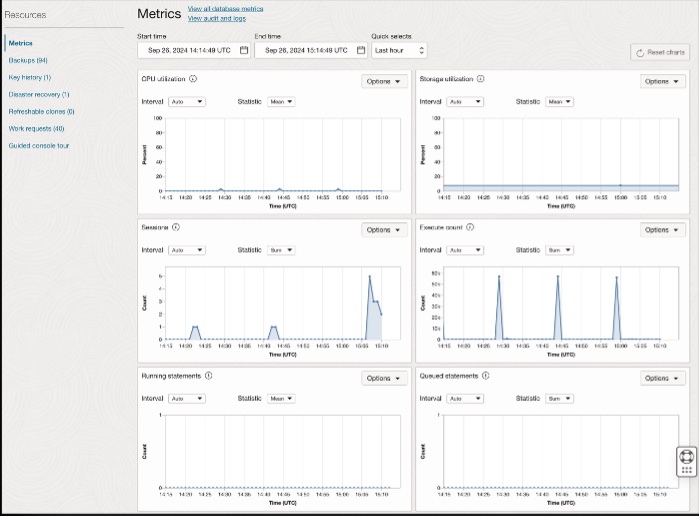
The console metrics graphs can help you answer questions very quickly.
- What is the current CPU utilization?
- What was the CPU utilization over the last hour
- What is the current storage utilization
- What was the storage utilization over the previous hour
- How many sessions were using my instance over the last hour
- How many queries were running over the previous hour
- How many queries were queued over the last hour
- How many failed connections occurred during the previous hour
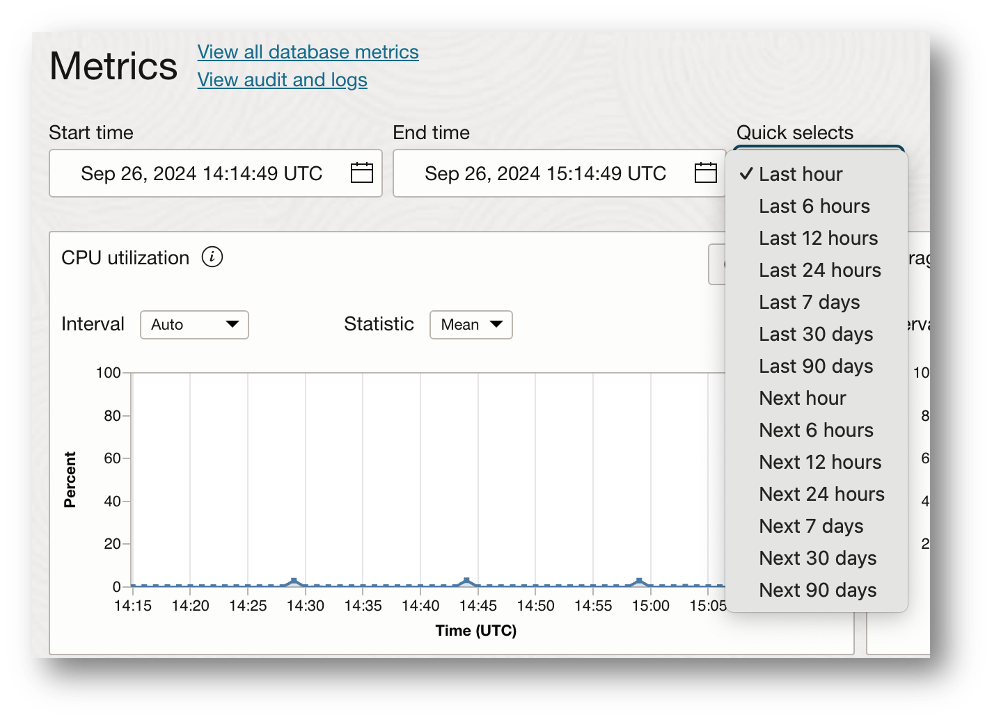
Can I change the time window on the x-axis for all the graphs?
Yes. There is a date-time picker and a set of quick links to pre-defined time-based queries:
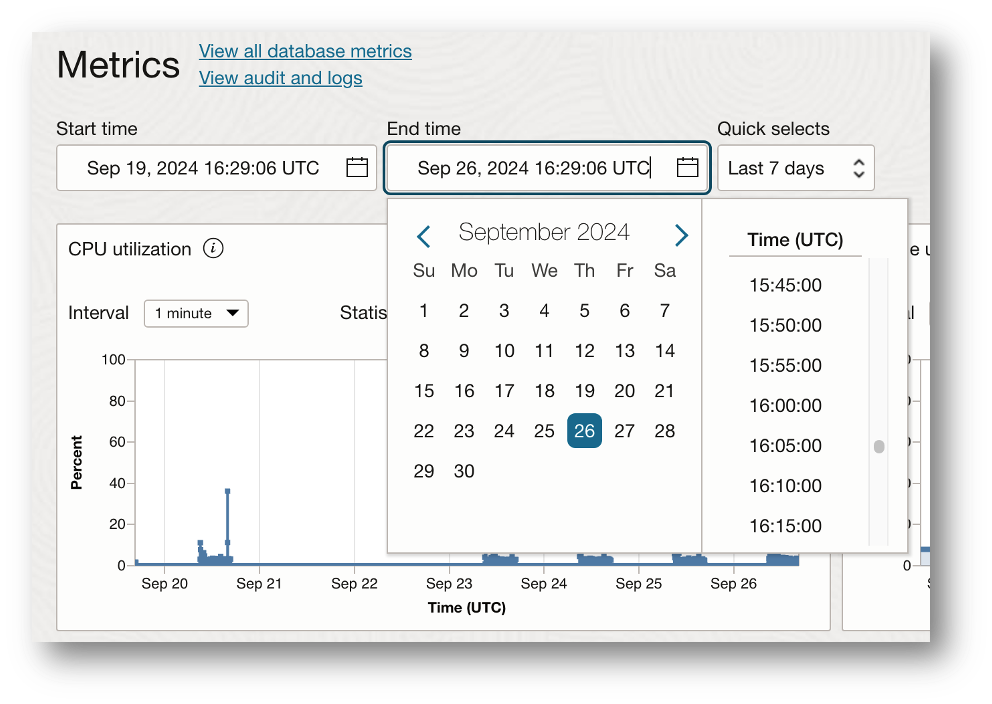
There is also a set of pre-built timeframes for quick picks:
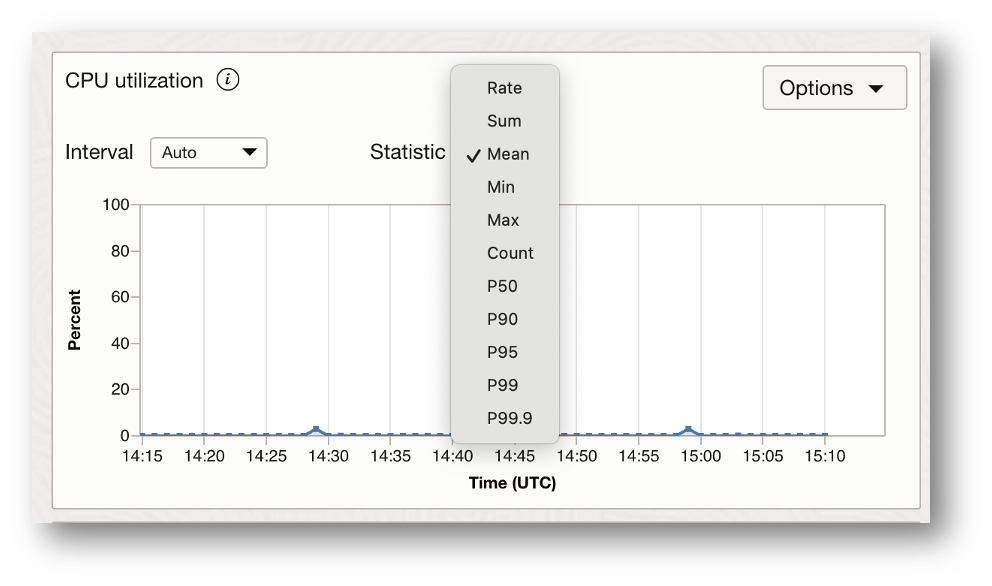
Can I change the metrics on each graph – the default is mean.
Yes. You can select from a library of pre-set statistical measures, as shown here:
Can I monitor my ADB instance if I don’t have a cloud account?
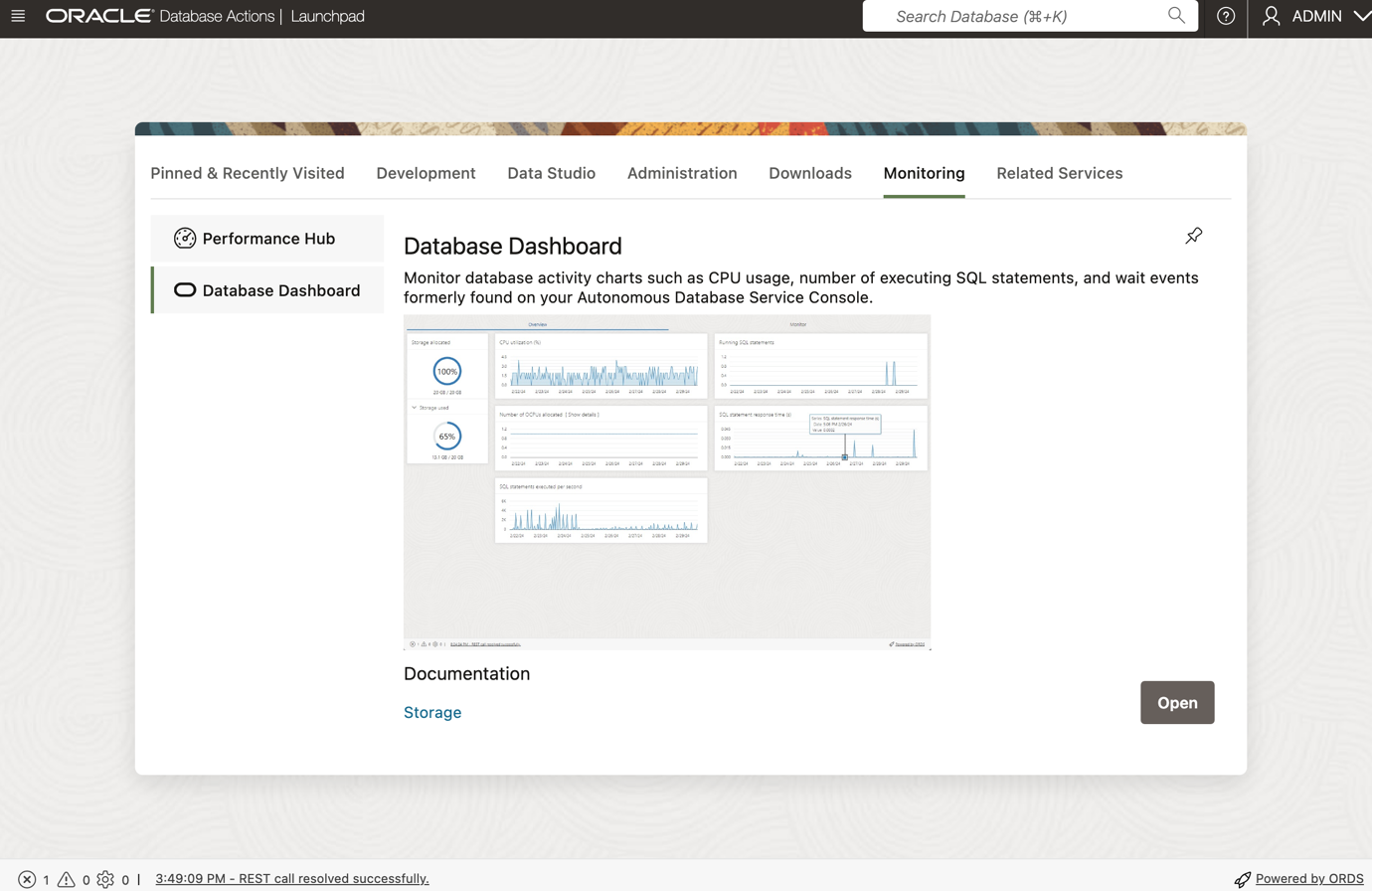
Yes. For this task, you will use the Database Dashboard tool, available via Database Actions. It provides some high-level instance resource monitoring. Database Actions is accessible using just a database username and password. You must get the direct URL from your cloud administrator to access the Database Actions console.
When you log in to the Database Actions console, you will see a list of tool groups at the top of the panel. The monitoring panel has two options.
-
- Performance Hub
- Database Dashboard
The Database Dashboard will give you a view similar to the OCI Metrics page, which contains all the different graphs.
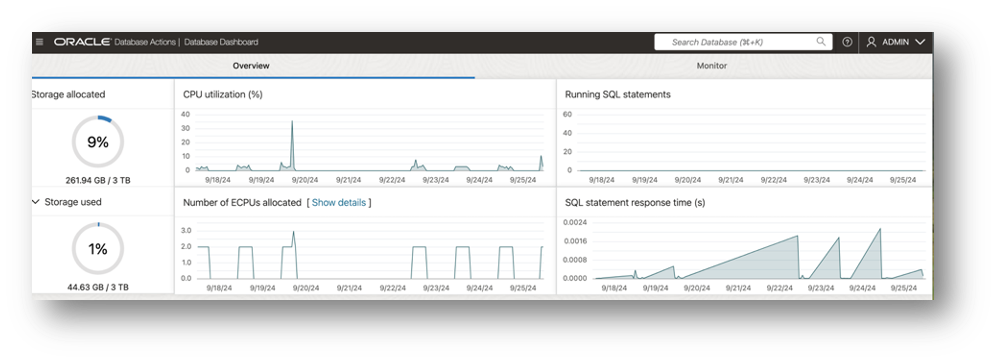
The Database Dashboard provides an overview of storage space usage, ECPU usage, and average SQL response time.
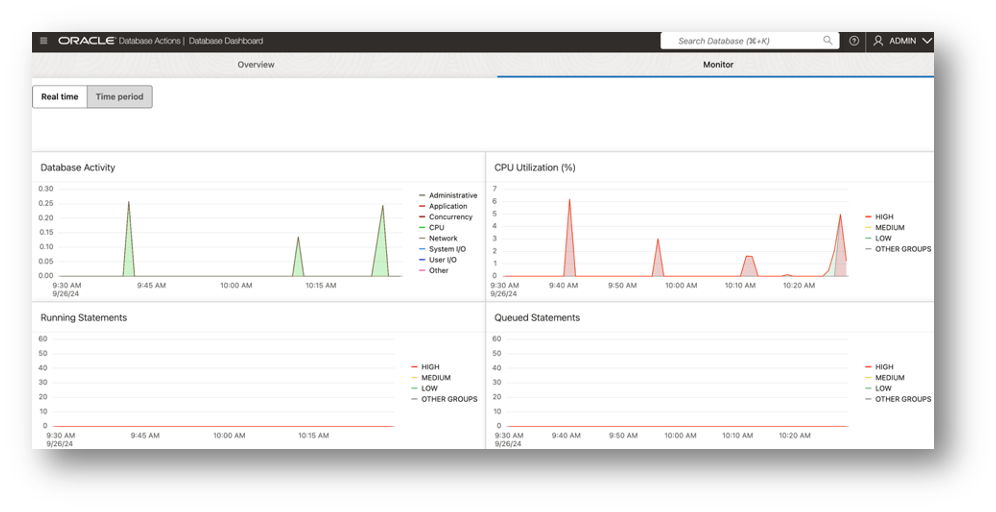
The second tab on the dashboard provides additional monitoring graphs and is subdivided into a real-time view of activity:
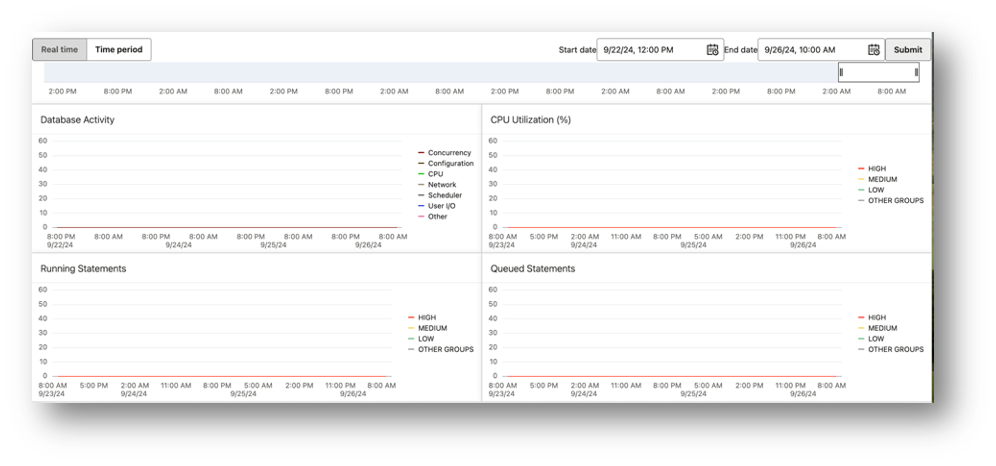
And the ability to get a historical (Period) view. The UI provides a period view with a time-window slider bar and date-time pickers for controlling the day-times within the 7-day historical monitoring window.
The period view provides a 7-day view of resource usage with the ability to zoom into a specific timeline across the graphs by using the slider bar or the pop-up data picker:
How do I automate the monitoring of my ADB instances?
You can use the Metrics section of the OCI ADB console to create alarms for specific metrics. Each of the graphs has an “Options” button with a menu item for creating an alarm, as shown here:
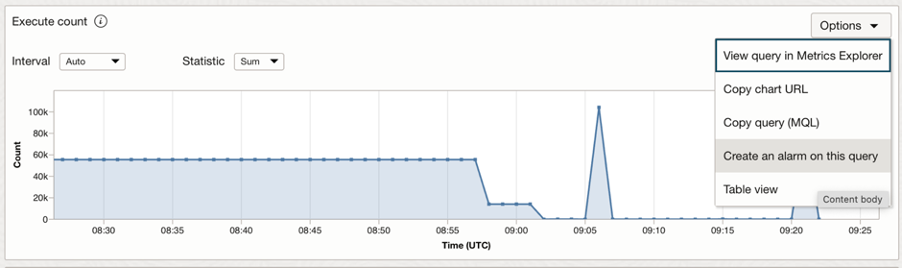
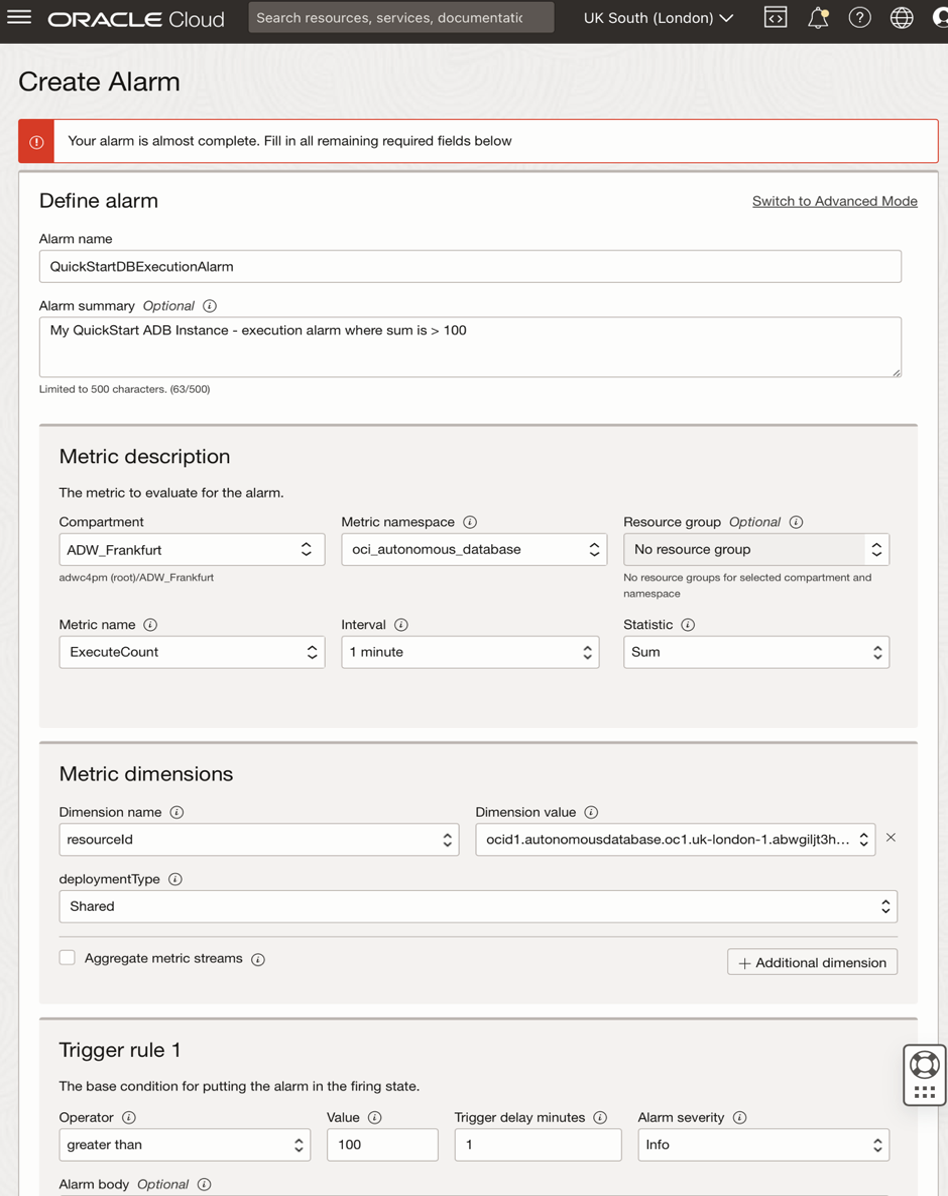
The alarm definition can be customized to set the trigger point based on your desired parameters. The notification of the event being triggered can be sent to any of the usual endpoints—email, SMS, Slack, pager, OCI Function, or HTTPS based on the customer URL.
There is a video showing how to create new alarms and configure the various options in this blog post:
Is there a library of pre-built alarms that I can use?
Autonomous Database is tightly integrated into the OCI telemetry services. This means that Autonomous Database administrators can use the Database Management console, which has a library of built-in alarms that can be deployed in a few clicks.
There is a video showing how to create new alarms and configure the various options in this blog post:
What does the library of alarms monitor?
On the Alarm Definitions page, you can very easily add a whole suite of valuable alarms that provide the following types of monitoring:
- Critical – Alarm fires when the Mean of CpuUtilization exceeds the threshold value 85.
- Critical – Alarm fires when the Mean of FailedLogons exceeds the threshold value of 30.
- Warning – Alarm fires when the Mean of FailedLogons exceeds the threshold value of 20.
- Warning – Alarm fires when the Mean of Sessions exceeds the threshold value 30.
- Critical – Alarm fires when the Mean of StorageUtilization exceeds the threshold value 85.
- Warning – Alarm fires when the Mean of StorageUtilization exceeds the threshold value of 75.
If the pre-configured thresholds don’t match your precise requirements, you can modify these alarms using the edit feature to use different thresholds.
There is a video showing how to create new alarms and configure the various options in this blog post:
Can I monitor the overall workload and the individual queries running in my ADB instance if I don’t have a database account?
Yes. For this task, you will use Performance Hub. You can access Performance Hub directly via the OCI console as a Cloud Administrator.
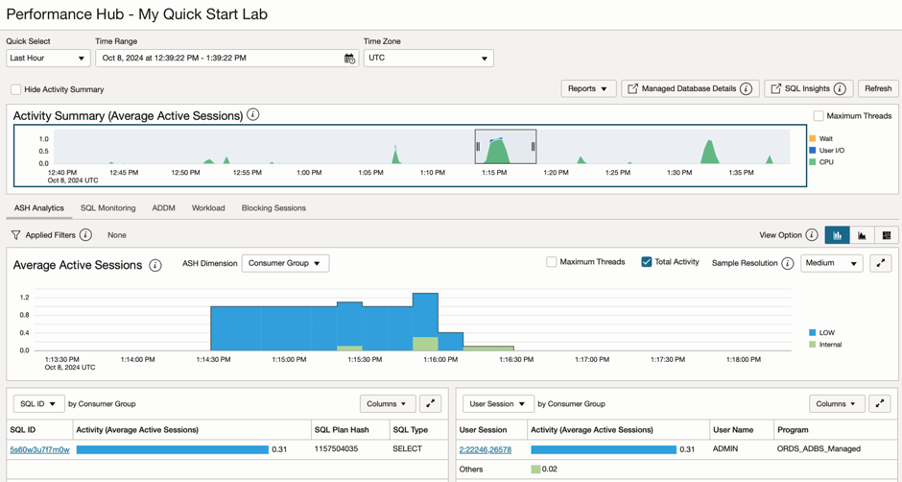
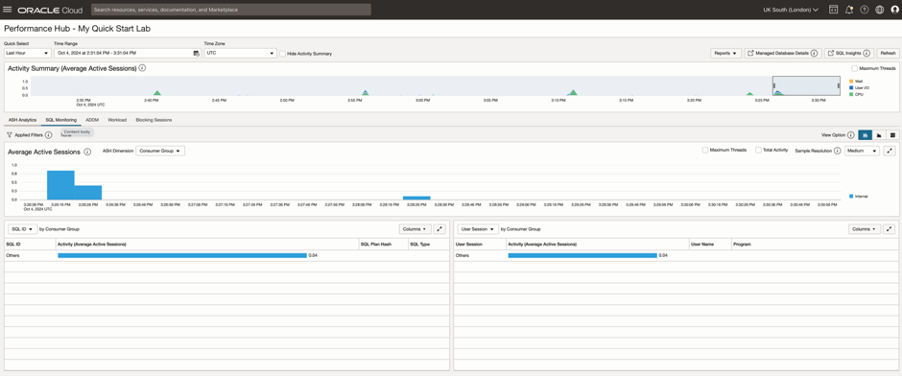
Performance Hub displays information about your Autonomous Database’s performance for a specified period, allowing you to view real-time and historical performance data. It provides integrated system-wide and session-specific views of the database activity with these specific reports and views:
- Automatic Workload Repository (AWR) Reports
- Active Session History (ASH) Analytics
- Real-Time SQL Monitoring
- SQL Details Automatic Database Diagnostic Monitor (ADDM)
- Blocking Sessions
- Analyze transient performance problems with the application that are short-lived.
How can I monitor individual SQL statements with only an OCI account?
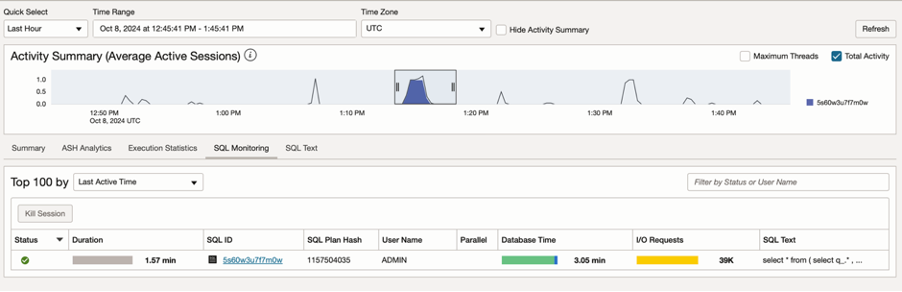
SQL monitoring tab provides in-depth query performance analysis. It helps to identify poorly written and designed SQL statements, identify and guide application call optimization in the data tier, capture fine-grained SQL statistics at each step of the execution plan, and analyze current and historical SQL statements.
In the screenshot, the SQL monitoring page shows how the database resources were used to run a Recency Frequency Monetary (RFM) query to analyze sales data. The query used low service, as shown on the bar graph. The SQL ID is shown in the table below the chart, and the SQL ID is a link allowing you to drill in for more information.
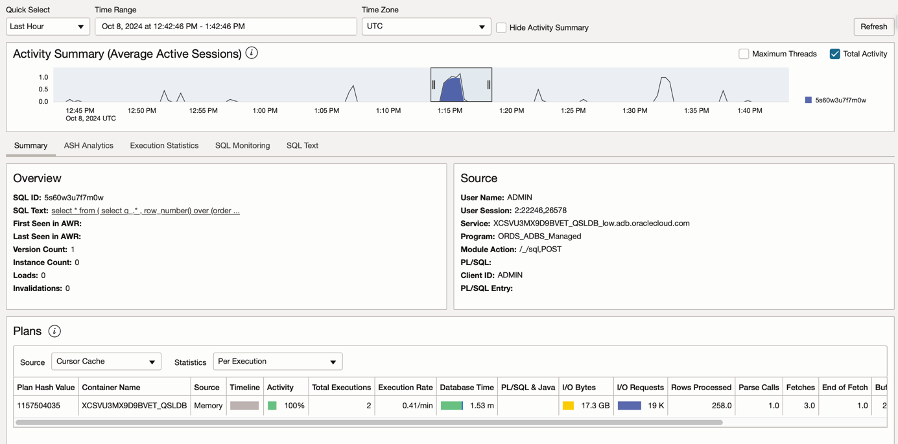
Then, select the SQL Monitoring tab.
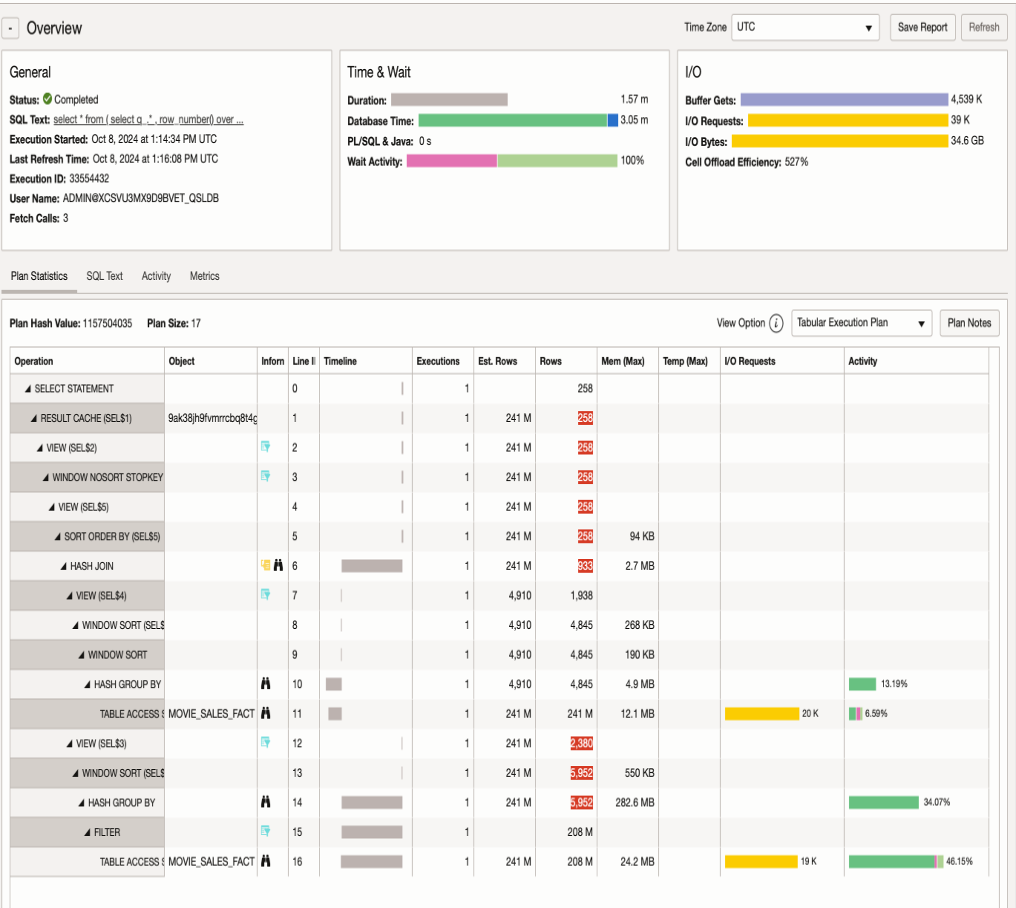
We can also start to explore how the query was executed. By following the links on the SQL ID, we can get a very detailed explain plan for our query:
The purpose of this post is not to explain how to interpret the information shown on this monitoring page because there are many excellent blog posts available to help you understand the information in this report. If you want more information, please refer to other blog posts by Maria Colgan and Nigel Bayliss. This post explains which tools and services are available with Autonomous Database to help you get the information you need about query and workload performance and optimization.
Typically, SQL statements don’t run in isolation. Other activities can be using the database resources simultaneously, so it can be helpful to capture information about the overall workload…
How can I monitor individual SQL statements with only a database account?
There are a couple of options available. If you have access to the SQL query statement and the underlying data, then you can use the Explain Plan within the SQL Worksheet as the first step in understanding how the database chooses to run your query.
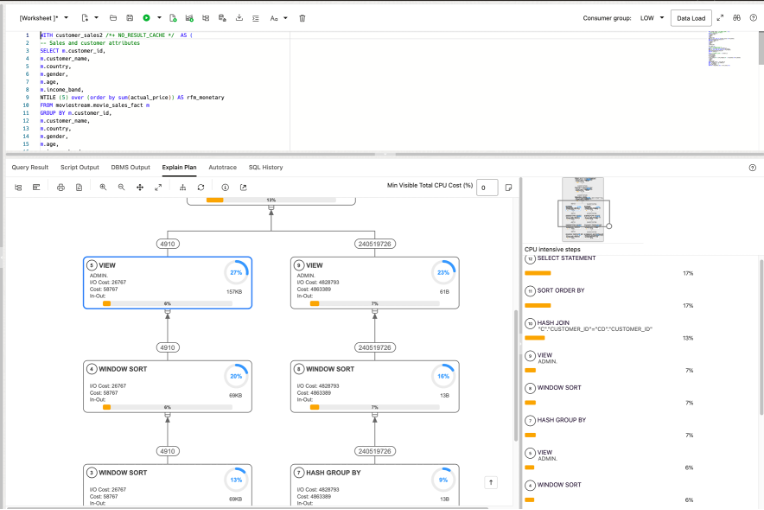
This part of the SQL Worksheet provides a lovely visual tree that shows the query’s execution path and which steps used the most compute resources. A skilled database engineer can use this information to optimize the query plan.
If you want more detailed information, switch to Performance Hub and use the reports described earlier.
How do I capture information about my overall workload?
Suppose you want to analyze the performance characteristics of a complete workload. In that case, it is beneficial to capture information about how the database resources are being used while the workload is running. The ASH analytics and Automatic Workload Repository (AWR) report provides detailed information to help you understand the overall performance of your total workload.
If you open an SR, Oracle Support will often ask you to upload an AWR report to help them investigate and understand how your workload used the database’s resources during a specific period.
How do I create an AWR report?
The button to start creating an AWR report is at the top right of Performance Hub.
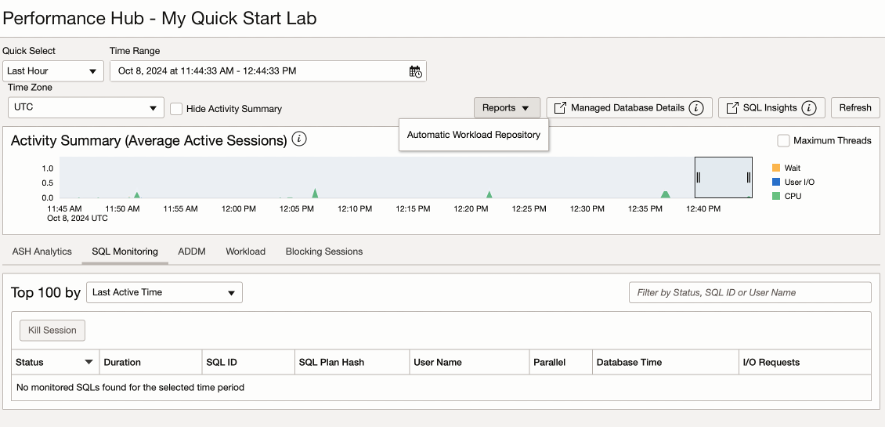
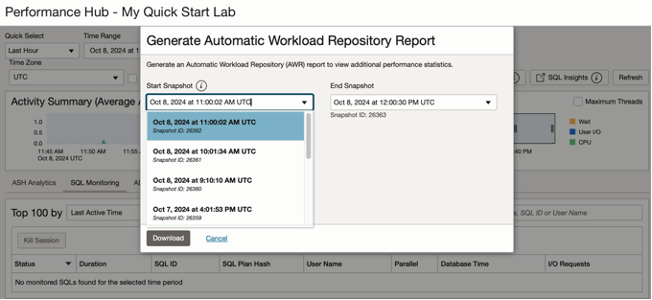
Once you have selected the report option, a pop-up form allows you to choose the 2 time windows that anchor the start and end of the workload snapshot.
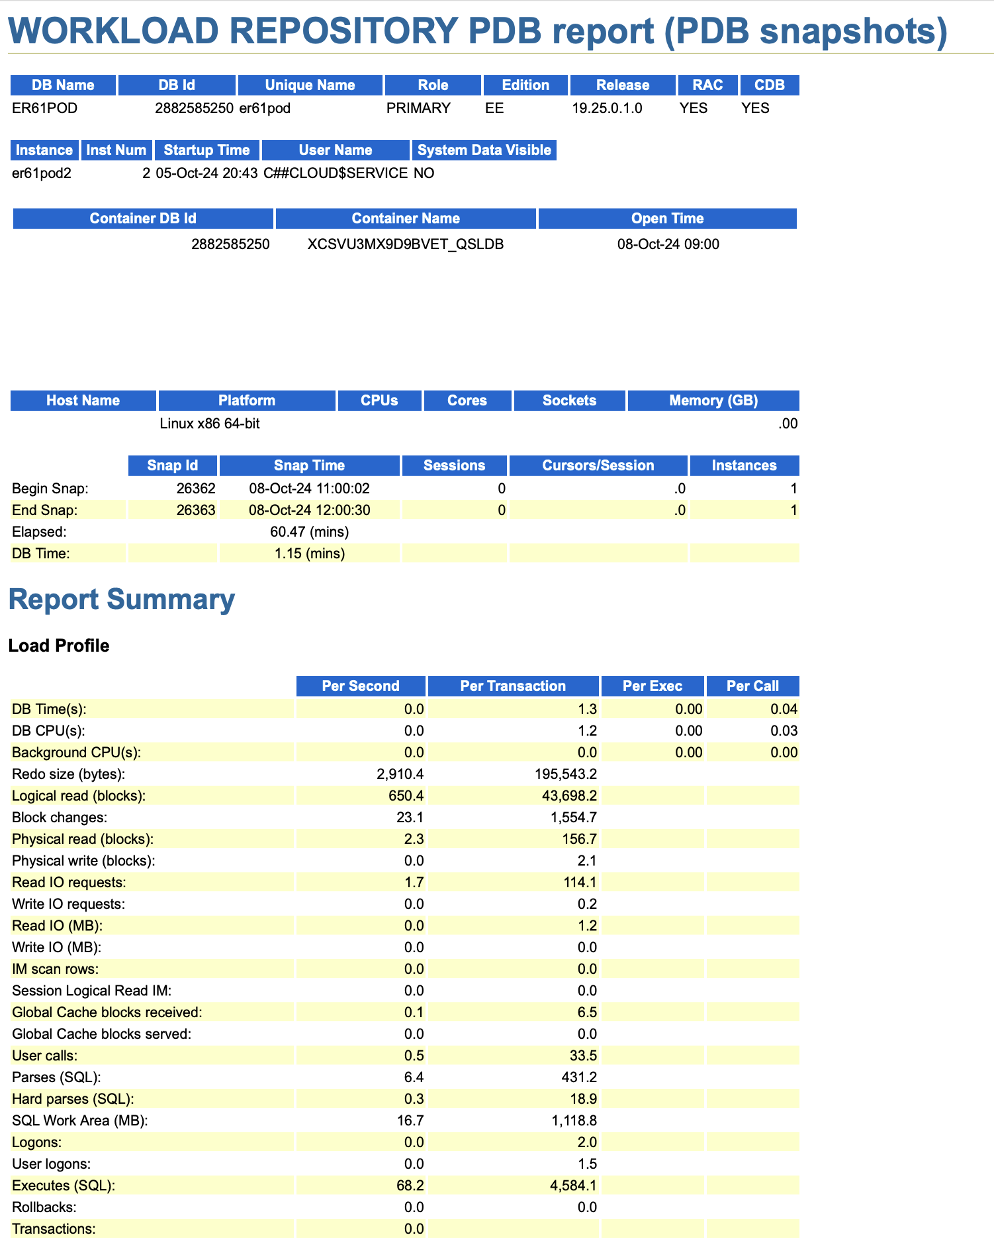
The final step is to download the finished report, which will look something like this:
Can I monitor my workload and get an AWR report if I don’t have a cloud account?
Yes. Database users can access the same performance hub console via the built-in Database Actions home page. This route provides access to all the same performance hub metrics without needing an OCI account—all you need is a database username and password. The steps for generating the report are the same.
How do I get a SQL trace for my query?
Most DBAs/database engineers are familiar with collecting SQL traces using their on-premise databases. My colleague Andrea Dal Zoppo, an Autonomous Database Specialist, has written a detailed post explaining how to create and download a SQL trace for a query:
Can I get an overview of my Autonomous Database deployments?
Yes. An Overview page shows information about your Autonomous Databases within a specific compartment.
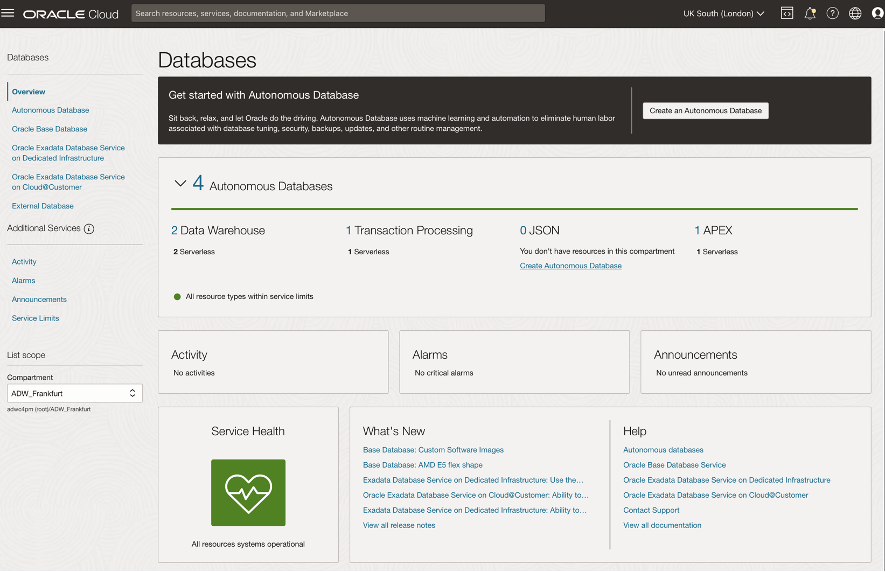
It brings together a list of all recent activities, any critical alarms that have been triggered, and recent announcements from across all your ADB instances. This is an excellent page to bookmark and use as your landing pad when you log in to OCI.
Wrap up
Let’s quickly recap…I have shown you how to use the built-in tools and services to monitor a single ADB instance. We have divided the usage of those tools and services between two key personas: the Cloud Administrator and the Database Engineer.
| Account Type |
Tool-Service |
| Cloud account |
ADB Console metrics |
| Database Account |
Database Actions – Database Dashboard |
I have shown how to get detailed workload and query performance metrics using a cloud account and a database-only account. I have also looked at how to automate your monitoring using alarms so you can take an “exception-based” approach to observing and monitoring your autonomous database instances.
Hopefully, the above was helpful. In the next blog post, I will cover the tools and services used in fleet management.