

Oracle Globally Distributed AI Database (GDD) is a distributed SQL database that combines horizontal scalability and fault tolerance with Oracle Database’s full SQL capabilities and transactional consistency. The data is stored in servers, called shards, that are distributed across multiple data centers and regions.
Oracle Globally Distributed AI Database can be deployed on Oracle Cloud Infrastructure (OCI), on-premises, hybrid cloud, multicloud, and Exadata Cloud@Customer.
This demonstration uses Oracle Database 26ai Free on Kubernetes to evaluate Oracle Globally Distributed AI Database under common failure conditions. The workload is intentionally modest because the goal is to evaluate resiliency rather than peak throughput.
Across all observed scenarios, failures remain localized to the affected shard while healthy shards continued processing customer transactions. GDD automatically moved leadership when necessary, limiting throughput impact to brief dips during topology changes. The principal application-visible effect was a small number of transient connectivity or routing errors, followed by rapid recovery.
How We Define Resiliency
Resiliency Means Useful Work Continues
For these tests, throughput is the primary measure of resiliency because it shows how much useful work the application continues to complete during and after a failure. Errors and warnings still matter, but they provide only a partial view of system health. A system can report errors and continue doing useful work or report few errors while application threads are blocked, and throughput collapses.
This distinction matters during failover and switchover events. Some client threads may encounter transient errors, recover quickly, and continue processing. Others may wait until a resource becomes available again. In the latter case, the system may look quiet from an error-count perspective while application performance and responsiveness are significantly affected.
The first chart illustrates this point. During a shard outage, Oracle GDD recorded a small number of client-side errors from threads that attempted to connect to the affected shard. Those errors did not stop the overall workload. The application continued processing on available shards, and throughput showed only a brief dip before returning to its prior range.
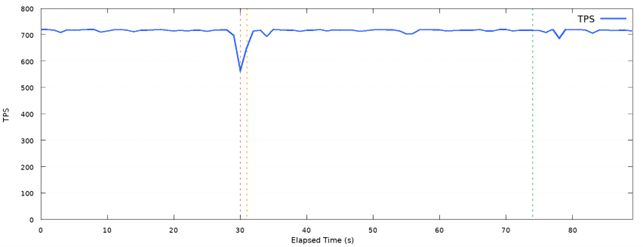
Figure 1: Oracle GDD throughput shows only a brief dip after a node is removed, then stabilizes again.
The next chart shows a planned node failure in another distributed database – from an Oracle competitor. No errors were reported because client threads waited for recovery. Throughput, however, dropped to zero for a short interval. From the application’s point of view, the system did no useful work during that window.
In transaction processing systems, where SLAs are often measured in low milliseconds, maintaining availability and throughput is critical. Simply driving TPS to zero to avoid exposing errors may improve perceived correctness, but it does so at the expense of the very latency and availability objectives the system is expected to satisfy.
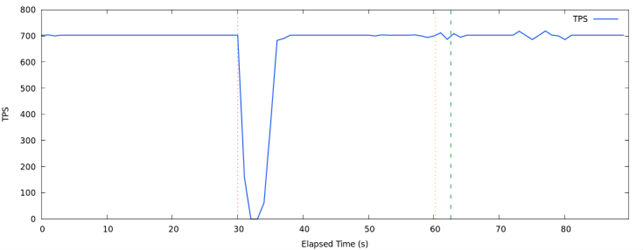
Figure 2: A competitor’s application reports no errors during a planned node failure, but throughput drops to zero before recovering.
The workload was intentionally limited to a fraction of available system resources, so both systems could sustain the same throughput under normal operating conditions. This evaluation is therefore not a maximum-throughput comparison; it is a resiliency comparison focused on failure’s impact and recovery behavior.
Resiliency depends on Recovery
Errors do not mean data loss. Transient errors do not imply data loss. Requests that encounter temporary failures can be retried once the required data becomes available, which in Oracle Globally Distributed AI Database (GDD) typically occurs within seconds. This recovery model is readily implemented using well-established application patterns such as retries and dead-letter queues.
Application deployments have traditionally used Oracle features such as Fast Application Notification (FAN) to handle transient database events. In an Oracle GDD environment, these errors indicate a temporary delay in data availability rather than a permanent failure. Applications can respond by rescheduling the affected request and proceeding with other useful work while waiting for the data to become accessible.
Blast Radius
Blast radius describes how far the impact of a failure spreads. In Oracle Globally Distributed AI Database, a shard is a unit of fault isolation: a shard failure should not prevent healthy shards from continuing to serve work. When shards are distributed across availability zones or regions, those locations also become fault-isolation boundaries.
The objective is to keep the impact local to the failed component, whether that component is a shard, availability zone, or region. If throughput drops to zero across the full workload after a single shard event, the blast radius has expanded beyond that shard. The tests below demonstrate the opposite behavior: localized disruption, rapid role movement or pod recovery, and continued throughput on the remaining available shards.
Testing Goals
The tests shown here were designed to answer a practical question: what happens to a GDD workload when parts of the system fail or become degraded?
The scenarios tested included:
- Repeated short network partitions
- Planned leadership rebalancing
- A full network partition of one shard
- Severe bandwidth restriction on one shard
- Disk I/O latency on one shard
Across these tests, the system generally absorbed failures with short-lived dips in throughput and a small number of client-visible connection errors. In all cases, throughput returned quickly to the prior range while the cluster continued operating with the remaining shards.
Tools We Used
Our environment used the following publicly available tools, allowing the test setup and failure scenarios to be reproduced:
| Tool | Details |
| Oracle Database 26ai Free | Available at: Oracle AI Database Free. Oracle provides a free edition of its 26ai database for trial usage, not production. Due to enforced DB Free limitations, it is unsuitable for demonstrating absolute performance or capabilities. |
| Oracle Database Operator for Kubernetes | Oracle Operator extends the Kubernetes API with custom resources and controllers for automating the Oracle Database lifecycle. The code is available on: Github for Oracle Database Operator. |
| Swingbench with Sharding support | Swingbench is a Java workload generator that uses Oracle’s Universal Connection Pool (UCP). It can be configured with variable users, transaction types, think times, and pool properties to generate a workload. The 26.3 JDBC Drivers were used in this testing. |
| Chaos Mesh | Used for injecting pod, network, bandwidth, and I/O failures. Available at: Chaos Mesh |
Deployment Overview
The test environment uses Oracle Kubernetes Engine (OKE), Oracle Database Operator, Oracle Database 26ai Free, Swingbench, and Chaos Mesh. Detailed setup steps for GDD on Kubernetes are covered in the companion blog post, Deploying Oracle Globally Distributed AI Database 26ai on Kubernetes with Oracle DB Operator.
First, ensure that native replication is enabled by adding the following line to the YAML for the deployment of Oracle AI Database Free if it is not already present:
| replicationType: “native” |
Workload Configuration
The workload used Swingbench’s sharded order entry scripts, installed into the catalog database. The test used a single transaction type: customer registration, implemented as an insert into the CUSTOMERS table.
Swingbench was run with 30 users and a think time between 325 and 350 milliseconds:
| $ charbench -c configs/ShardJDBC_Cust_Test.xml -uc 30 -intermin 325 -intermax 350 -v users,tps,errs,vresp,pool |
This produced a workload of roughly 90 transactions per second. The workload was intentionally modest in order to work with the resource limitations imposed by Oracle AI Database 26ai Free. The purpose was to demonstrate resiliency behavior, not maximum throughput.
The UCP connection pool was fixed at 90 connections for most tests:
| <PooledInitialLimit>90</PooledInitialLimit> <PooledMinLimit>90</PooledMinLimit> <PooledMaxLimit>90</PooledMaxLimit> |
Establish stable throughput before beginning resiliency testing. The default deployment configuration should be capable of this; if not, confirm that the Kubernetes nodes and database pods have sufficient resources.
Scenario 1: Repeated Short Network Failures
The first test introduced a recurring partial failure: one shard experienced a five-second network partition followed by one second of availability, repeated continuously. This might happen with an unreliable network but nevertheless this should not impact the reliability of the system.
The Chaos Mesh schedule used this pattern:
| … kind: Schedule … spec: schedule: ‘@every 6s’ concurrencyPolicy: Forbid type: NetworkChaos networkChaos: action: partition mode: one duration: ‘5s’ selector: … type: Shard statefulset.kubernetes.io/pod-name: shard3 |
When the shard was first disconnected, the system moved leadership away from that shard, and the other two shards took over. The first disruption produced 14 errors, all ORA-17008: Closed connection. After that initial adjustment, no further errors were observed during the test.
The shard remained active as a follower and continued participating in the replication environment. The disruption can be seen in the TPS graph below at the 53s mark.
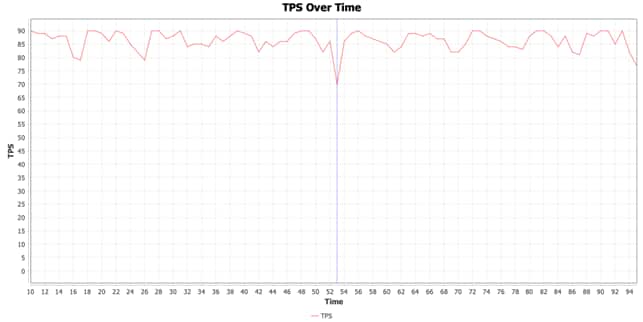
Figure 3: Repeated short partitions caused initial connection errors, but TPS remained broadly stable after leadership moved away from the affected shard.
Scenario 2: Planned Leadership Rebalance
A leadership change is a planned failover. In this test, the system started from an intentionally unbalanced state after a previous outage. A rebalance command was issued to distribute replication unit leaders across the three shards. This causes a brief disruption as shards change roles from followers to leaders and vice versa:
| GDSCTL> switchover ru -rebalance The operation completed successfully |
The rebalance caused a brief throughput dip. In the observed run, average throughput was 86 TPS, with a one-second dip to 78 TPS.
The following events were recorded during the transition:
- 2 errors for DML attempted on a follower shard
- 3 errors where a chunk was not found or had moved to another shard
- 2 UCP-29: Failure to get a connection warning
The result is a useful reminder that planned failover can still be visible to active client threads, depending on timing. Applications should retry transient errors during topology changes. If the goal is zero client-visible errors, longer timeouts and retries can be configured, but that choice may trade visible errors for lower throughput while threads wait.
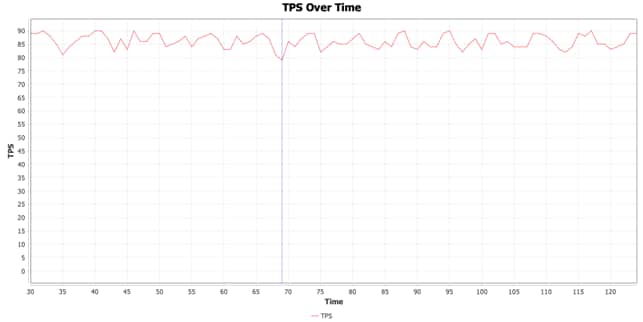
Figure 4: Planned leadership rebalancing produced a short (1s) throughput dip around 70s in, while replication unit leaders were redistributed.
Scenario 3: Full Network Partition
A full network partition isolates one shard from the rest of the cluster and from the workload client. This does not necessarily trigger Kubernetes’ pod recovery because the pod is still visible to the control plane. In real production systems, this might be a problem with the network interfaces on one machine.
Chaos Mesh was used to isolate shard1-0 from the catalog, Global Service Managers (GSM), other shards, and the Swingbench client:
| … kind: NetworkChaos … spec: action: partition mode: all selector: pods: shns: – shard1 direction: both target: mode: all … duration: “3m” |
When the partition was introduced, throughput dropped to 76 TPS for one second, compared with an average of 84 TPS. This occurred at 111s into the run.
The system then returned to its prior throughput range while operating with two of the three shards available. Fourteen connection errors were recorded during the disruption, all ORA-17008: Closed connection.
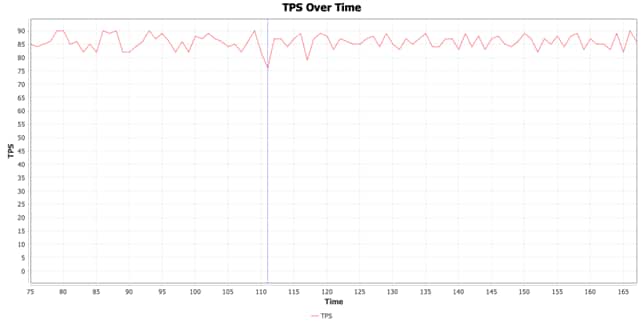
Figure 5: Isolating one shard caused a one-second TPS drop before the workload recovered on the remaining available shards.
Scenario 4: Severe Bandwidth Restriction
The next test restricted bandwidth to and from one shard instead of fully isolating it. The bandwidth limit was set to 256 bps:
| … kind: NetworkChaos … spec: action: bandwidth mode: one duration: “30s” selector: … type: Shard statefulset.kubernetes.io/pod-name: shard3 bandwidth: rate: “256bps” limit: 1 buffer: 10 |
The workload showed a sharper dip as threads attempted to communicate with the slow shard, but the dip lasted only one second. Eleven errors were recorded, all ORA-17008: Closed connection.
The shard was quickly removed as leader but continued as an active follower. Even under the severe bandwidth restriction, the workload recovered and customer transactions continued with almost no visible interruption. The ‘outage’ continued for 30 seconds but it had no further visible impact on the system.
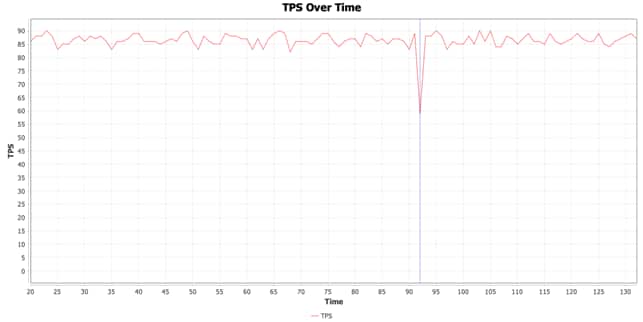
Figure 6: A 256 bps bandwidth limit caused connection errors and a short-lived throughput dip in the observed workload.
Scenario 5: Disk I/O Latency
The disk latency test added a 50-millisecond delay to 50% of file operations under the Oracle data directory where all the database files and replication logs are stored:
| … kind: IOChaos … spec: action: latency mode: one selector: … type: Shard statefulset.kubernetes.io/pod-name: shard1 volumePath: /opt/oracle/oradata path: /opt/oracle/oradata/**/* delay: 50ms percent: 50 duration: 400s |
As in several earlier tests, there was a short, barely noticeable dip when the affected shard was removed as leader. Throughput dropped for one second but stayed within the previous range. The I/O delay remained active on that shard, but it did not noticeably affect ongoing throughput and the processing of customer transactions after leadership moved away.
Other runs showed sharper drops, down to 70-75 TPS, but the system recovered in sub-seconds.
Fourteen ORA-17008: Closed connection errors were recorded during the transition.
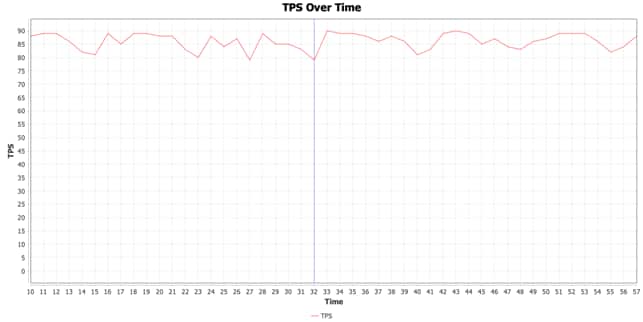
Figure 7: Injected I/O latency caused a brief TPS drop while leadership moved away from the affected shard.
What the Tests Show
These tests show that Oracle Globally Distributed AI Database Free can continue processing customer transactions through several common failure modes. Across the observed scenarios, failures remained localized to the affected shard, allowing healthy shards to continue serving the workload. The primary application-visible effect was a short burst of transient connection errors during topology changes, most commonly ORA-17008: Closed connection.
The key observations we made here were:
- Network partitions and bandwidth limits caused the leadership role to be removed from the affected shard.
- Planned leadership rebalance produced only a brief, expected transition.
- Disk latency on one shard caused a sub-second throughput dip before leadership moved.
- In all cases, throughput recovered quickly, with no disruption lasting longer than one second.
The full test summaries are below:
| Scenario | Observed Impact | Recovery / Behavior |
| Repeated Short Network Failures | Initial disruption; TPS broadly stable afterward | Automatic leadership move |
| Planned Leadership Rebalance | 1s dip from 86 to 78 TPS | Manual planned rebalance |
| Full Network Partition | 1s dip from 84 to 76 TPS | Automatic workload recovery on remaining shards |
| Severe Bandwidth Restriction | 1s short-lived dip | Automatic leadership move; shard stayed follower |
| Disk I/O Latency | 1s dip | Automatic leadership move |
The practical application takeaway is straightforward: applications should treat these events as temporary conditions, retry affected requests where appropriate, and continue processing customer transactions while the system recovers.ransient database connectivity or routing failures and use retry logic appropriate for idempotency and transaction semantics.
Final Thoughts
Using Oracle Database Operator, Oracle Database 26ai Free Edition, Swingbench, and Chaos Mesh, you can build a small, reproducible Kubernetes environment for evaluating the resiliency of Oracle Globally Distributed AI Database (GDD) under representative failure scenarios. The scenarios presented here are intended to demonstrate resiliency behavior and functional validation rather than performance.
Although these tests are not a substitute for production-scale validation, they show that many of Oracle GDD’s core resiliency capabilities – including fault isolation, fast automatic recovery, and workload continuity can be observed, validated, and reproduced even in a constrained Oracle Database 26ai Free Edition environment using publicly available tools.