

The rapid adoption of Internet of Things (IoT) technologies is transforming how energy and utility providers monitor electricity consumption and manage energy distribution. Smart meters and advanced metering infrastructure (AMI) enable utilities to collect real-time consumption data from millions of devices across homes, commercial facilities, and industrial environments.
As smart meter deployments expand, utilities must process enormous volumes of telemetry data while maintaining high performance, reliability, and scalability. These systems must support continuous data ingestion, complex data processing pipelines, and large-scale analytical workloads.
To address these challenges, organizations are increasingly adopting distributed database architectures. Oracle Globally Distributed Database provides horizontal scalability, resilience, and SQL-based analytics capabilities, making it well suited for large-scale IoT data platforms.
This article focuses on scaling ingestion and SQL analytics for smart meter telemetry using Oracle Globally Distributed Database. It highlights data distribution patterns, processing workflows, and performance characteristics for large time-range aggregation queries.
Smart Meter IoT Architecture
Modern smart metering systems rely on Advanced Metering Infrastructure (AMI) to collect and manage electricity usage data from millions of power meters.
AMI enables:
- Automated meter reading
- Continuous transmission of consumption data
- Bidirectional communication between meters and utility systems
- Real-time monitoring of electricity usage
These systems allow utilities to deliver detailed insights into electricity consumption while enabling customers to monitor and manage their energy usage.
IoT Data Growth and Scalability Challenges
Smart meters continuously emit telemetry data at very granular intervals. As the number of deployed meters grows, the volume of collected data increases rapidly.
In many environments, the data footprint is expected to grow tenfold over the next 4-5 years, requiring database systems capable of supporting massive scale.
Key challenges include:
- Handling High-Volume IoT Data Streams: Millions of devices generate continuous data streams that must be ingested and processed in real time.
- Scaling Data Processing Pipelines: IoT platforms rely on multiple concurrent jobs for validation, normalization, forecasting, and aggregation of meter readings.
- Maintaining Performance for Analytical Queries: Energy consumption analytics and billing operations require fast query execution across very large datasets.
- Maintaining Data Integrity: Energy billing systems must maintain strict transactional consistency to help produce accurate calculations.
Database Requirements for Smart Meter Systems
Supporting large-scale IoT platforms requires a database architecture capable of meeting several key requirements.
- Resiliency: The system must remain operational despite infrastructure failures, maintaining continuous ingestion of IoT telemetry data.
- Horizontal Scalability: The architecture must support scale-out data storage and processing as the number of devices and data volumes grow.
- SQL Compatibility: Utilities rely heavily on SQL-based analytics and reporting workflows.
- Transaction Integrity: Accurate billing and consumption analysis depend on ACID-compliant transaction for correctness.
- Data Sovereignty: Utility data often needs to align with data residency and locality requirements, requiring flexible data placement capabilities.
Data Processing Workflow
The database platform acts as the central repository for telemetry data generated by smart meters. Data flows through multiple processing stages before being used for analytics and reporting.
Data Ingestion
Meter readings are initially collected by a Head-End System (HES). The HES aggregates incoming device telemetry and forwards the data into the database environment.
Incoming data is typically staged using:
- External tables
- Message queues
- Streaming ingestion pipelines
These staging layers may temporarily store several terabytes of data before processing.
Data Validation and Normalization
After ingestion, the system performs normalization and validation steps to provide data accuracy and consistency.
Typical operations include:
- Data validation
- Detection of missing meter readings
- Estimation of missing values using algorithms
- Data format normalization
Handling Delayed Metadata
In some cases, additional attributes such as regional identifiers or meter location may not be immediately available when readings arrive. These attributes may be attached later in the processing pipeline, introducing additional complexity in data management.
Parallel Data Processing
Multiple concurrent jobs process incoming data streams daily. These jobs may perform tasks such as:
- Data validation
- Missing data estimation
- Consumption forecasting
- Aggregation of electricity usage metrics
Reporting and Analytical Workloads
Smart meter platforms generate large volumes of reporting queries used for operational monitoring and billing processes. Typical analytical workloads include:
- Daily electricity consumption reports
- Regional energy usage analysis
- Customer energy usage comparisons
- Forecasting electricity demand
Aggregation operations are common, requiring efficient execution across large datasets. To support these workloads, the distributed database architecture must provide efficient parallel query execution and scalable data distribution.
Distributed Database Architecture
Oracle Globally Distributed Database enables a scale-out architecture by distributing data across multiple shards while maintaining a single logical database view. In this architecture:
- Data is partitioned across multiple shards
- Each shard stores a subset of the overall dataset
- Queries are executed in parallel across shards
- Results are aggregated transparently for applications
This architecture enables both high performance and horizontal scalability, allowing the platform to process growing IoT workloads efficiently.
Deployment Architecture
A typical deployment for petabyte-scale IoT workloads may include:
- Multiple database shards distributed across infrastructure nodes
- A shard catalog storing metadata and duplicated tables used across shards
Each shard stores a portion of the total dataset.
In one example deployment architecture:
- Six database shards are used across 2 OCI regions
- Two shardgroups: primary and standby for high availability
- Approximately 13 TB of data is stored per shard
- A separate 5 TB shard catalog maintains duplicated tables
This architecture enables the system to scale data processing capacity as the number of connected IoT devices grows.
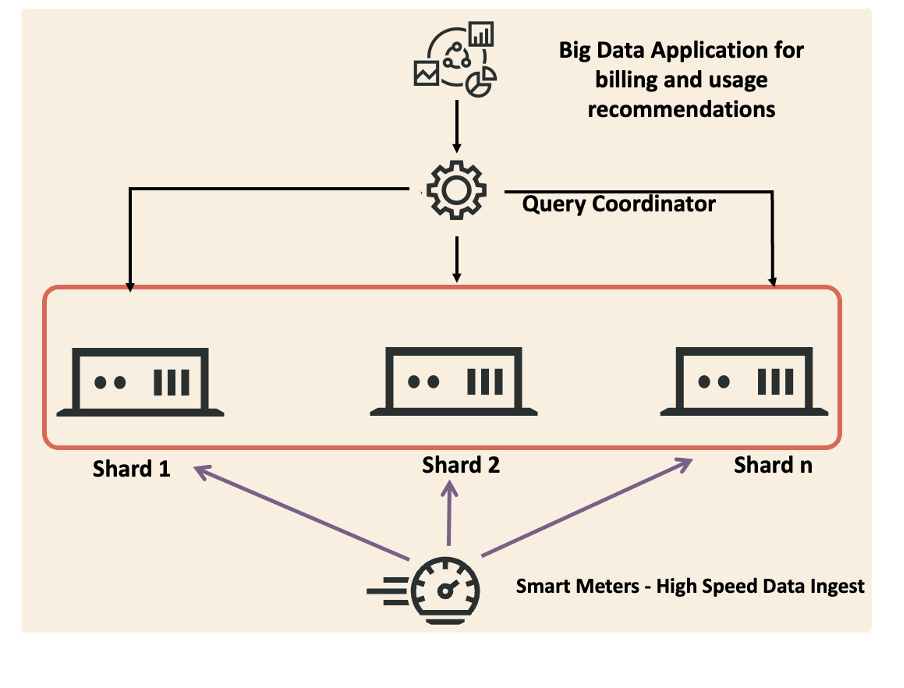
Distributed Database Architecture for a Smart Meter Application
Data Distribution Strategy
To support efficient query execution and ingestion performance, tables are organized into table families and distributed across shards using consistent hashing. Two example table families include:
SMD Tables
- Sharded using a meter identifier (MID)
- Sub-partitioned using timestamp attributes
AMRD Tables
- Sharded using a regional identifier (RID)
- Sub-partitioned using timestamp attributes
Performance Evaluation: Distributed Architecture at Scale
To evaluate the performance characteristics of the distributed architecture, analytical queries were executed over varying time ranges using different degrees of parallelism. The goal was to measure how the system performs as the volume of IoT telemetry data increases.
The benchmark compared query execution times for a standalone database environment and a distributed deployment using Oracle Globally Distributed Database.
| Time Period | Parallel | Standalone Database | Oracle Globally Distributed Database |
| 1 day | 16 | 00:02:21.58 | 00:01:38.85 |
| 10 days | 16 | 00:23:39.76 | 00:05:55.55 |
| 30 days | 16 | 01:18:42.29 | 00:15:21.56 |
| 10 days | 32 | 00:14:47.59 | 00:05:19.17 |
| 30 days | 32 | 00:49:34.10 | 00:15:27.23 |
Key observations:
The distributed database architecture demonstrated several performance advantages as data volumes increased:
- Faster Query Execution: Analytical queries executed significantly faster due to parallel processing across shards.
- Improved Scalability: Performance scaled efficiently as the time range and data volume increased.
- Efficient Parallel Processing: Increasing the degree of parallelism improved performance without introducing instability.
- Consistent Performance at Large Data Volumes: The architecture maintained predictable query execution times even when processing larger datasets.
Delivering Real-Time Billing and Usage Insights
Smart meter applications require the ability to process massive telemetry datasets while generating accurate billing calculations and consumption insights. A distributed architecture allows utilities to:
- Process granular electricity usage data continuously
- Perform large-scale analytics across historical datasets
- Generate billing reports efficiently
- Deliver real-time insights into energy consumption patterns
Conclusion
The rapid expansion of smart meter deployments is driving unprecedented growth in IoT telemetry data. Traditional database architectures often struggle to scale efficiently under these conditions.
Oracle Globally Distributed Database provides a scalable foundation for building modern smart meter platforms by enabling:
- Horizontal scalability
- High-speed parallel data ingestion
- Distributed query execution
- Fault-tolerant architecture
By adopting a distributed database design, organizations can build IoT platforms capable of supporting petabyte-scale energy data processing while delivering real-time analytics and billing insights.
Resources:
Globally Distributed AI Database oracle.com product page