How can you verify or even guarantee SQL performance when migrating from an on-premises database to another environment e.g. autonomous database? How can tests be easily accomplished – especially when it comes to SQL workloads? What can be done against the “uncertain” feeling of not having “caught” all statements during testing or perhaps having overlooked important ones? And how to get an overall and clear “statement” about the performance of the statement workload?
Two technologies in Oracle Database could solve these tasks – in particular SQL Tuning Sets (STS) and SQL Performance Analyzer (SPA). Both are available in on-premises installation, in Oracle Cloud and also in Oracle Autonomous Database.
SQL Tuning Sets have been around since the introduction of the SQL Tuning framework in the Oracle database. As the name suggests, an STS is a collection of SQL statements that is stored as an object in the database under a user-defined name. The interesting thing about this is that not only the SQL commands themselves are stored, but also the associated information about the execution.
An SQL Tuning Set consists of the following components:
- One or more SQL statements
- Context for execution such as bind variables (*), parsing scheme, etc.
- Basic execution statistics such as elapsed time, CPU time, etc.
- Execution plans
(*) Note: If you use a large amount or size of bind variables, keep in mind that there is an internal limit. You may adjust the internal parameter _cursor_bind_capture_area_size. It defines how much bind data we can keep in the memory for each query.
In general, a SQL Tuning Set enables you to group SQL statements and related metadata in a single database object, which you can use to meet your tuning goals. Filter criteria like parsing schema, module, action, command type, cpu time etc can be combined to build a specific SQL Tuning Set and satisfy certain performance or environment requirements.
Please read also our posting “Oracle SQL Tuning Sets (STS) – The foundation for SQL Tuning” and have a look at our scripts downloadable from Github.
But how to perform tests with the SQL Tuning Sets? This is where the SQL Performance Analyzer, a component of Real Application Testing, comes into play.
SQL Performance Analyzer (SPA) as part of Real Application Testing enables you to assess the impact of system changes on the response time of SQL statements. You can run SQL Performance Analyzer on a production system itself or on a remote system. SQL Performance Analyzer focuses on detailed statement analysis of a defined SQL workload made available via a SQL Tuning Set. The workload is run twice – once BEFORE the change and then AFTER a change. The result is a detailed comparative analysis (before and after the change) of the individual statements, measured by different metrics such as elapsed time, cpu_time, etc. Optionally, you can automate the tuning process using SQL Tuning Advisor or SQL Plan Baselines. In this way, statements from the workload can not only be tested and compared, but also tuned if necessary.
To illustrate the interaction of both techniques, the following posting demonstrates the necessary steps in the source system and in the target system (Autonomous Database). To reach as many Oracle users as possible, we show the usage in linemode and use the two packages DBMS_SQLTUNE for the SQL Tuning Set and DBMS_SQLPA for SQL Performance Analyzer.
Note: You can find all the scripts used in this posting on Github.
More information about the additional documentation are found at the end of the posting. It is easier with the graphical component – the Enterprise Manager Cloud Control, whose use in these cases is self-evident without further explanation.
Source Database
1. Create STS
In our case we use the possibility to create an STS from AWR snapshots. We use the filter criteria SQL text, parsing schema and the number of executions. The following snippet shows a code example.
-- check existing STS
SELECT name, owner, created, statement_count
FROM dba_sqlset where owner!='SYS';

-- drop and create an empty STS
execute dbms_sqltune.drop_sqlset(sqlset_name=>'STS1', sqlset_owner=>'DWH1');
execute dbms_sqltune.create_sqlset(sqlset_name=>'STS1', sqlset_owner=>'DWH1')

-- create statements from AWR snapshots
DECLARE cur dbms_sqltune.sqlset_cursor;
 BEGIN OPEN cur
   FOR SELECT VALUE(P) FROM dbms_sqltune.select_workload_repository(begin_snap=>235, end_snap=> 236,
   basic_filter => 'sql_text like ''SELECT%'' and executions<3 and parsing_schema_name = ''DWH1''') P;
   dbms_sqltune.load_sqlset (sqlset_name => 'STS1', populate_cursor => cur);
END;
/
-- check statements of the STS
SELECT executions, cpu_time/1000, elapsed_time/1000, sql_id, substr(sql_text,1,80)
FROM dba_sqlset_statements
WHERE sqlset_name='STS1' ORDER BY 3 desc
If you want to increase the number of topn SQL statements in the snapshots, you can use DBMS_WORKLOAD_REPOSITORY.MODIFY_SNAPSHOT_SETTINGS for this purpose.
execute dbms_workload_repository.modify_snapshot_settings(topnsql => 100);2. Pack STS in a staging table
This procedure copies the information of the STS to the staging table S_TABLE created by the CREATE_STGTAB_SQLSET procedure. Please avoid using the tablespace SYSTEM as storage location.
drop table staging_table;
-- create an empty staging table S_TABLE
execute dbms_sqltune.create_stgtab_sqlset(table_name => 'S_TABLE');
-- copy STS information in the staging table S_TABLE
execute dbms_sqltune.pack_stgtab_sqlset(sqlset_name => 'STS1', -
                                        sqlset_owner => 'DWH1', -
                                        staging_table_name => 'S_TABLE');
3. Data Pump export of the staging table
expdp DWH1/"password"@servicename tables= S_TABLE directory=STSDIR dumpfile=stagingfile.dmp
Autonomous Database ATP
1. Copy the dmp file in Oracle object storage

Image 1: dmp file in Oracle object storage
2. Data Pump import with SQL Developer, Instant Client, Cloud Shell etc.
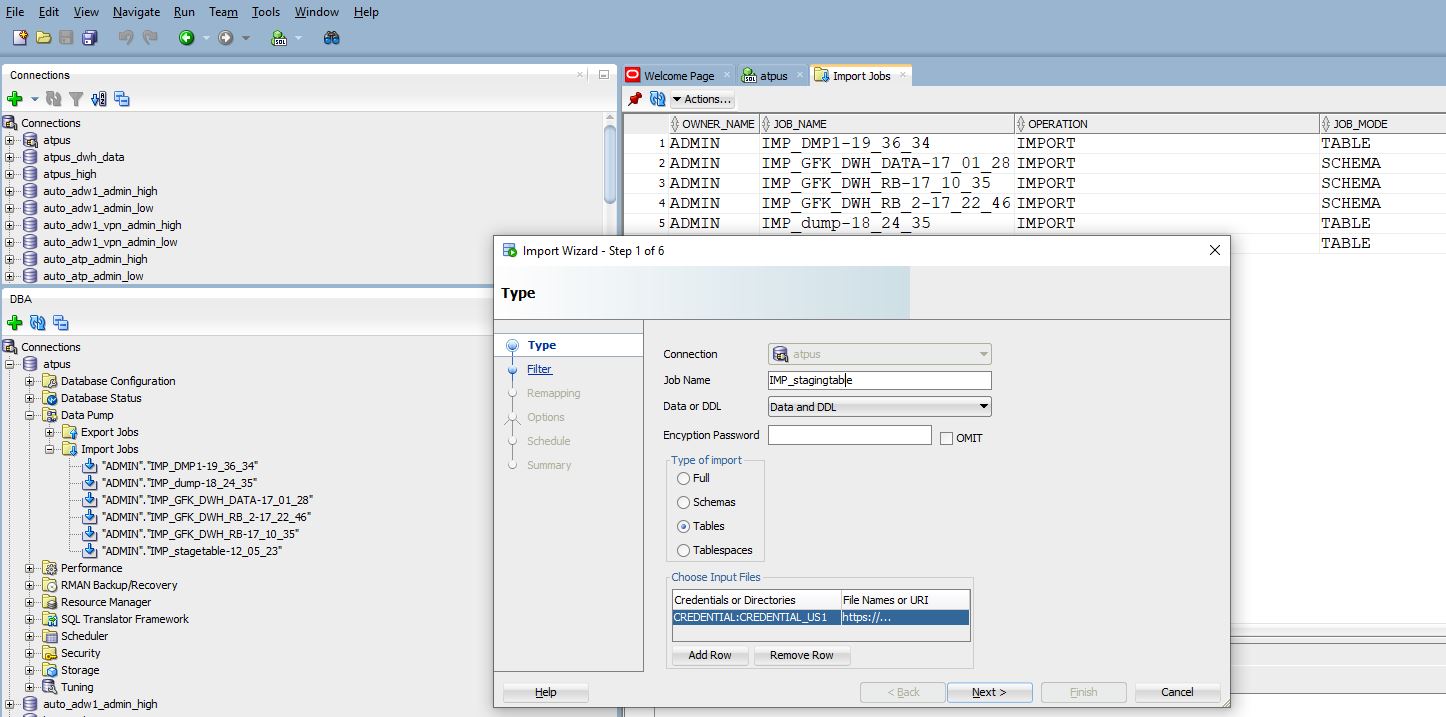
Image 2: Data Pump Import in SQL Developer
3. Unpack STS
This procedure copies the STS from the staging table into the SQL tuning set schema, making it a proper SQL tuning set. In the following example the user DWH1 also exists in the Autononous Database. If you want to use a different owner, a mapping with DBMS_SQLTUNE.REMAP_STGTAB_SQLSET is necessary.
execute dbms_sqltune.unpack_stgtab_sqlset(sqlset_name => 'STS1', -
                                          sqlset_owner => 'DWH1', -
                                          replace => TRUE, -
                                          staging_schema_owner => 'DWH1', -
                                          staging_table_name => 'S_TABLE');
After that you can check the success of the action using the data dictionary views DBA_SQLSET and DBA_SQLSET_STATEMENTS.
SQL Performance Analyzer
Now the tests with SQL Performance Analyzer in Autonomous Database can begin. As described before, the execution statistics from two tests trials are compared with each other. The first test trial provides the execution statistics information from the source system; the second test trial from the Autonomous Database. In addition, further test runs can of course be carried out.
1. Analysis task creation
As with most tuning tasks in the Oracle database, an analysis task is required first.
-- drop and create an analysis task
execute dbms_sqlpa.drop_analysis_task(task_name => '&taskname');
declare tname varchar2(100);
begin
   tname := dbms_sqlpa.create_analysis_task(sqlset_name => '&STSname')
end;
/
-- check the tasks
SELECT task_name, status, advisor_name
FROM user_advisor_tasks;
2. First trial
Now the SQL execution statistics from a first workload are needed. Either you execute the workload via database links in the source database or you use the possibility to use the information from the imported STS directly. The setting is made via the parameter EXECUTION_TYPE, e.g.
-
[TEST]EXECUTE– test-execute every SQL statement and collect its execution plans and execution statistics. The resulting plans and statistics will be stored in the advisor framework. This is default. -
CONVERT SQLSET– used to read the statistics captured in a SQL Tuning Set and model them as a task execution. This can be used when you wish to avoid executing the SQL statements because valid data for the experiment already exists in the SQL Tuning Set.
In our example we use the option CONVERT SQLSET applied to the imported and unpacked SQL Tuning Set STS1.
-- list the task name
SELECT task_name, status, advisor_name
FROM user_advisor_tasks;

-- convert STS
execute dbms_sqlpa.execute_analysis_task(task_name => '&taskname', -
            execution_type => 'convert sqlset', -
            execution_name => 'first_run', -
            execution_params => DBMS_ADVISOR.ARGLIST(
                                 'sqlset_name', 'STS1', -
                                 'sqlset_owner', 'DWH1'));
3. Second trial
Now we execute the second test run with parameter EXECUTION_TYPE test execute in the Autonomous Database environment.
execute dbms_sqlpa.execute_analysis_task(task_name => '&taskname', -
                                         execution_type => 'test execute', -
                                         execution_name => 'second_run');
Of course, further test runs can be performed. Use the TEST EXECUTE setting and assign a name for the execution – for example THIRD_RUN, FOURTH_RUN etc.
Good to know: For the execution statistics per test run, the statistics are averaged over multiple executions (5 or even more). However, this means if I/O occurs on the first execution, this information is included in the statistics. To compensate this, it may be useful to perform more than one SPA TEST EXECUTE test run.
4. The Comparison
By default we always compare the results of the two last executions. The SQL Performance Analyzer uses the elapsed_time as a default metric for comparison. With DBMS_ADVISOR.ARGLIST you can change the default metric or other analysis task parameters.
execute dbms_sqlpa.execute_analysis_task(task_name => '&taskname', -
                                         execution_type => 'compare', -
                                         execution_name => 'comparison', -
                            execution_params => DBMS_ADVISOR.ARGLIST('workload_impact_threshold', 0,-
                                                                     'sql_impact_threshold', 0));
If you want to compare different test runs and not only the last two, you can do this with the following command:
execute dbms_sqlpa.execute_analysis_task(task_name => '&taskname', -
                                         execution_type => 'compare', -
                                         execution_params => DBMS_ADVISOR.ARGLIST('execution_name1', 'first run',-
                                                                                  'execution_name2', 'third_run', -
                                                                                  'workload_impact_threshold', 0, -
                                                                                    'sql_impact_threshold', 0));
Here the test run FIRST_RUN is compared with the test run THIRD_RUN.
5. Reports
Now reports can be generated in different formats. The LEVEL parameter can be used to generate additional detailed reports on individual topics, such as reports on statements with changed plans (CHANGED_PLANS), regressed (REGRESSED) or improved (IMPROVED) statements.
The following code snippet shows the generation of a summary report. In our case the metric elasped_time is used, which is the default. But this can be changed to other metrics by simply calling EXECUTE_ANALYSIS_TASK in step 4 with changed EXECUTION_PARAMS.
-- summary report
VAR rep CLOB;
execute :rep := dbms_sqlpa.report_analysis_task(task_name => '&taskname', -
                                                type => 'HTML', -
                                                level => 'TYPICAL', -
                                                section => 'SUMMARY');

set long 1000000 longchunksize 1000000 linesize 200 head off feedback off echo off
spool summary.html
PRINT :rep
spool off
The following shows the generated summary report.
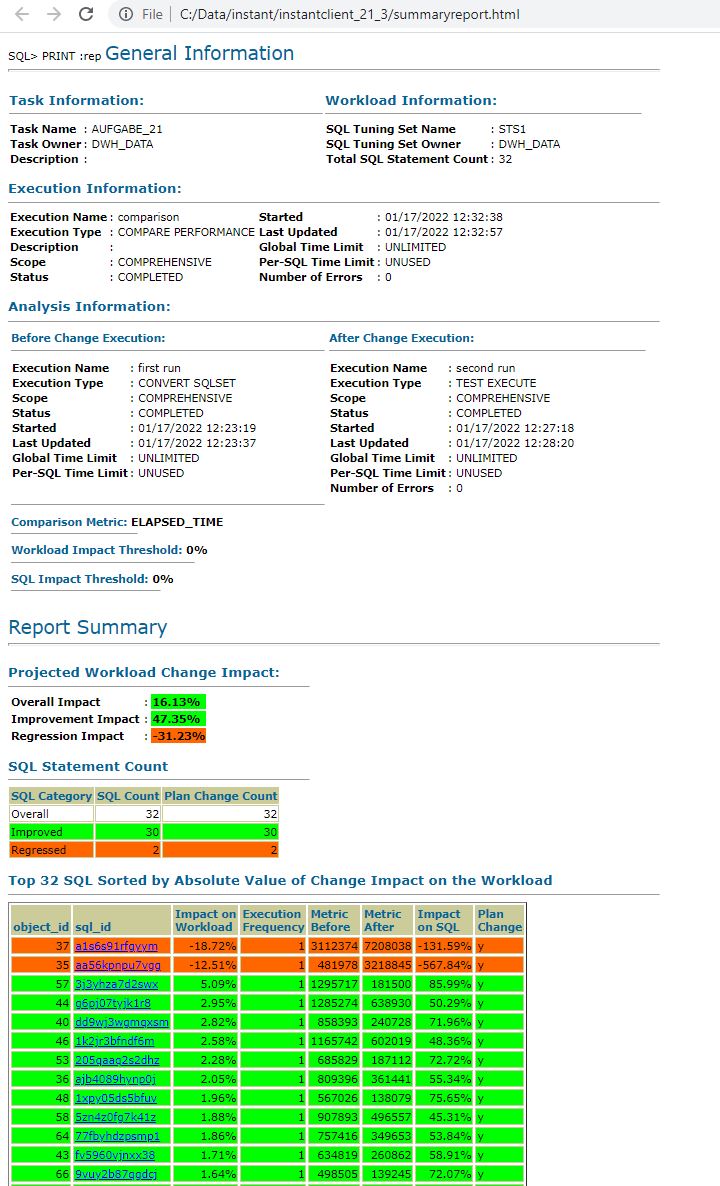
Image 3: Summary report
If you want to get more details like individual execution plans and execution statistics before and after the change, you can generate detailed HTML reports for the statements. You only need to change the parameters LEVEL and SECTION accordingly. To get an overview of all settings, you can find the description in the manual.
The following example shows all details in the report. We use the value ALL for SECTION and LEVEL.
VAR rep CLOB;
execute :rep := DBMS_SQLPA.REPORT_ANALYSIS_TASK(task_name => '&taskname', type => 'HTML', level=> 'ALL', section => 'ALL');
set long 1000000 LONGCHUNKSIZE 1000000 LINESIZE 200 pages 0
spool allreport.html
PRINT :rep
spool off
The following example shows a report for the “regressed” statements only.
-- details report about regressed statements
VAR rep CLOB;
execute :rep := dbms_sqlpa.report_analysis_task(task_name => '&taskname',-
                                                type => 'text', -
                                                level => 'REGRESSED', -
                                                section => 'ALL');

set long 1000000 longchunksize 1000000 linesize 200 head off feedback off echo off
spool detailregressed.html
PRINT :rep spool off
If many statements are affected, the cause should first be searched in the overall configuration. If only some statements are affected, there are two other options to deal with regressed statements. The first option would be to use the SQL Tuning Advisor and implement the recommendations – such as profiles, statement changes, statistics, alternate plans, etc. The other way would be to work with SQL Plan Management. The idea is to set the statements with their original “better” execution plans as SQL Plan Baselines. If you also want to implement one of these options in linemode, you may use the packages DBMS_SQLTUNE for SQL Tuning Advisor and DBMS_SPM for SQL Plan Management.
Conclusion
The advantages of SQL Performance Analyzer are its ease of use and wide range of reports. Furthermore, no reset/roolback is required after the tests, since DML statements are rolled back. The reports provide good documentation of the individual tuning steps and not only give a good overall view, but also provide evaluation options according to various metrics. If you do not have an Enterprise Manager Cloud Control available, you can use simple package calls in linemode for this purpose, as shown in the example. The handling for Autonomous Database does not differ from the usage in other Oracle Cloud or on-premises environments. SPA is pre-installed and available without further configuration. You can run SQL Performance Analyzer on a production system or a test system that should match the database environment of the production system as closely as possible. As shown in our example, using CONVERT SQLSET for the first test trial is an easy way to minimize the number of executions required in the source system. And furthermore what one of my colleagues just noted about his experience with SQL Performance Analyzer: “What I found cool as well is the possibility to do as many run as you want, changing one thing at a time between one run and another. Then compare any run with any other run is very useful.”
Further Information
Package DBMS_SQLPAPackage DBMS_SQLTUNE for Tuning AdvisorPackage DBMS_SQLTUNE for SQL Tuning SetsPackage DBMS_SPM for SQL Plan ManagementData Dictionary View DBA_ADVISOR_TASKData Dictionary View DBA_ADVISOR_EXECUTIONSTesting Guide: Part I SQL Performance Analyzer- Github: SQL Tuning Set scripts
- Github: SQL Performance Analyzer scripts