When it comes to analyzing “pure” SQL code, most Oracle user know how to do it – with their prefered tools such as DBMS_XPLAIN or SQL Developer, SQL traces, AWRs, SQL Access Advisor etc. But how do they find bottlenecks in PL/SQL code? PL/SQL Hierarchical Profiler is the solution here. It’s still the most important tool when there is a need to tune and analyze PL/SQL code and each PL/SQL developer and DBA should know about it.
PL/SQL hierarchical profiler is a free Oracle Database utility that breaks down the execution profile of a PL/SQL program by function calls, listing SQL and PL/SQL execution times separately. No special preparation of the source code or compiler is required; any PL/SQL program can be checked with it. It is available out-of-the-box in any Oracle Database installation – in cloud or on-premises installations. To show how easy it is to work with it, I will demonstrate the functionality with a short example.
Setup
To use the profiler, the following preparations are required:
-
EXECUTE privilege on package DBMS_HPROF
-
READ and WRITE privilege on a database directory to store trace files
- Creation of repository tables to store the information.
Note: The database directory can have any name. For automated use in SQL Developer (see later in this blog), however, the usage of the directory name PLSHPROF_DIR is a prerequisite for error-free usage.
Let’s perform the setup with a test user named PLTEST.
create directory PLSHPROF_DIR as '/home/oracle/pl';

grant all on directory plshprof_dir to pltest;

grant execute on dbms_hprof to pltest;

-- as user PLTEST
execute dbms_hprof.create_tables();
With the last call the tables DBMSHP_TRACE_DATA, DBMSHP_RUNS, DBMSHP_FUNCTION_INFO and DBMSHP_PARENT_CHILD_INFO are created. They store the information in the database schema and can be queried afterwards.
The following code example will be used for our test.
CREATE OR REPLACE PROCEDURE testprof AUTHID DEFINER IS
n NUMBER;
PROCEDURE foo IS
 BEGIN
   SELECT COUNT(*) INTO n FROM scott.emp;
   dbms_output.put_line('ausgabe: '||n);
 END foo;

BEGIN  -- test
   FOR i IN 1..3 LOOP foo;
END LOOP;
END testprof;
/
Usage
The procedure is simple. You only need to start the profiler, execute your sample application (in our case testprof) and stop the profiler.
execute dbms_hprof.start_profiling(LOCATION => 'PLSHPROF_DIR', FILENAME => 'run1.trc&');

execute testprof;

execute dbms_hprof.stop_profiling;
Note: START_PROFILING with parameter sqlmonitoring=YES (see documentation) generates a real-time monitoring report for a profiler run when the profiler run ends. The usage of Oracle Real-Time SQL Monitoring must be licenced.
If you take a look into the directory PLSHPROF_DIR you will find a trace file named run1.trc, which contains the so-called “raw profiler output” information – i.e. unformatted performance data. This data is in ASCII format and may be used for analysis.
However, we use the program plshprof (available in the directory $ORACLE_HOME/bin/). It generates formatted and readable HTML reports from the raw profiler output file.
The functionality can be described by calling
plshprof
Here is a sample output.
Version 19.12.0.0.0 Copyright (c) 1982, 2019, Oracle and/or its affiliates.  All rights reserved. Usage: plshprof [<option>...] <tracefile1> [<tracefile2>]
   Options:
     -trace <symbol>    (no default)     specify function name of tree root
     -skip <count>      (default=0)      skip first <count> invokations
     -collect <count>   (default=1)      collect info for <count> invokations
     -output <filename> (default=<symbol>.html or <tracefile1>.html)
     -summary                            print time only
Now we run plshprof with the trace file run1.trc. The result is the HTML file run1.html.
plshprof run1.trc
with output:
 [7 symbols processed]
 [Report written to 'run1.html']
A number of reports are generated that present and contextualize information from the output log. You can access them via the navigation via the corresponding hyperlinks. For example, the following three reports are a good starting point for an investigation:
-
Function Elapsed Time (microsecs) Data sorted by Total Subtree Elapsed Time (microsecs)
-
Function Elapsed Time (microsecs) Data sorted by Total Function Elapsed Time (microsecs)
-
SQL ID Elapsed Time (microsecs) Data sorted by SQL ID
Each report on function level is sorted by a certain attribute, e.g. by function time or by “subtree” time.
A detailed description of all sections of the plshprof report can be found in the Database Developer Guide in chapter 15.5 plshprof Utility.
The subroutines that the profiler analyzes are divided into so-called namespaces. For example “__plsql_vm” stands for PL/SQL Virtual Machine call, “__anonymous_block” for PL/SQL anonymous block and “__static_sql_exec_line#” for static SQL in line line#. Let’s have a look at our example.
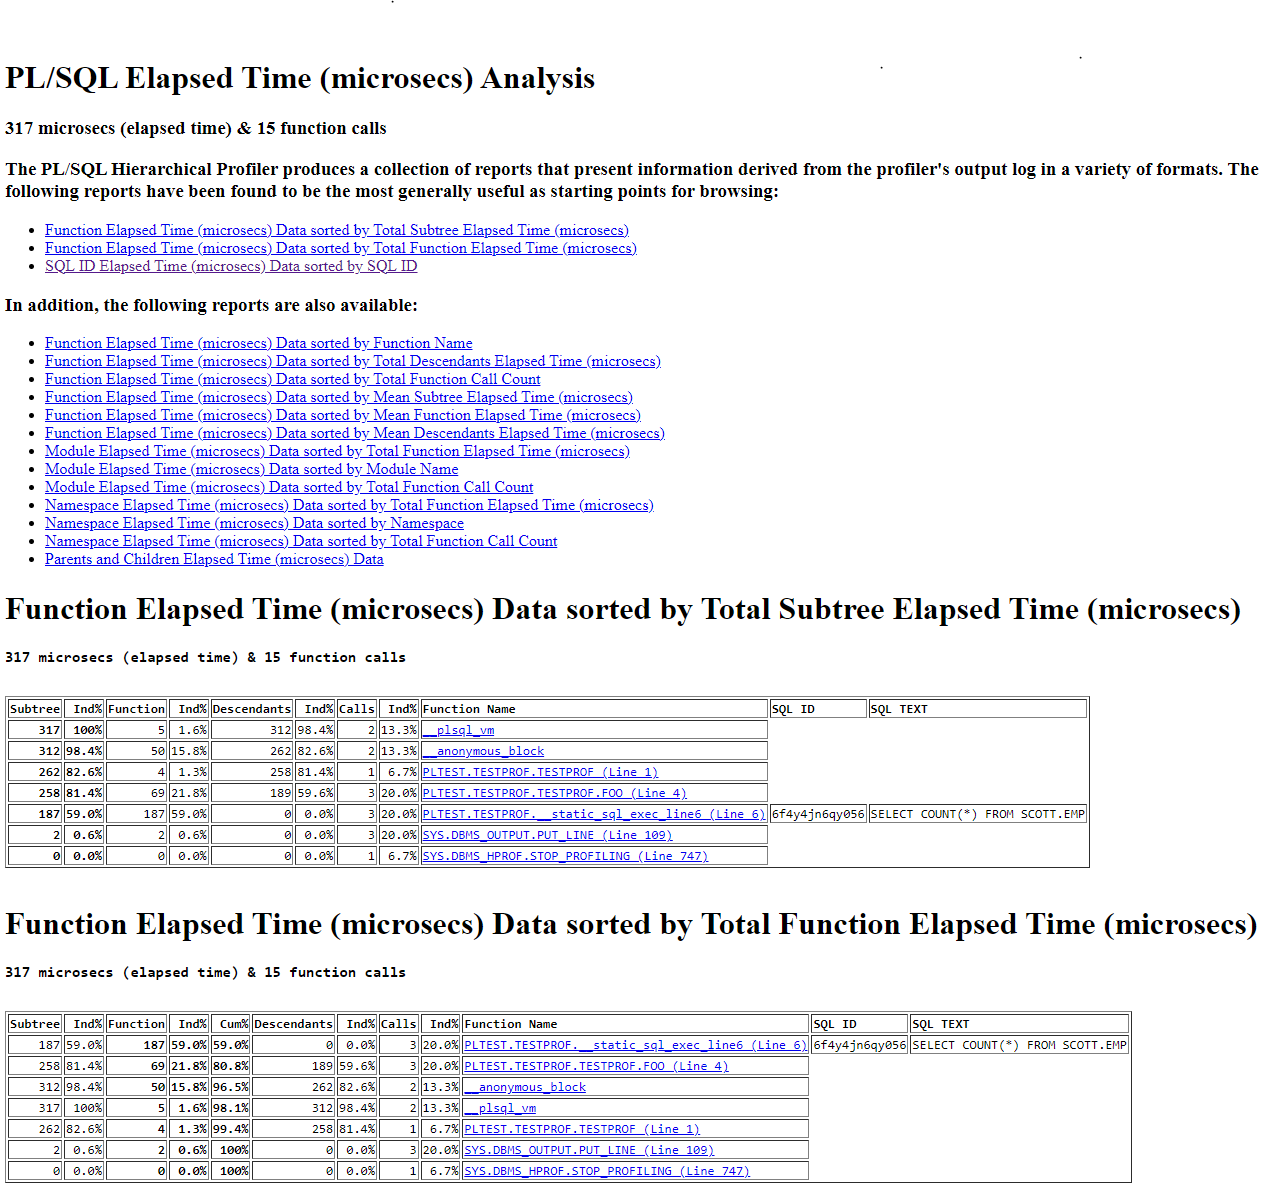
image 1: plshprof report
In total, the execution takes 317 microseconds for 15 function calls. Measured by the absolute function time in the second section, the SQL statement, which is marked with an SQL ID, consumes the most time and is called 3 times by the program FOO. In addition, further reports via the hyperlinks can be used to compare the time consumption of SQL and PL/SQL or of the individual functions with each other, to name just a few examples.
If you like to store the information from the trace file persistently in the database, e.g., in order to process the data further at a later time, an analyze call is necessary.
var runid number
execute :runid:= dbms_hprof.analyze('PLSHPROF_DIR', 'run1.trc');
Now the 4 repository tables are populated and you can start to query the data. The following example provides an overview of the test runs. A total of 2 test runs have been performed.
SQL> select * from DBMSHP_RUNS;

     RUNID RUN_TIMESTAMP                  TOTAL_ELAPSED_TIME
---------- ------------------------------ ------------------
RUN_COMMENT
------------------------------------------------------------
  TRACE_ID
----------
         1 08-NOV-21 05.51.53.529303 PM                  317
1
         2 08-NOV-21 06.18.34.653007 PM                 2716
2
Or query DBMSHP_FUNCTION_INFO in SQL Developer.
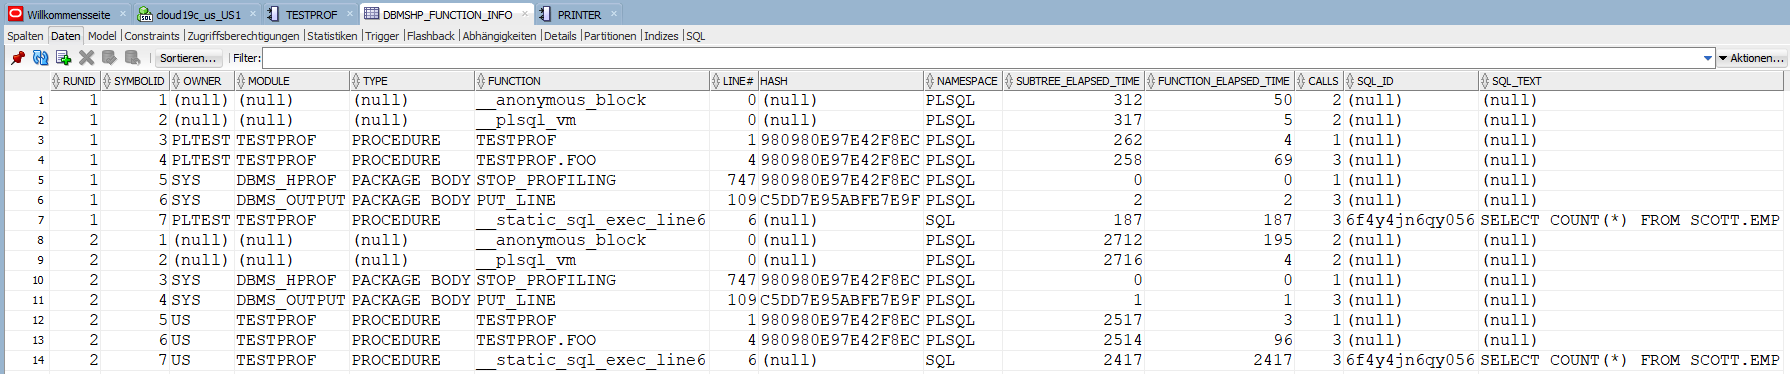 image 2: Query DBMSHP_FUNCTION_INFO in SQL Developer
SQL Developer
The PL/SQL profiler can also be used in SQL Developer worksheet. However there is also the possibility to automate the profiling process. You have to select the corresponding procedure, function or package in the menu and use the “Profiler” button in the worksheet. This automates the profiling and the storage in the repository tables.
As already mentioned it is important to use a logical directory named PLSHPROF_DIR to guarantee error-free operation.
The following blog posting and video show how to use it in SQL Developer:
In our example it looks like this …
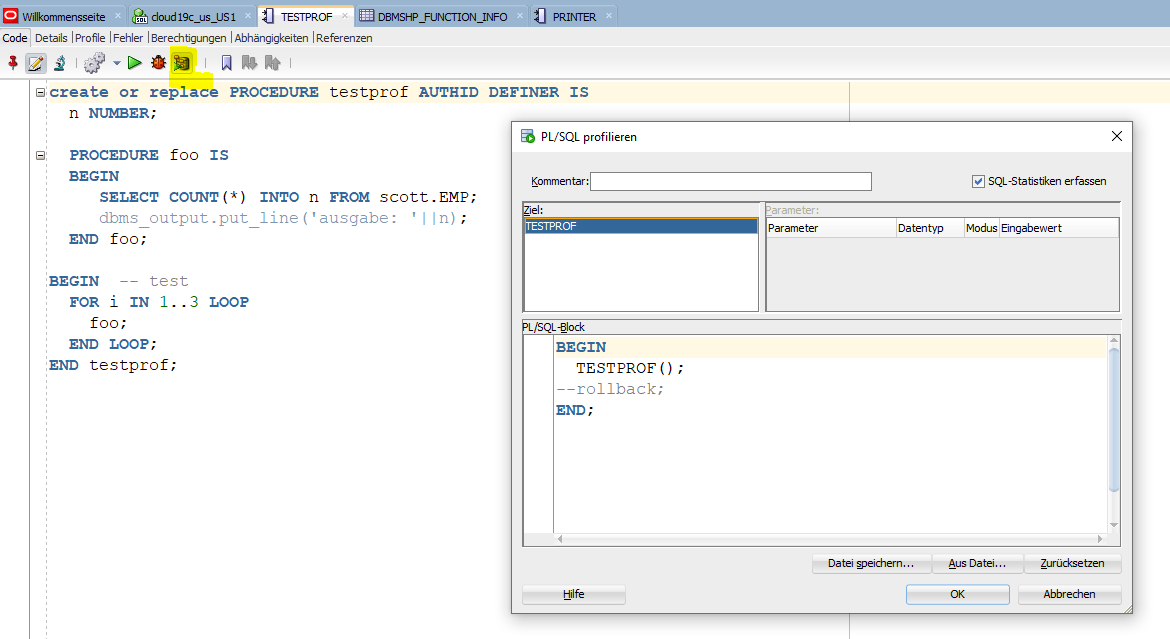 image 3: PL/SQL profiling automation in SQL Developer
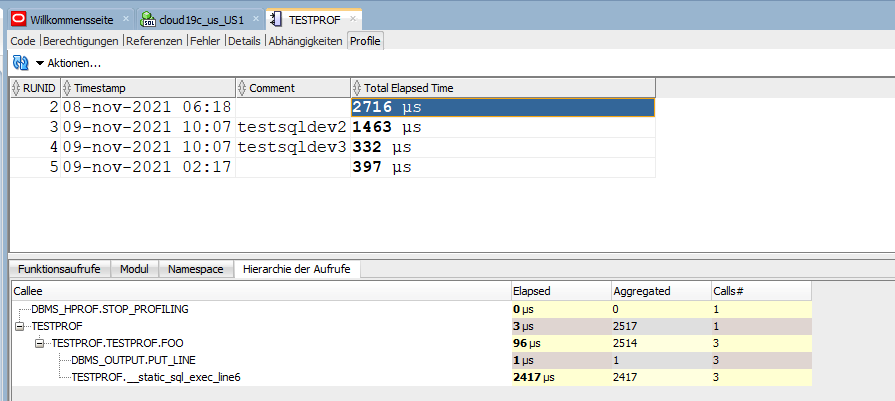
image 4: Results in SQL Developer
No access to a logical directory
What about customers who have only limited privileges to their Oracle environment and who may not have access to a logical directory. The solution is the usage of the package DBMS_PROFILER, which writes the data directly into database tables. The procedure works similar to the described procedure of DBMS_HPROF.
First the corresponding repository tables PLSQL_PROFILER_RUNS, PLSQL_PROFILER_DATA and PLSQL_PROFILER_UNITS are created in the application schema. To do this, use the proftab.sql utility from the $ORACLE_HOME/rdbms/admin directory.
start proftab.sql;
After that the profiler is started, the code is executed and stopped – instead of DBMS_HPROF now with DBMS_PROFILER.
execute dbms_profiler.start_profiler;

execute testprof;

execute dbms_profiler.stop_profiler;
Now the tables are propulated and you can run the appropriate queries, for example a query on PLSQL_PROFILER_RUNS.
SQL> select runid, run_date, run_comment from plsql_profiler_runs;

RUNID      RUN_DATE  RUN_COMMENT
---------- --------- --------------------
2          13-NOV-21 13-NOV-21
1          12-NOV-21 12-NOV-21
If you are looking for similar support for an HTML report as shown in the previous chapters, you can use the profiler.sql script. You can find it in My Oracle Support Note Doc ID 243755.1 or download it here. The script is using a SPOOL command to generate a HTML report.
Note: When using Autonomous Database and a client tool such as SQL Developer for this, you need to adjust the spool command in the script, so that it will be stored in your environment. Thanks to Julian Dontcheff who draw my attention to this.
For example instead of the following code line:
SPO ^^script._^^database_name_short._^^host_name_short._^^rdbms_version._^^time_stamp..html;
use this one here:
SPO C:\<your_directory>\^^script._^^database_name_short._^^host_name_short._^^rdbms_version._^^time_stamp..html;
The following call returns the corresponding HTML report for the run with runid 1.
SQL> start profiler.sql 1

 RUNID RUN_OWNER                 RUN_DATE        RUN_COMMENT
------ ------------------------- --------------- ----------------
     1 PLTEST                    12-NOV-21 10:40 12-NOV-21
...

PROFILER file has been created:
profiler_US1_de_19.0.0.0.0_20211112_145038.html.
Note: In my case, the application user needed the additional privilege to access the data dictionary catalog – specifically the DBA_SOURCE view – in order to work with it without errors.
The result looks like this:
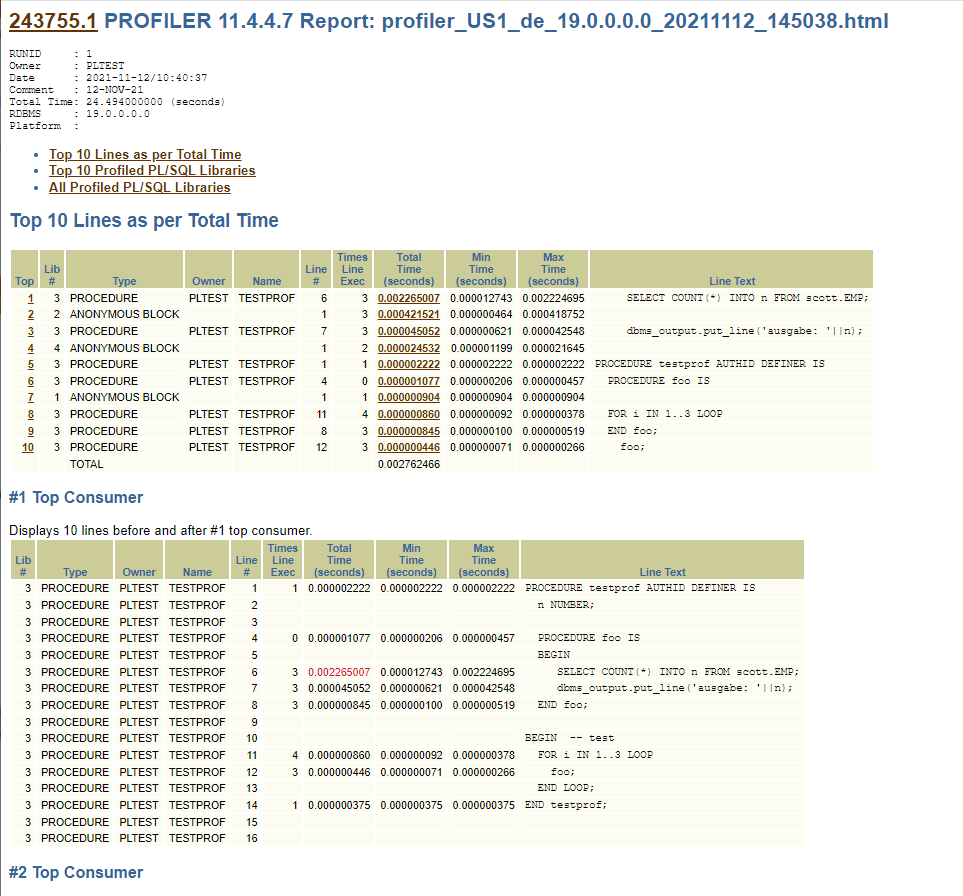
image 5: profiler.sql result