During one of our last proof of concepts we used different reports to assess the overall performance. As you may know, reports like real time monitoring, ASH, ADDM and AWR are available. But do you also know Performance Hub (perfhub)? It delivers a consolidated view of all performance data for a given range of time. It provides summary information not only on overall IO, CPU and Memory usage by the database but also detailed SQL monitoring information. It is available in Oracle Enterprise Manager Cloud Control or in OCI console. To use Performance Hub for databases running on Base Database Service, Exadata Cloud Service, or databases managed with the External Database Service, you need to enable Database Management.
In Autonomous database it’s out of the box available and very useful to assess performance especially in the case of statement performance.
Oracle Enterprise Manager Database Express (aka EM Express) was deprecated in 21c, and is removed in future Oracle Database releases (see Deprecation of Oracle Enterprise Manager Database Express). In 26ai, Oracle Enterprise Manager Database Express (EM Express) is desupported (see Desupported Features in Oracle Database 23ai).
Concerning Licensing, it requires Oracle Diagnostics Pack which is included in Free, BaseDB EE, BaseDB EE-HP, BaseDB EE-EP, ExaDB. For detailed information on this, please refer to Database Licensing Information User Manual.
Did you know that you can generate active HTML Performance Hub reports via the Oracle SQL script perfhubrpt.sql which can be found in the rdbms/admin directory. If you don’t have access to the directory you can also use the PL/SQL package DBMS_PERF.
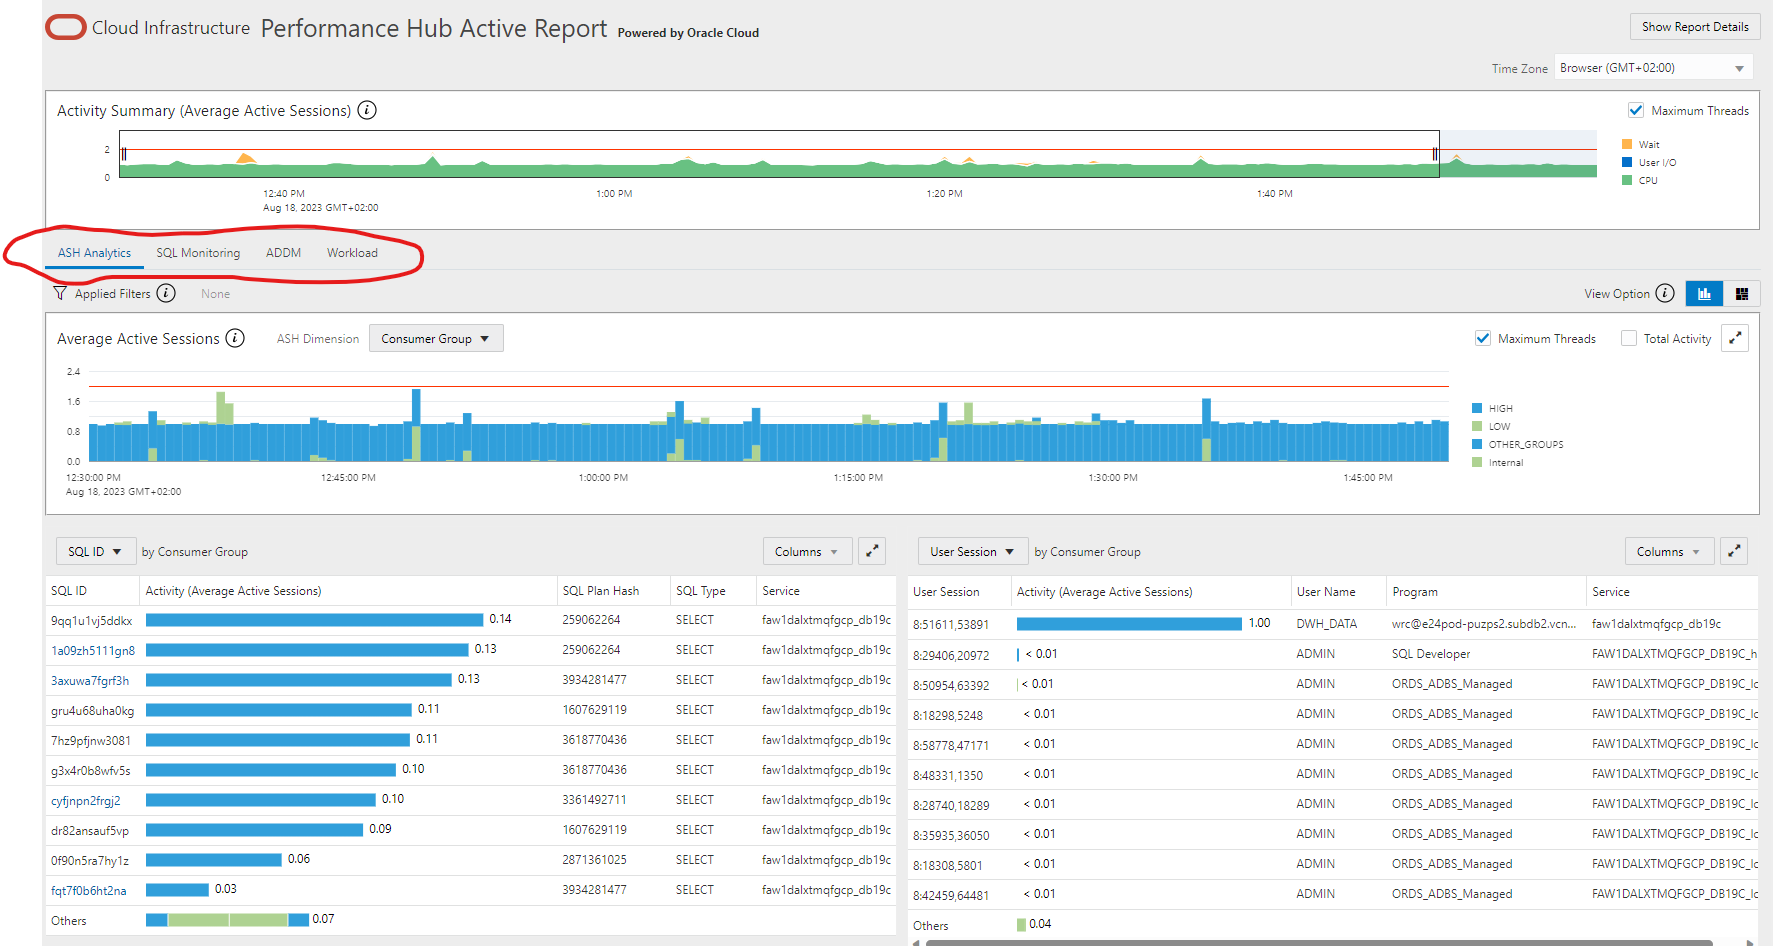
Here is an example how a Performance Hub report may look like. You can find ASH Analytics on the main page and you can also interactively switch to other performance sections (if available) like SQL Monitoring, ADDM and general Workload information. The complete report can be found here.
Now let’s demonstrate how to generate a Performance Hub report. It can be used for different environments – for PDBs, Root containers, and also Non-CDB databases in RAC and single instance environments. In our first example we execute perfhubrpt.sql from $ORACLE_HOME/rdbms/admin in SQL*Plus. Before you start, make sure that you have the necessary privileges: Performance Hub requires the DBA role.
I connected to my pdb US as sysdba and started the perfhubrpt.sql in SQL*Plus as follows:
SQL> @?/rdbms/admin/perfhubrpt.sql
You will be asked for some input values like level of report details (typical or all), available databases and instances and the start and end time. You can keep the defaults or enter different information as in my case: I changed the start and end time.
SQL> start ?/rdbms/admin/perfhubrpt.sql
~~~~~~~~~~~~~~~~~~~~~~~~~~~~~~~~~~~~~~~~~~~~~~~~~~~~~~~~~~~~~~~~~~~~~~~~
~                   PERFHUB ACTIVE REPORT                              ~
~~~~~~~~~~~~~~~~~~~~~~~~~~~~~~~~~~~~~~~~~~~~~~~~~~~~~~~~~~~~~~~~~~~~~~~~

~~~~~~~~~~~~~~~~~~~~~~~~~~~~~~~~~~~~~~~~~~~~~~~~~~~~~~~~~~~~~~~~~~~~~~~~

~  This script will generate PerfHub active report according to        ~
~  users input.  The script will prompt users for the                  ~
~  following information:                                              ~
~     (1) report level: basic, typical or all                          ~
~     (2) dbid                                                         ~
~     (3) instance id                                                  ~
~     (4) selected time range                                          ~
~~~~~~~~~~~~~~~~~~~~~~~~~~~~~~~~~~~~~~~~~~~~~~~~~~~~~~~~~~~~~~~~~~~~~~~
Specify the report level
~~~~~~~~~~~~~~~~~~~~~~~~
*  Please enter basic, typical or all
*  Report level "basic" - include tab contents but no further details
*  Report level "typical" - include tab contents with details for top
*                           SQL statements
*  Report level "all" - include tab contents with details for all SQL
*                       statements
Please enter report level [typical]:
Using typical for report level

Available Databases and Instances.
The database with * is current database
~~~~~~~~~~~~~~~~~~~~~~~~~~~~~~~~~~~~~~~
DB Id        DB Name      AWR Data Source          Type
------------ ------------ ------------------------ ------------------------
* 2754410703 DB19C        US                       PDB
  617063580  CDB19A       USPDB                    IMPORTED, RAC, CDB
  2234328383 DB19C        CDB$ROOT                 CDB

Specify the database ID
~~~~~~~~~~~~~~~~~~~~~~~
Please enter database ID [2234328383]:
Using 2234328383 for database ID

Generating report for selected data source. Please press Enter
Specify the Instance Number
~~~~~~~~~~~~~~~~~~~~~~~~~~~~~~~~~~
Single Instance Database. Please press Enter

Default Start Time  Default End Time    Oldest Available Snapshot Time
------------------- ------------------- ------------------------------
08/21/2023 09:49:43 08/21/2023 09:54:43 08/13/2023 01:00:43

Specify selected time range
~~~~~~~~~~~~~~~~~~~~~~~~~~~
*  If the selected time range is in the past hour, report data will be
*    retrieved from V$ views.
*  If the selected time range is over 1 hour ago, report data
*    will be retrieved from AWR.
*  If the dbid selected is not for the current database, only AWR data
*    is available.
*
*  Valid input formats:
*      To specify absolute time:
*        [mm/dd[/yyyy]] hh24:mi[:ss]
*        Examples: 02/23/14 14:30:15
*                  02/23 14:30:15
*                  14:30:15
*                  14:30
*      To specify relative time: (start with '-' sign)
*        -[hh24:]mi
*        Examples: -1:15  (SYSDATE - 1 Hr 15 Mins)
*                  -25    (SYSDATE - 25 Mins)

Please enter start time [08/21/2023 13:33:31]: 08/18/2023 12:30:00

Please enter end time [08/21/2023 13:38:31]: 08/18/2023 13:50:00


Generating report for 08/18/2023 12:30:00 - 08/18/2023 13:50:00


Specify the Report Name
~~~~~~~~~~~~~~~~~~~~~~~
Please enter report name [perfhub_ht_08181350.html]:
A description and another usage eample can be found in the Oracle Support note .
DBMS_PERF is the interface used by perfhubrpt.sql. The next example demonstrates how to get a perfhub report using the PL/SQL package DBMS_PERF. It consists of 3 functions REPORT_PERFHUB, REPORT_SESSION and REPORT_SQL. Let’s use the function REPORT_PERFHUB to generate an active performance report of the entire database system for a specified time period.
Here are the arguments for DBMS_PERF. Please check out the DBMS_PERF documentation to get a detailed description.
DBMS_PERF.REPORT_PERFHUB (
   is_realtime          IN NUMBER   DEFAULT NULL,
   outer_start_time     IN DATE     DEFAULT NULL,
   outer_end_time       IN DATE     DEFAULT NULL,
   selected_start_time  IN DATE     DEFAULT NULL,
   selected_end_time    IN DATE     DEFAULT NULL,
   inst_id              IN NUMBER   DEFAULT NULL,
   dbid                 IN NUMBER   DEFAULT NULL,
   monitor_list_detail  IN NUMBER   DEFAULT NULL,
   workload_sql_detail  IN NUMBER   DEFAULT NULL,
   addm_task_detail     IN NUMBER   DEFAULT NULL,
   report_reference     IN VARCHAR2 DEFAULT NULL,
   report_level         IN VARCHAR2 DEFAULT NULL,
   type                 IN VARCHAR2 DEFAULT 'ACTIVE',
   base_path            IN VARCHAR2 DEFAULT NULL);
 RETURN CLOB;
Once a time period is selected, the performance information is collected and presented based on performance subject areas. When real-time data is selected, more granular data is presented because data points are available every minute. When historical data is selected, more detailed data (broken down by different metrics) is presented, but the data points are averaged out to the AWR interval (usually an hour). Different tabs are available in the Performance Hub, depending on whether is_real-time is 1 for real time mode or 0 for historical mode.
In our example we generate a historical report (here: is_realtime=0) with the following code.
set pages 0 linesize 32767 trimspool on trim on long 1000000 longchunksize 10000000

spool sql_details_history.html

select dbms_perf.report_perfhub (
is_realtime         => 0,
outer_start_time    => to_date('18-Aug-2023 12:30:00','dd-MON-YYYY hh24:mi:ss'),
outer_end_time      => to_date('18-AUG-2023 13:50:00','dd-MON-YYYY hh24:mi:ss'),
selected_start_time => to_date('18-AUG-2023 12:30:00','dd-MON-YYYY hh24:mi:ss'),
selected_end_time   => to_date('18-AUG-2023 13:50:00','dd-MON-YYYY hh24:mi:ss'))
from dual;

spool off
If you haven’t used it yet, give it a try! It’s worth it.
Further Reading