Siemens Simcenter™ STAR-CCM+™ is a comprehensive multi-physics Computational Fluid Dynamics (CFD) software package providing an integrated solution for solving complex problems involving fluid flow, heat transfer, and stress analysis across a wide range of engineering disciplines and is widely used in the virtual product development and testing area. Historically engineers used bespoke on-premises High Performance Computing (HPC) clusters for demanding software packages such as Simcenter STAR-CCM+ but recently have increasingly relied on leading Cloud Solution Providers, such as Oracle Cloud Infrastructure (OCI) to run their HPC workloads. In this blog we will examine the performance of Simcenter STAR-CCM+ across various OCI CPU and GPU shapes as well as the associated normalized hardware costs of running these simulations
Benchmarks
We carried out our testing with various compute clusters created using the HPC Terraform template available on the Oracle Cloud Marketplace. Table 1 gives an overview of the CPU shapes we tested. For a more comprehensive description, see the OCI documentation.
| Table 1: OCI CPU Shapes Tested | ||||
| Compute Shape | Cores/node | Memory/node | Network | Total Nodes per job |
| BM.Optimized3.36 | 36 | 512GB | ROCE | 1-32 |
| BM.HPC.E5.144 | 144 | 768GB | ROCE | 1-8 |
| BM.Standard.E5.192 | 192 | 2304GB | TCP | 1 |
| BM.Standard.E6.256 | 256 | 3078GB | TCP | 1 |
| VM.Standard.E6.Flex | 96 | 256GB | TCP | 1-4 |
The CPU based systems were configured with Oracle Linux 8.10, using both bare metal (BM) and virtual machine (VM) shapes. The first two shapes listed, BM.Optimized3.36 and the BM.HPC.E5.144, were networked with an ultra-low latency 100-Gbps RDMA over converged Ethernet (RoCE) v2 network. The BM.Standard.E5.192 was based on the same AMD EPYC 9J14 processor as the BM.HPE.E5.144, and was networked with TCP based Ethernet with a maximum performance of 100Gbps. The BM.Standard.E6.256 and the VM.Standard.E6.Flex shapes were based on the AMD EPYC 9J45 processor and both networked with TCP based Ethernet with a maximum performance of 200Gbps for the BM.Standard.E6.256 and 96 Gbps for the VM.Standard.E6.Flex as configured. While the network latency for the shapes equipped with the RoCE networking is uniform in the 1.6-2.0 msec range, the network latency for the TCP-networked nodes can vary based on the shape location within the cloud region and results obtained for these systems should be considered as more advisory. For our benchmarks, we placed the compute shapes in the same availability-domain and fault-domain to minimize performance scatter and observed an inter-node latency of typically 20-80 msec.
A brief description of the GPU based shapes tested is given here in Table 2.
| Table 2: OCI GPU Shapes Tested | ||||
| Compute Shape | GPUs/node | GPU Mem/GPU | Network | Cluster size |
| BM.GPU4.8 | Eight NVIDIA A100 GPUs | 40 GB | ROCE | 1-2 |
| BM.GPU.H100.8 | Eight NVIDIA H100 GPUs | 80 GB | ROCE | 1 |
| BM.GPU.B200.8 | Eight NVIDIA H200 GPUs | 181GB | ROCE | 1-2 |
We carried out benchmarks on the GPU shapes with Oracle Linux 8.10 and the NVIDIA CUDA Toolkit 12.8. While we focused on single node testing for the GPUs, we included limited parallel results (across up to 2 servers) for the BM.GPU4.8 shape configured with an 8×200 Gbps RoCEv2 network and the BM.GPU.B200.8 shape configured with a 8×400 Gbps RoCEv2 network.
Testing was carried out on dedicated systems using Simcenter STAR-CCM+ 2510 mixed-precision (20.06.010) and double-precision (20.06.007-R8). All datasets used in testing: (HlMach10AoA10Sou_AutoCFL_2000Iter_6M, lemans_poly_17m.amg, AeroSUV_Steady_Coupled_57M_V17_04_005, LeMans_100M_Segregated_8.06.007.np_6144, DrivAer_ED_CCA_WMLES_2p5em4_128M, vtmBenchmark_178M_V15_06_008_v2) were obtained from Siemens and cover a range of representative applications. For performance characterization, we ran the benchmarks using the command-line ( -benchmark “-preits 40 -nits 20 -preclear” ) recording the solver time from the “<AverageOfAverageElapsedTimes” entry in the .xml output. Here we assume that the smaller the value of the average solver time, the better the overall performance.
All testing was carried out on dedicated systems. For the CPU based shapes, we allocated one MPI domain to each physical core on the system with the exception of the BM.Standard.E6.256, where we allocated 224 MPI domains. Our testing indicated that better overall performance was obtained with 224 domains instead of 256. For the GPU shapes, we used all of the system’s GPUs, assigning one MPI domain per GPU.
Analysis
Chart 1 shows the single node results we obtained using the mixed-precision solver for the various compute shapes and datasets, where the performance was scaled to 1.0 based on the results of the reference BM.Optimized3.36 shape. Because of the wide variation in overall performance, we used a log scale on the vertical axis.
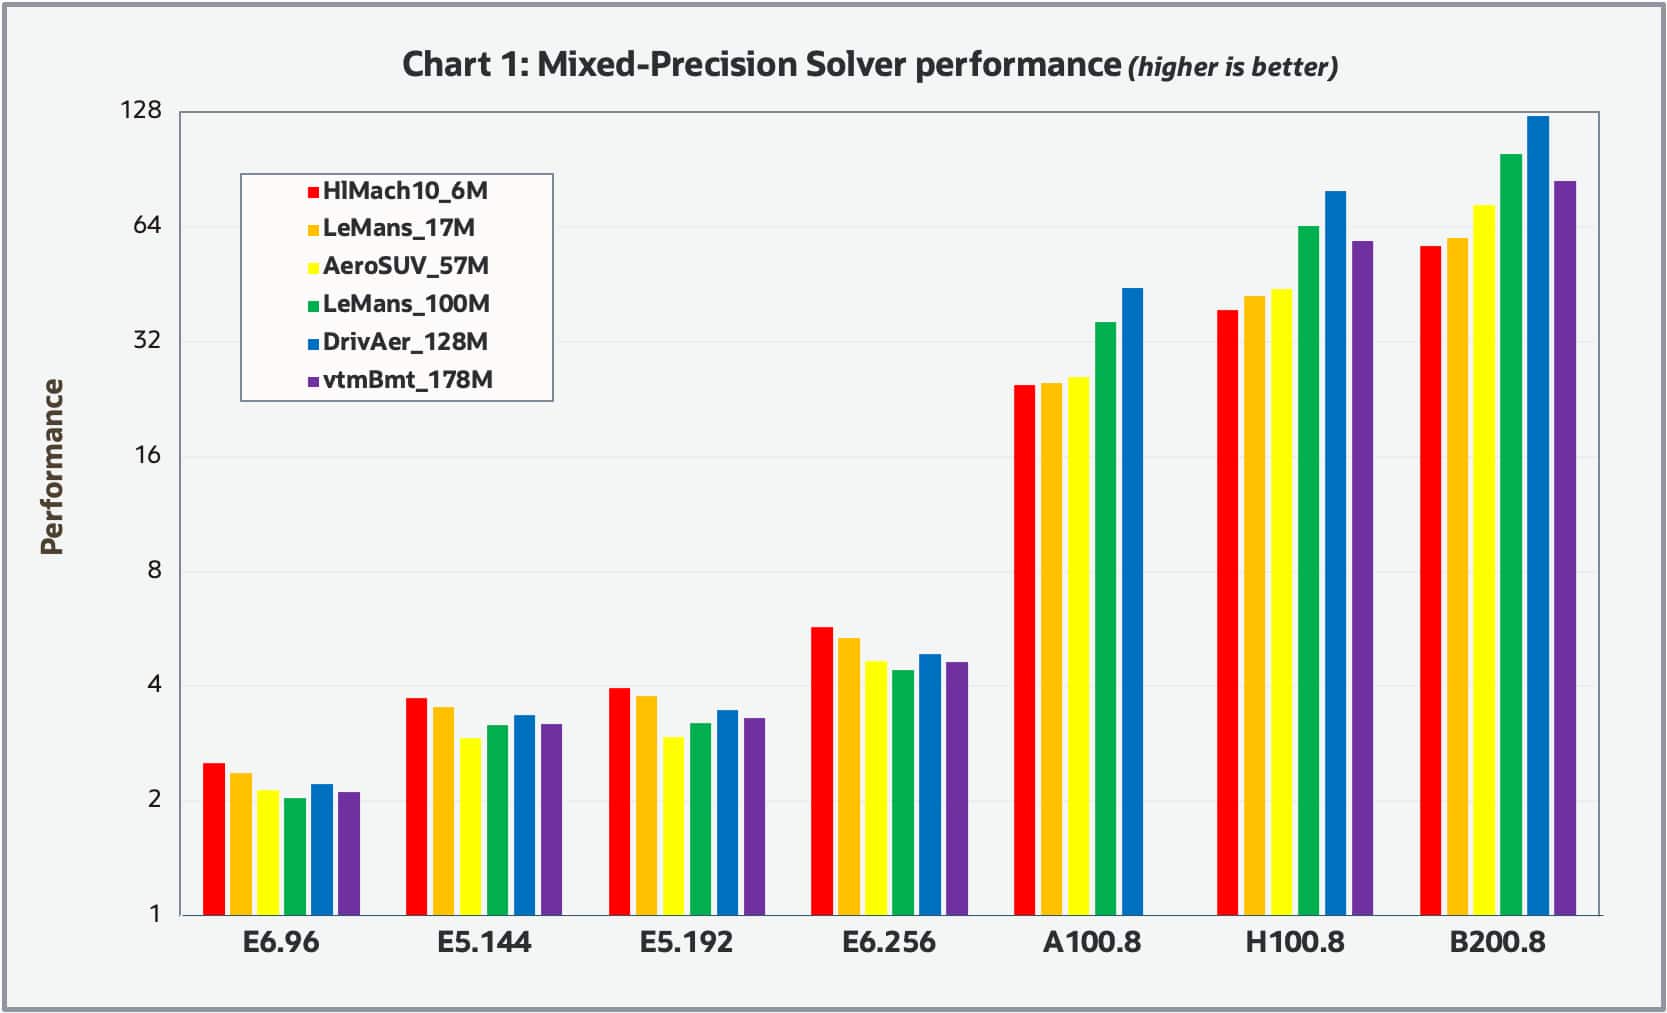
Chart 2 shows the results for the double-precision solver.
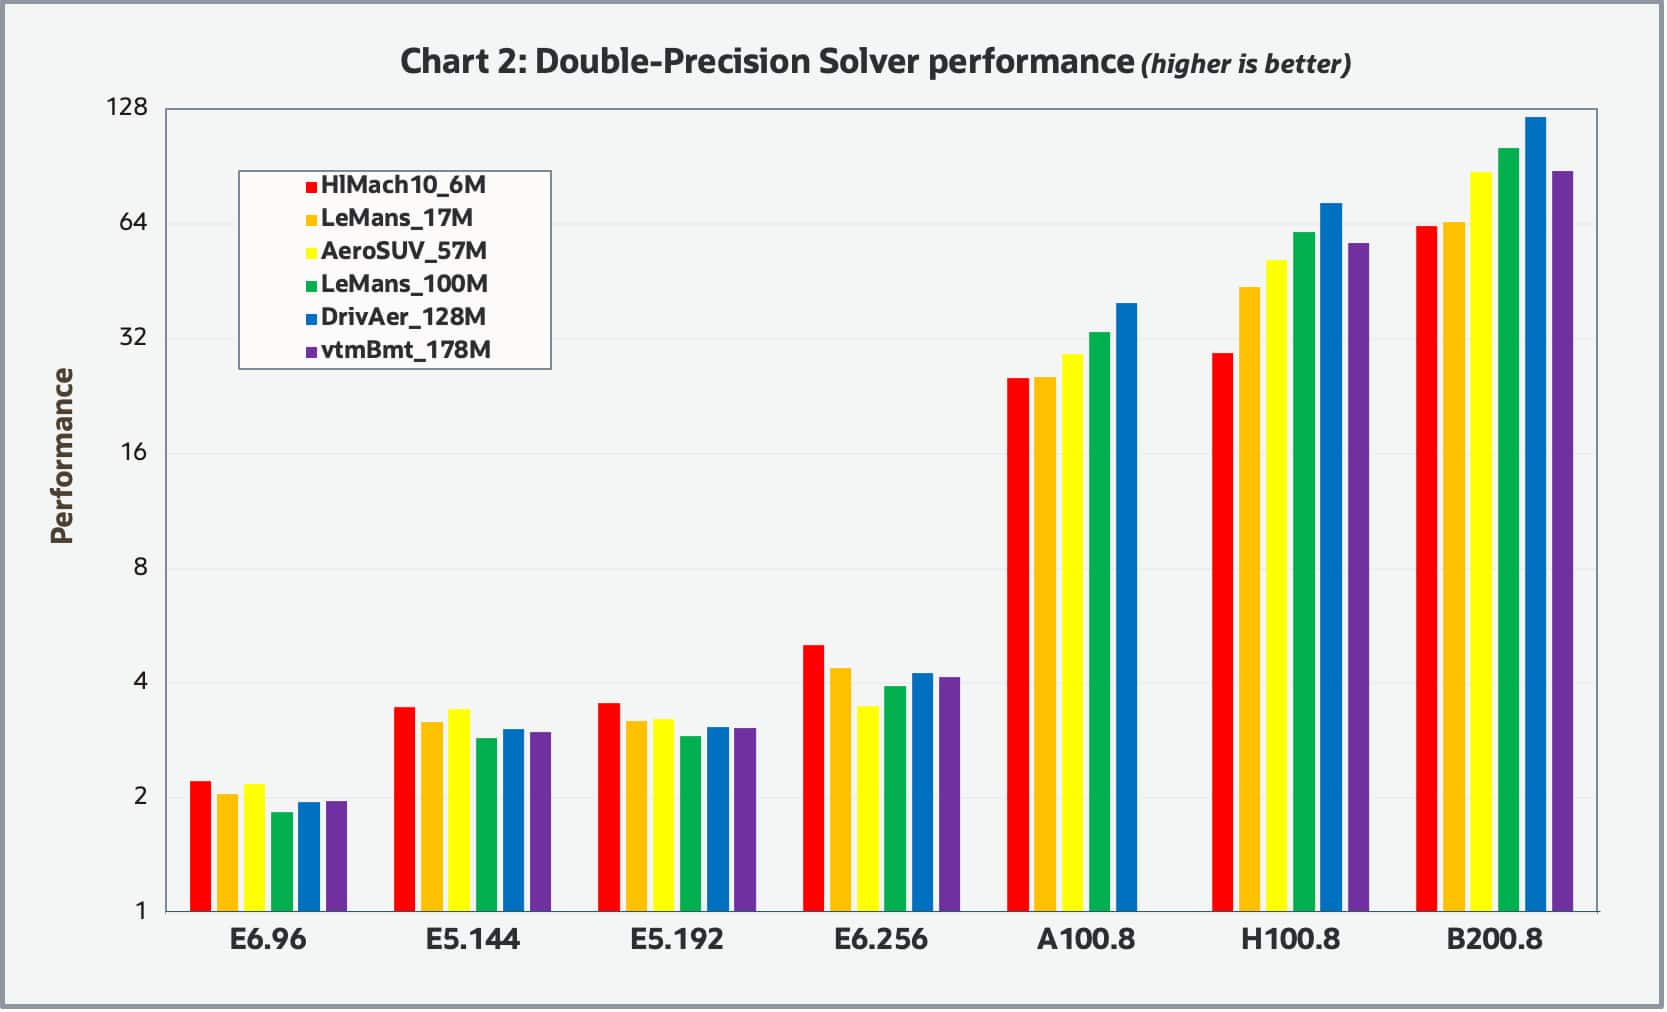
Both charts look similar, indicating the relative performance appears invariant to the solver precision. Overall, the relative performance between the various shapes tends to be invariant to the model size with the exception that the GPU based shapes tended to have greater relative performance for the larger datasets which is to be expected. It should be noted that we were unable to complete the benchmarks for the vmtBenchmark_178M case with the BM.GPU4.8 shape due to the insufficient amount of GPU memory (40GB). Overall, the GPU based shapes significantly outperformed the CPU base shapes. For the GPU shapes, the H100 based shape was about 2X faster than the A100 based shape and the B200 based shape was about 1.5X faster than the H100.
Chart 3 shows the multi-node parallel speedup obtained for various CPU shapes including the BM.Optimized3.36 (1-32nodes), BM.HPC.E5.144 (1-8nodes) and the VM.Standard.E6.Flex shape (1-4nodes), where the E6 flex shape was configured with 96 cores and 256GB of memory.
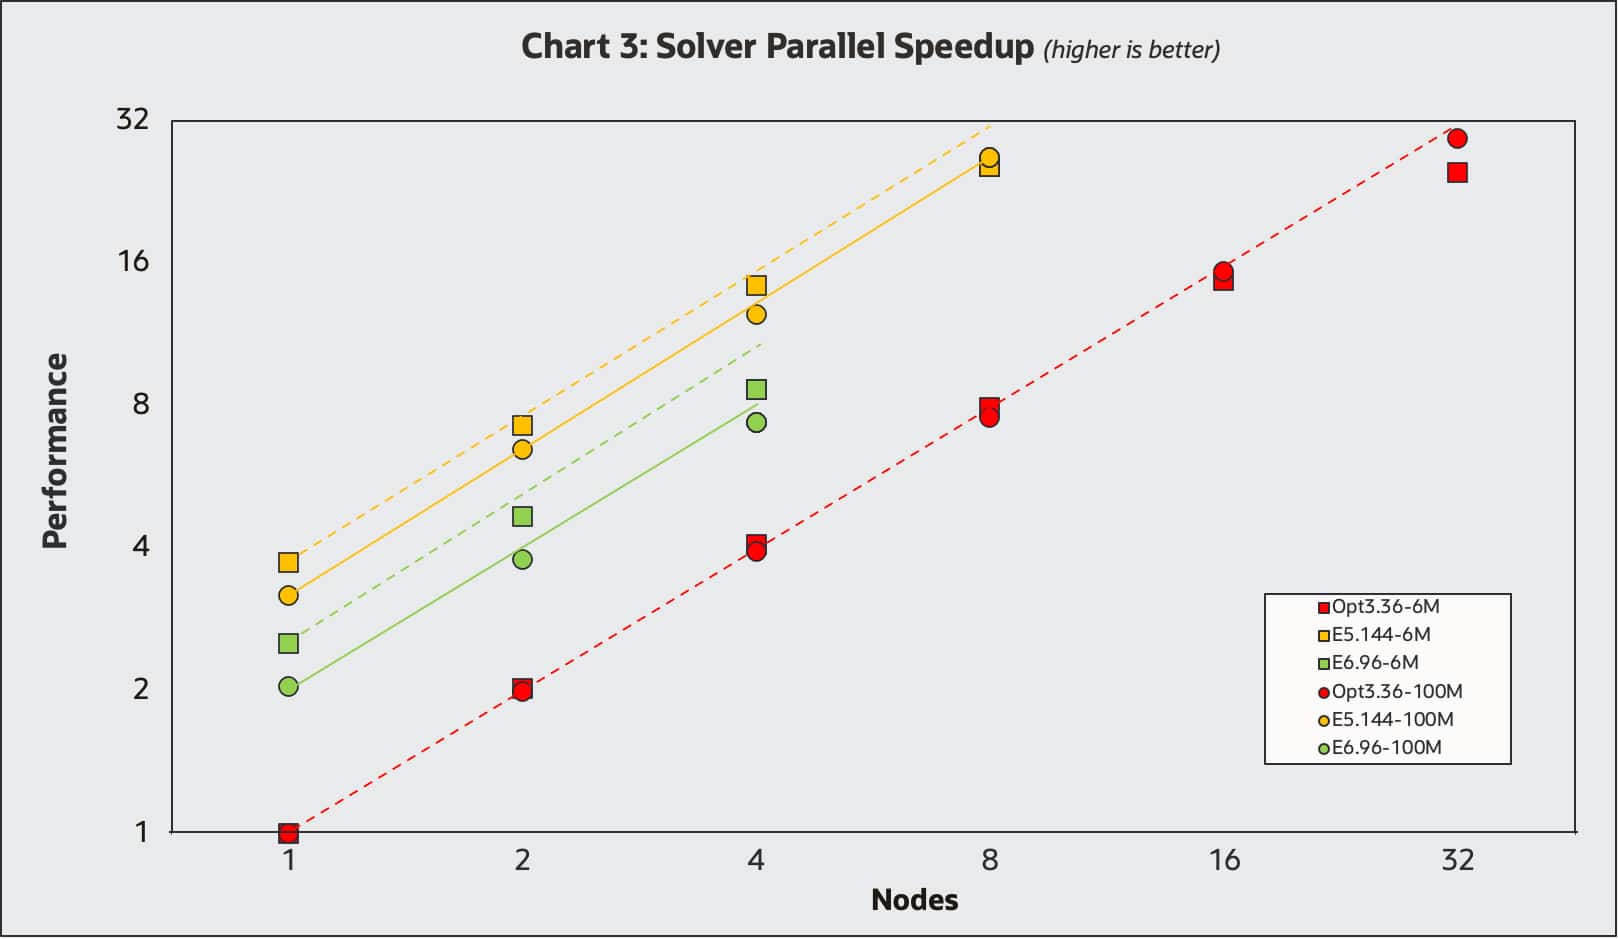
Benchmarks were carried out with the mixed-precision solver on both the HlMach10AoA10Sou_AutoCFL_2000Iter_6M and LeMans_100M_Segregated_8.06.007.np_6144 datasets represented with squares and circles respectively. The single-node BM.Optimized3.36 was used as the performance reference of 1.0. The single node results line up with the results in Charts 1 and 2, where the VM.Standard.E6flex with 96 cores is about twice as performant and the BM.Optimized3.36 and the BM.HPC.E5.144 is about 3.5X more performant. Ideal parallel speedup lines are shown for each of the datasets. All results display excellent parallel speedup, with the results for the larger LeMans model (circles) slightly better as expected.
Engineers often face the challenge of balancing simulation performance with cost, assuming that quicker results come with a price premium. The full cost per job of an analysis includes both hardware and application software cost. From a human perspective the cost of waiting for an analysis to complete may be significant, whereas for extensive studies like Design Of Experiment (DOE) the cost per job may substantially outweigh the time required. Although there is often a correlation between the application software cost and job runtime and resources required, this is beyond the scope of this blog. However, faster job completion can often help reduce software costs, making performance optimization a win-win. In Chart 4, we examine the price-performance map of running the LeMans_100M case with double-precision typical of many customers medium sized production jobs for various hardware configurations.
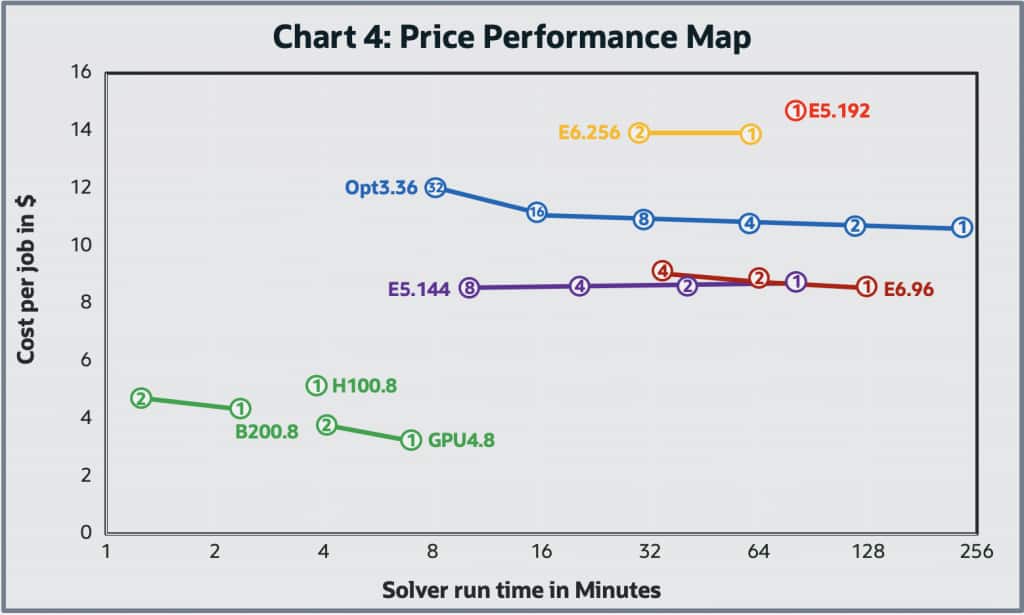
Here, the map represents both the job cost and the wall time to carry out the job, where the wall time is on the horizontal axis and the hardware cost for the job is on the vertical axis. Because of the wide variation of the wall time for the job, the horizontal axis is a log scale. The cost per job was based on the OCI web site. In price-performance maps, the ideal direction is down and to the left – meaning lower cost and faster performance. However, in certain cases, moving upward (i.e., higher cost per job) can still be justified if the gain in speed (moving left) delivers enough business or engineering value to warrant the investment.
For parallel multi-node cluster results, lines are used to connect the runs among the various multiple nodes (with the node number listed) of the clusters with the same shape. Ideally jobs running in parallel on a cluster of nodes should demonstrate a horizontal line moving to the left. As you double the number of nodes used in parallel to complete a job, the wall time for the job should cut in half, leaving the total job cost the same. In practice, parallel speedup is not perfect and tends to get worse as the number of nodes used per job increases (Amdahl’s Law, etc.), leading to the ski-jump curves observed above. We conducted limited multi-node GPU cluster testing with this test case, as its modest size means parallel speedup on powerful compute nodes would naturally be limited. However, the systems we tested still showed notable performance gains. The results of the GPU-based systems are encouraging and demonstrate strong potential to overcome traditional CPU limitations.
Most noticeable on the map is that the GPU based shapes offer considerably better price and performance over the CPU based shapes tested. This is not surprising as we have seen this effect with several different applications we have tested and is indicative on the HPC space’s rapid adoption of GPUs for computationally intensive workloads. However, the implementation of GPU acceleration is a continuous activity to ensure all solvers are GPU enabled. For these not-yet-GPU-accelerated workflows, CPU systems are still required.
Conclusion
Our study presents a strong case for exploring the migration of CPU-based Simcenter STAR-CCM+ workloads to GPUs. Transitions like this are often most effective when done gradually, making cloud environments ideal – where flexible access to both high-performance CPU and GPU systems is far more practical than in a traditional on-premises setups. We encourage Siemens users to test their Simcenter STAR-CCM+ workloads at Oracle Cloud Infrastructure with a 30-day free trial.
For more information, see the following resources: