Oracle Cloud Infrastructure (OCI) offers different GPU shapes for different types of workloads. Choosing the right shapes for the right workloads saves direct infrastructure-related costs and the indirect labor productivity and time-to-market costs in 3D modeling and rendering. Performing standard benchmark tests are a great way to understand the performance differences between GPUs and server configurations. Before we look into benchmark comparison of GPUs, review the quick start guide to set up GPU workstations in Oracle Cloud.
One of the popular benchmarking tools for rendering using GPU is OctaneBench. It allows you to benchmark your GPU using OctaneRender. It tests the same version, the same scenes, and settings across the GPUs to ensure a fair comparison. You can find publicly published results of various GPUs on OctaneBench’s site.
Benchmarking OCI with OctaneBench
We compare the following OCI GPU shapes rendering different 3D models as part of OctaneBench benchmarking:
-
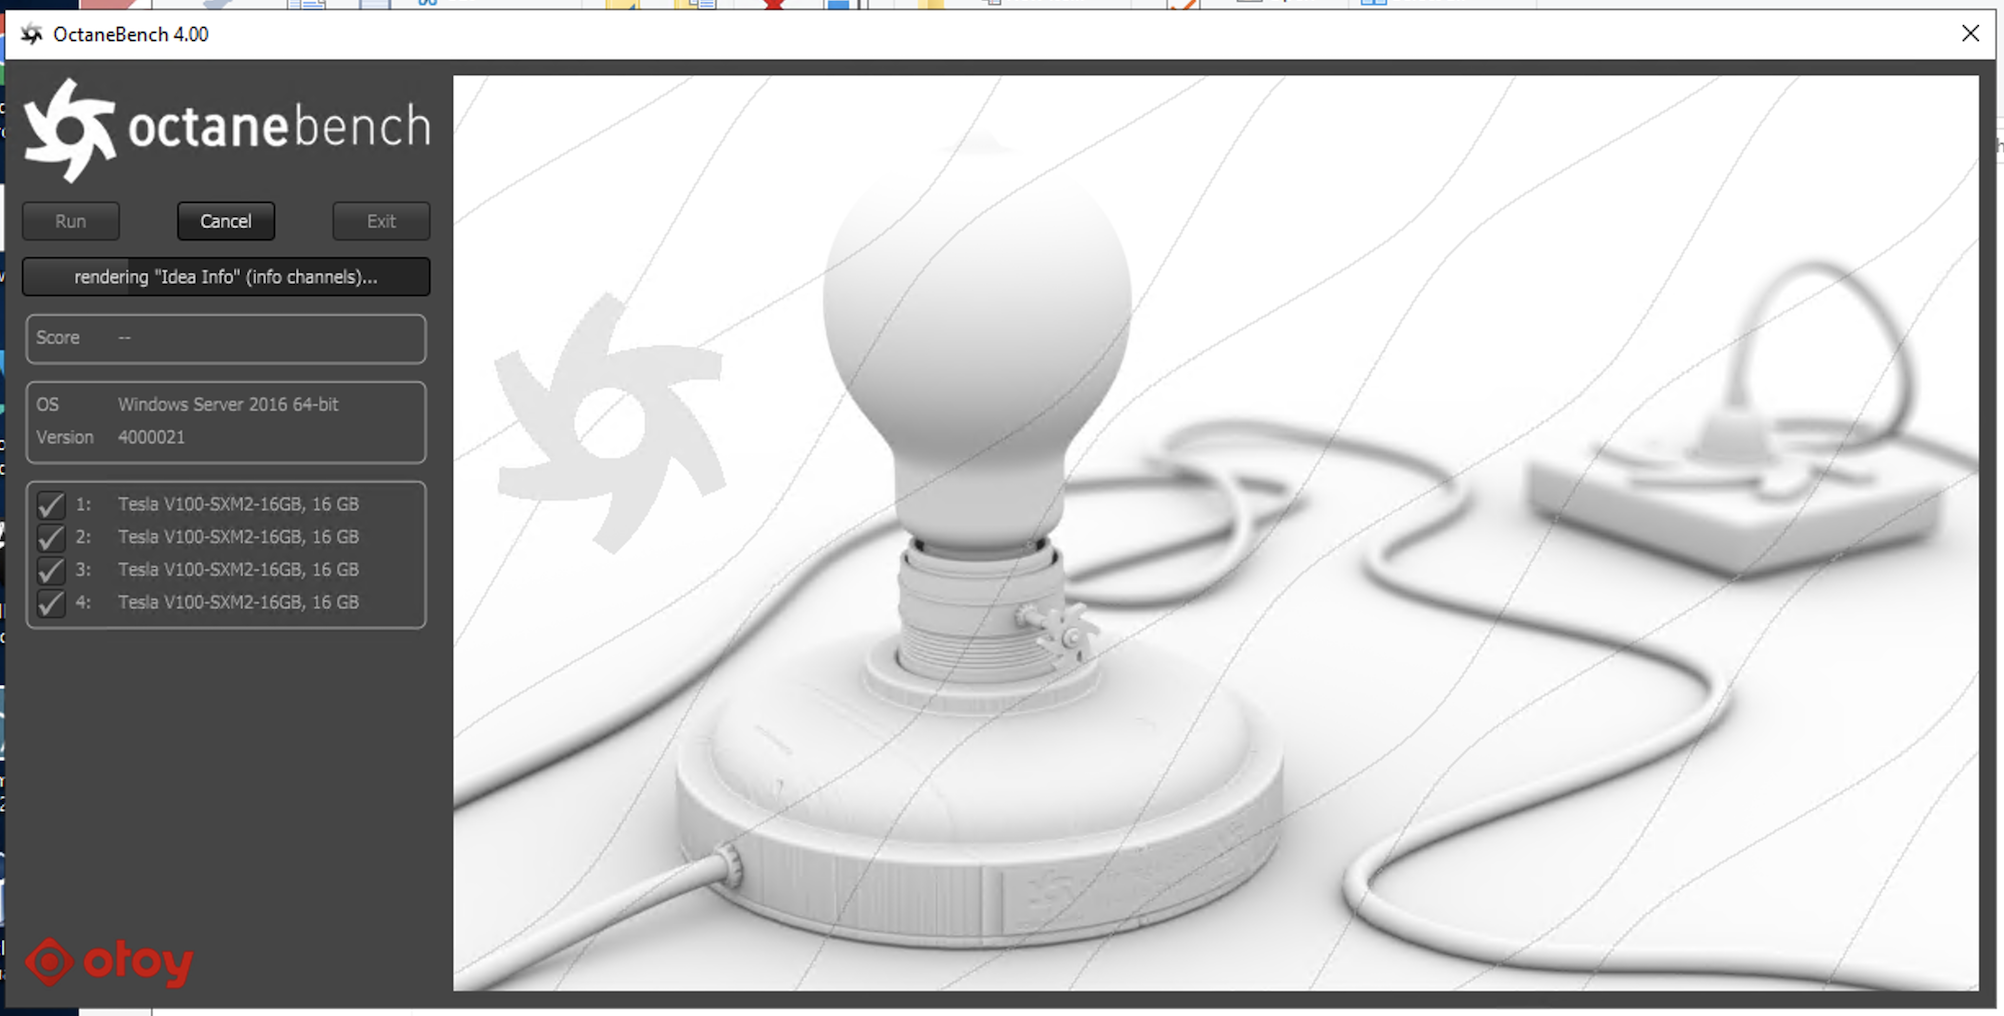
A VM shape with four of V100 GPUs running Windows 2016 Server running OctaneBench Version 4.0
-
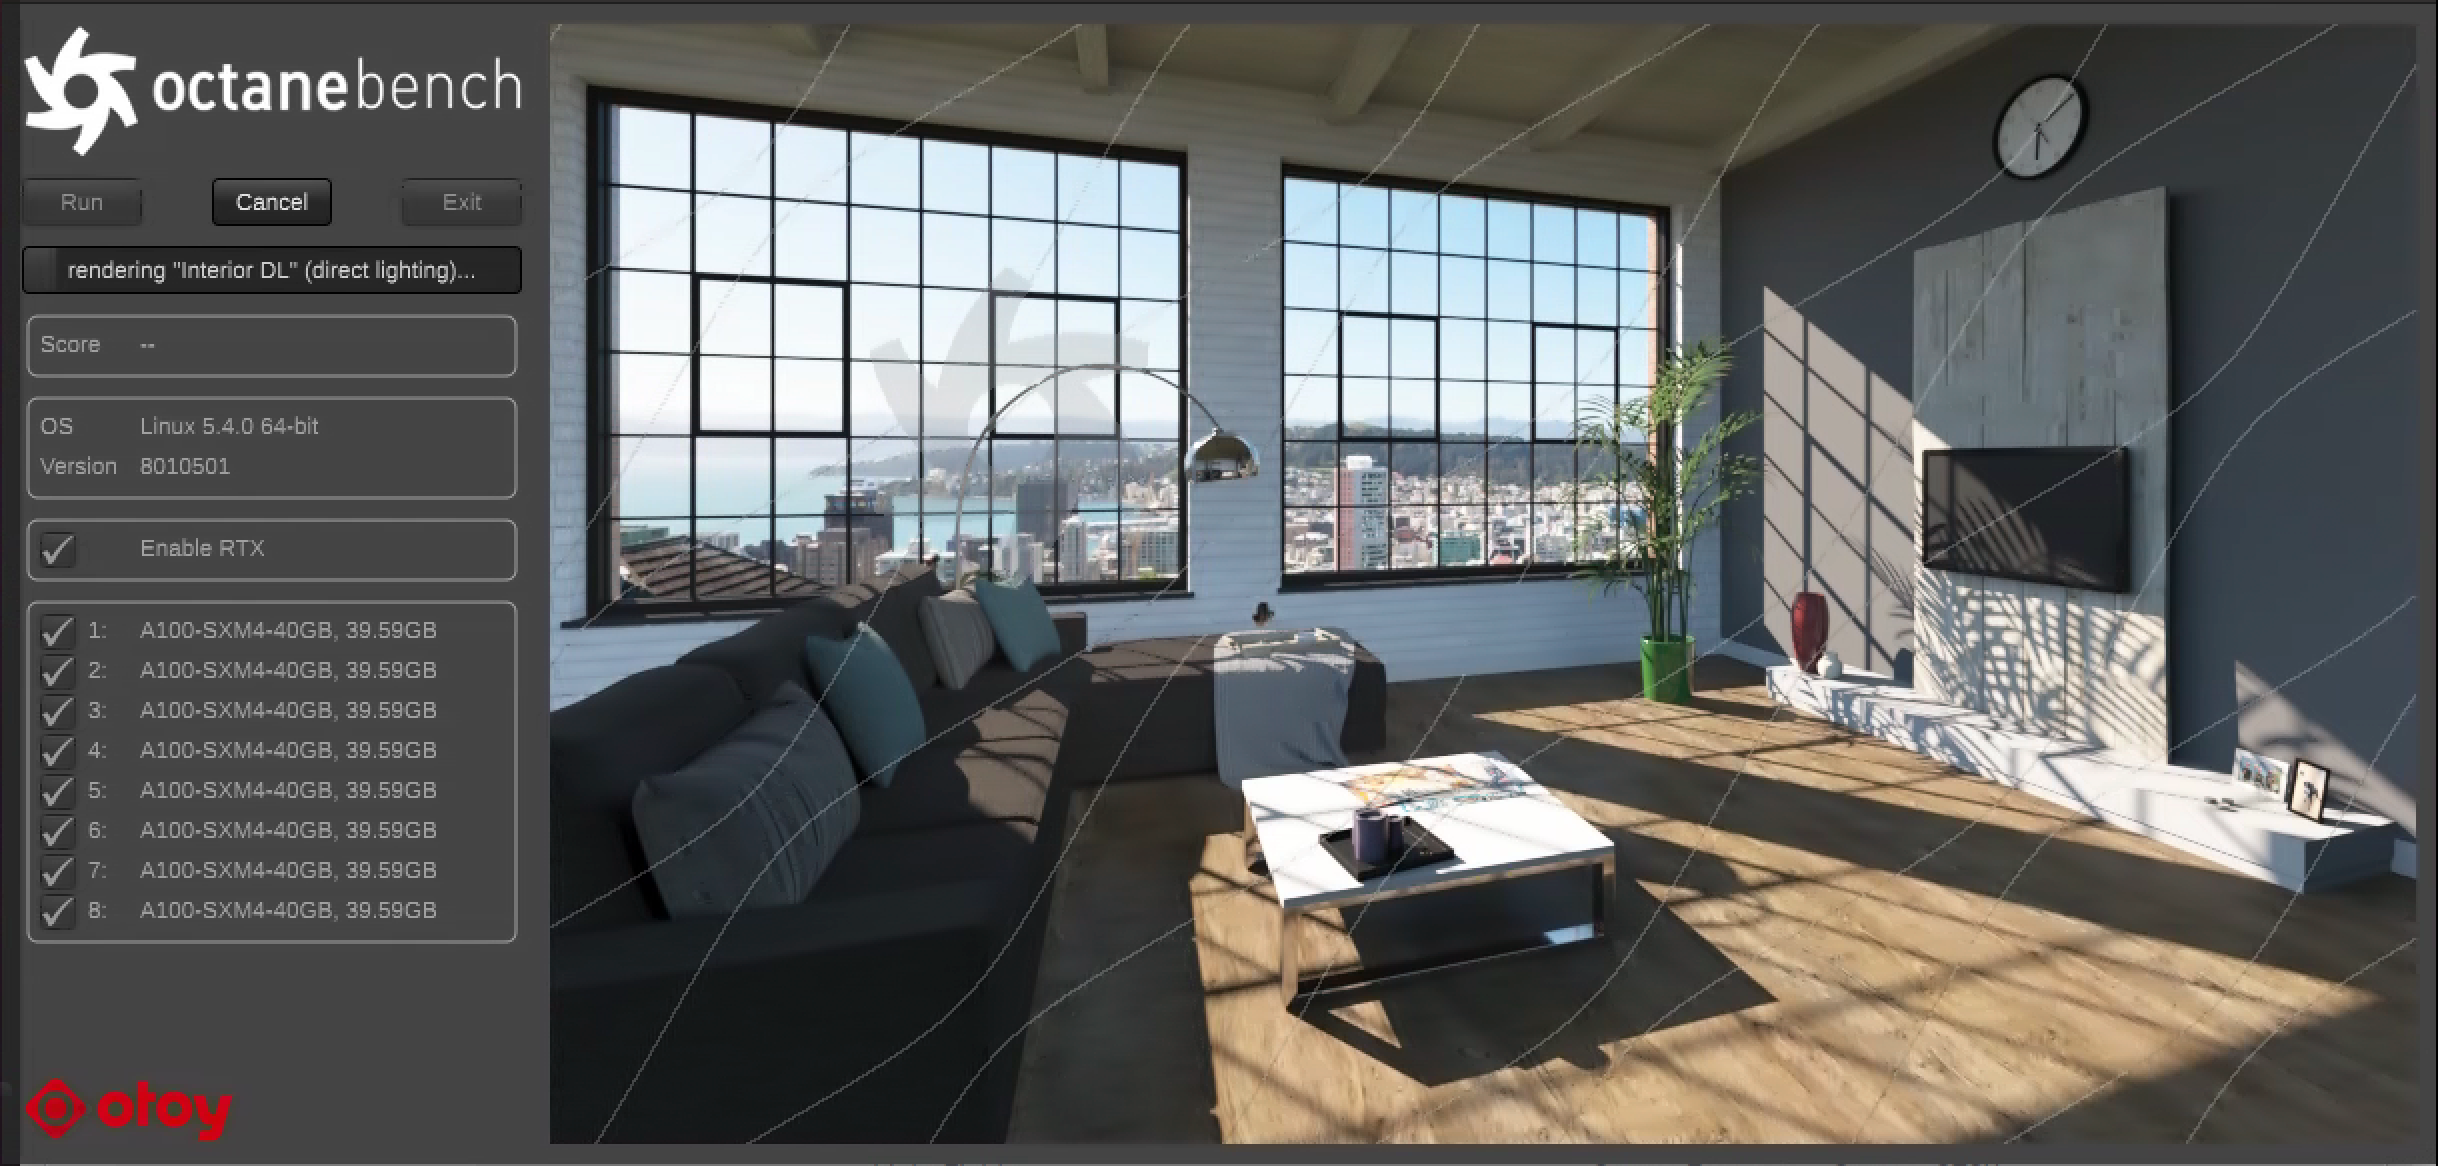
A bare metal shape with eight of A100 GPUs running Ubuntu 20 LTS running OctaneBench Version 2020.1.5
We use four different models in this OctaneBench Benchmark in both GPU types. The following graphics show some sample models and their rendered versions:
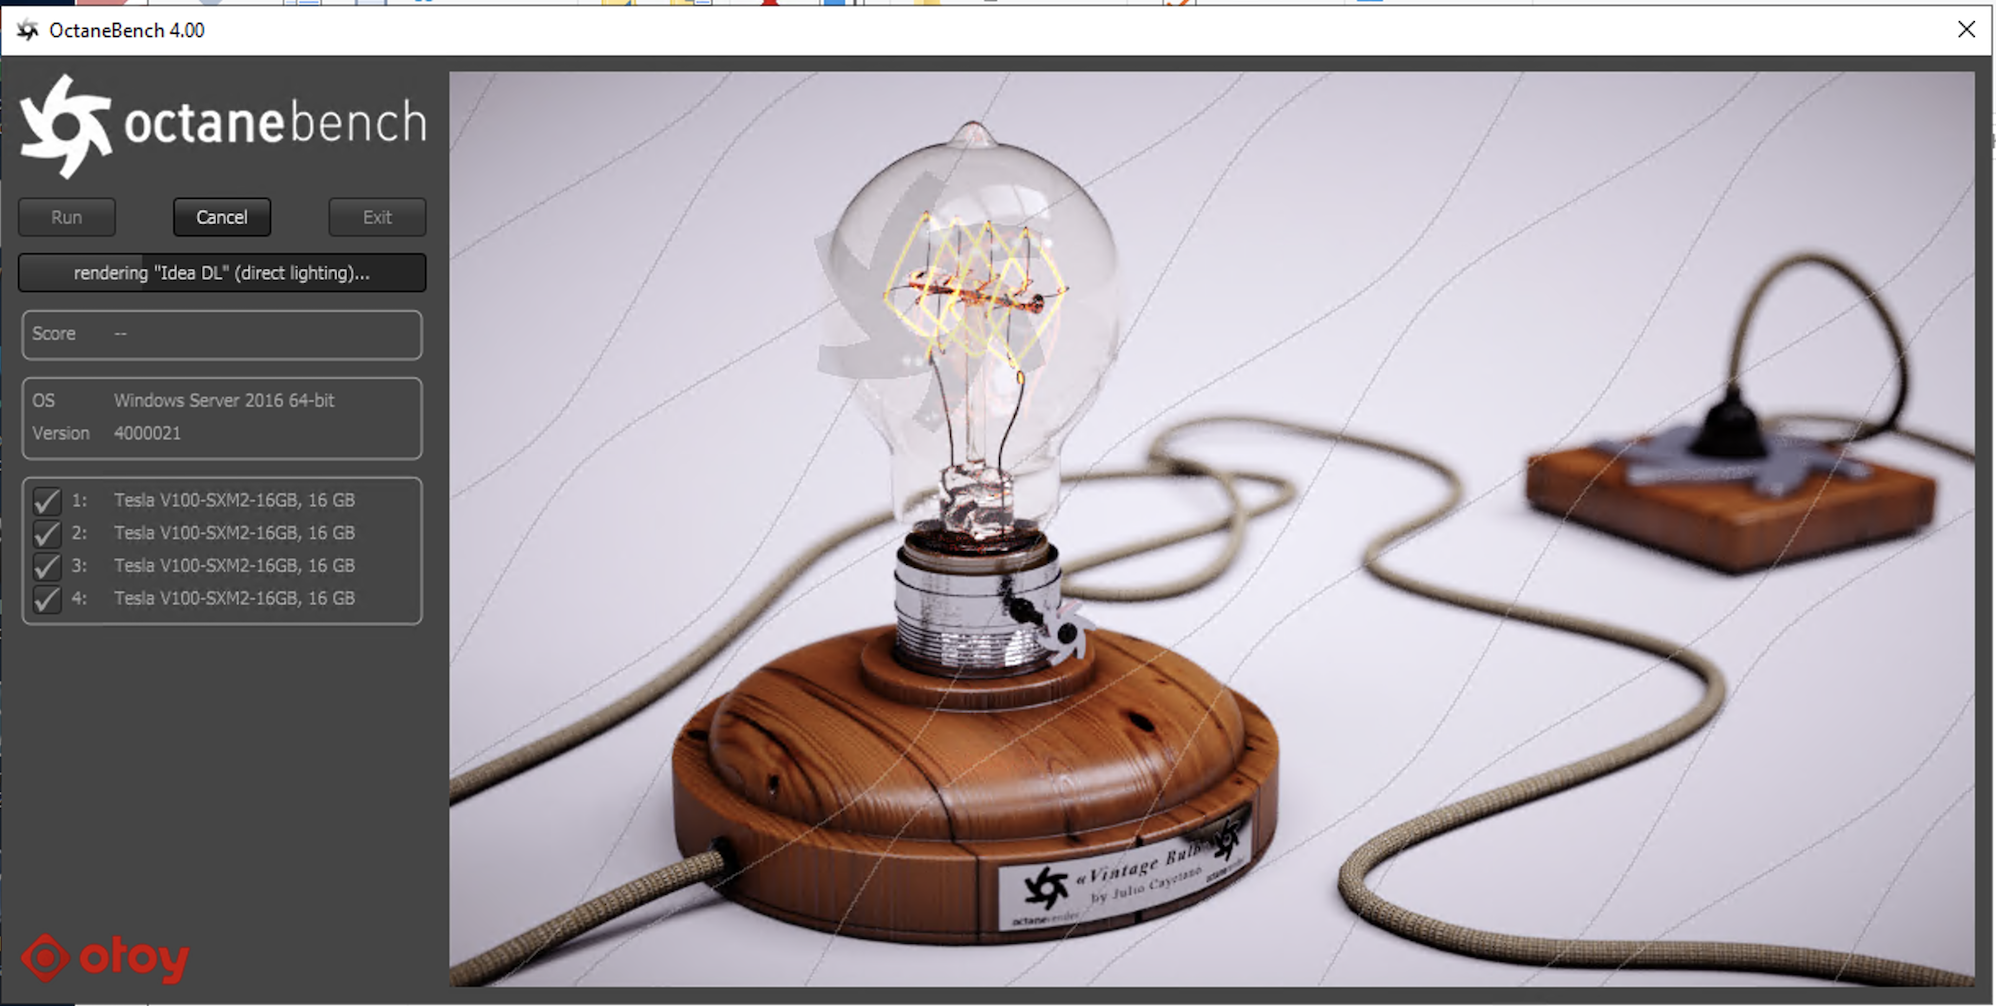
Some models involve complex lighting and composition, including the following example:
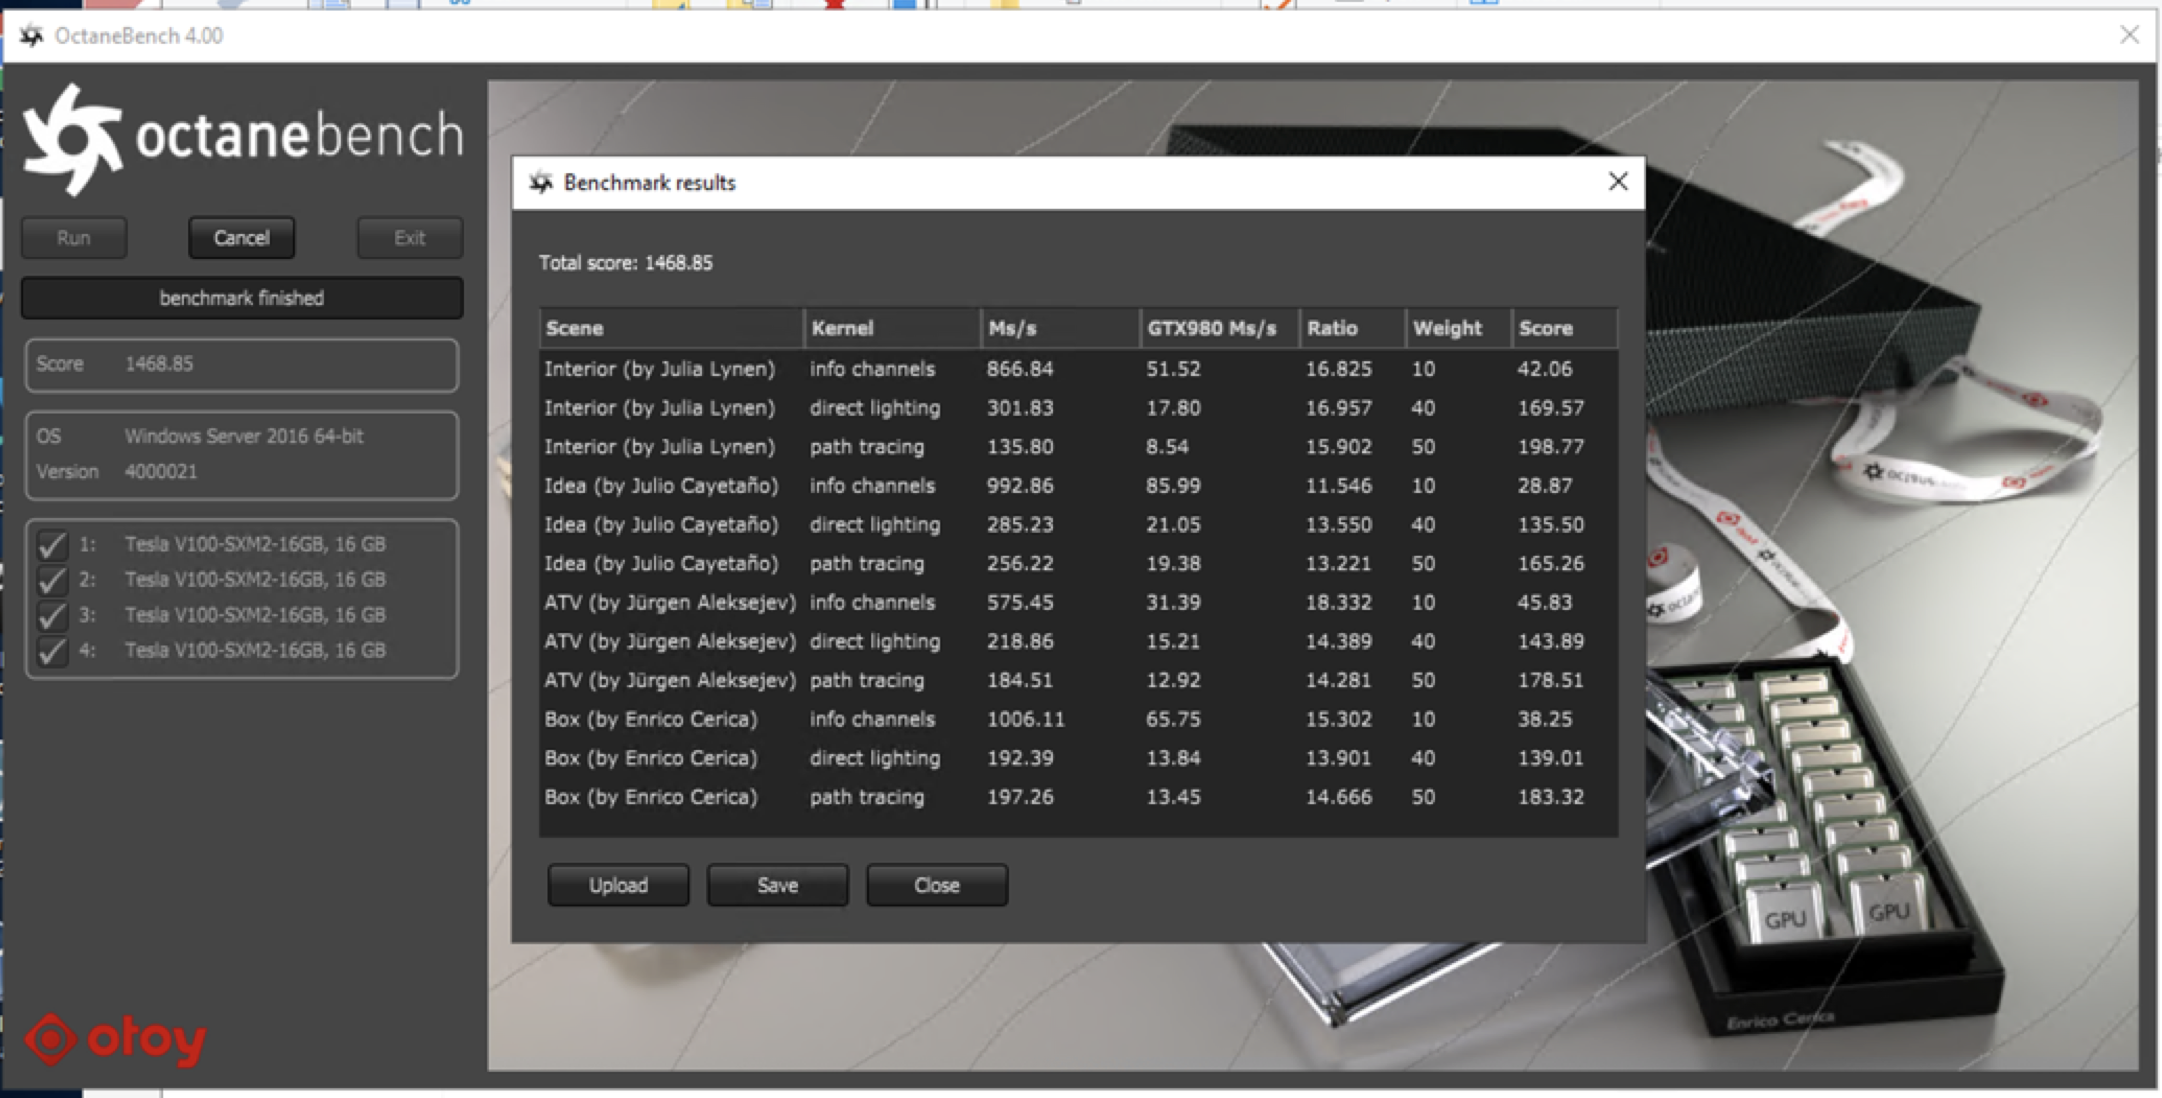
OctaneBench produced the following results on the V100 GPU shape:
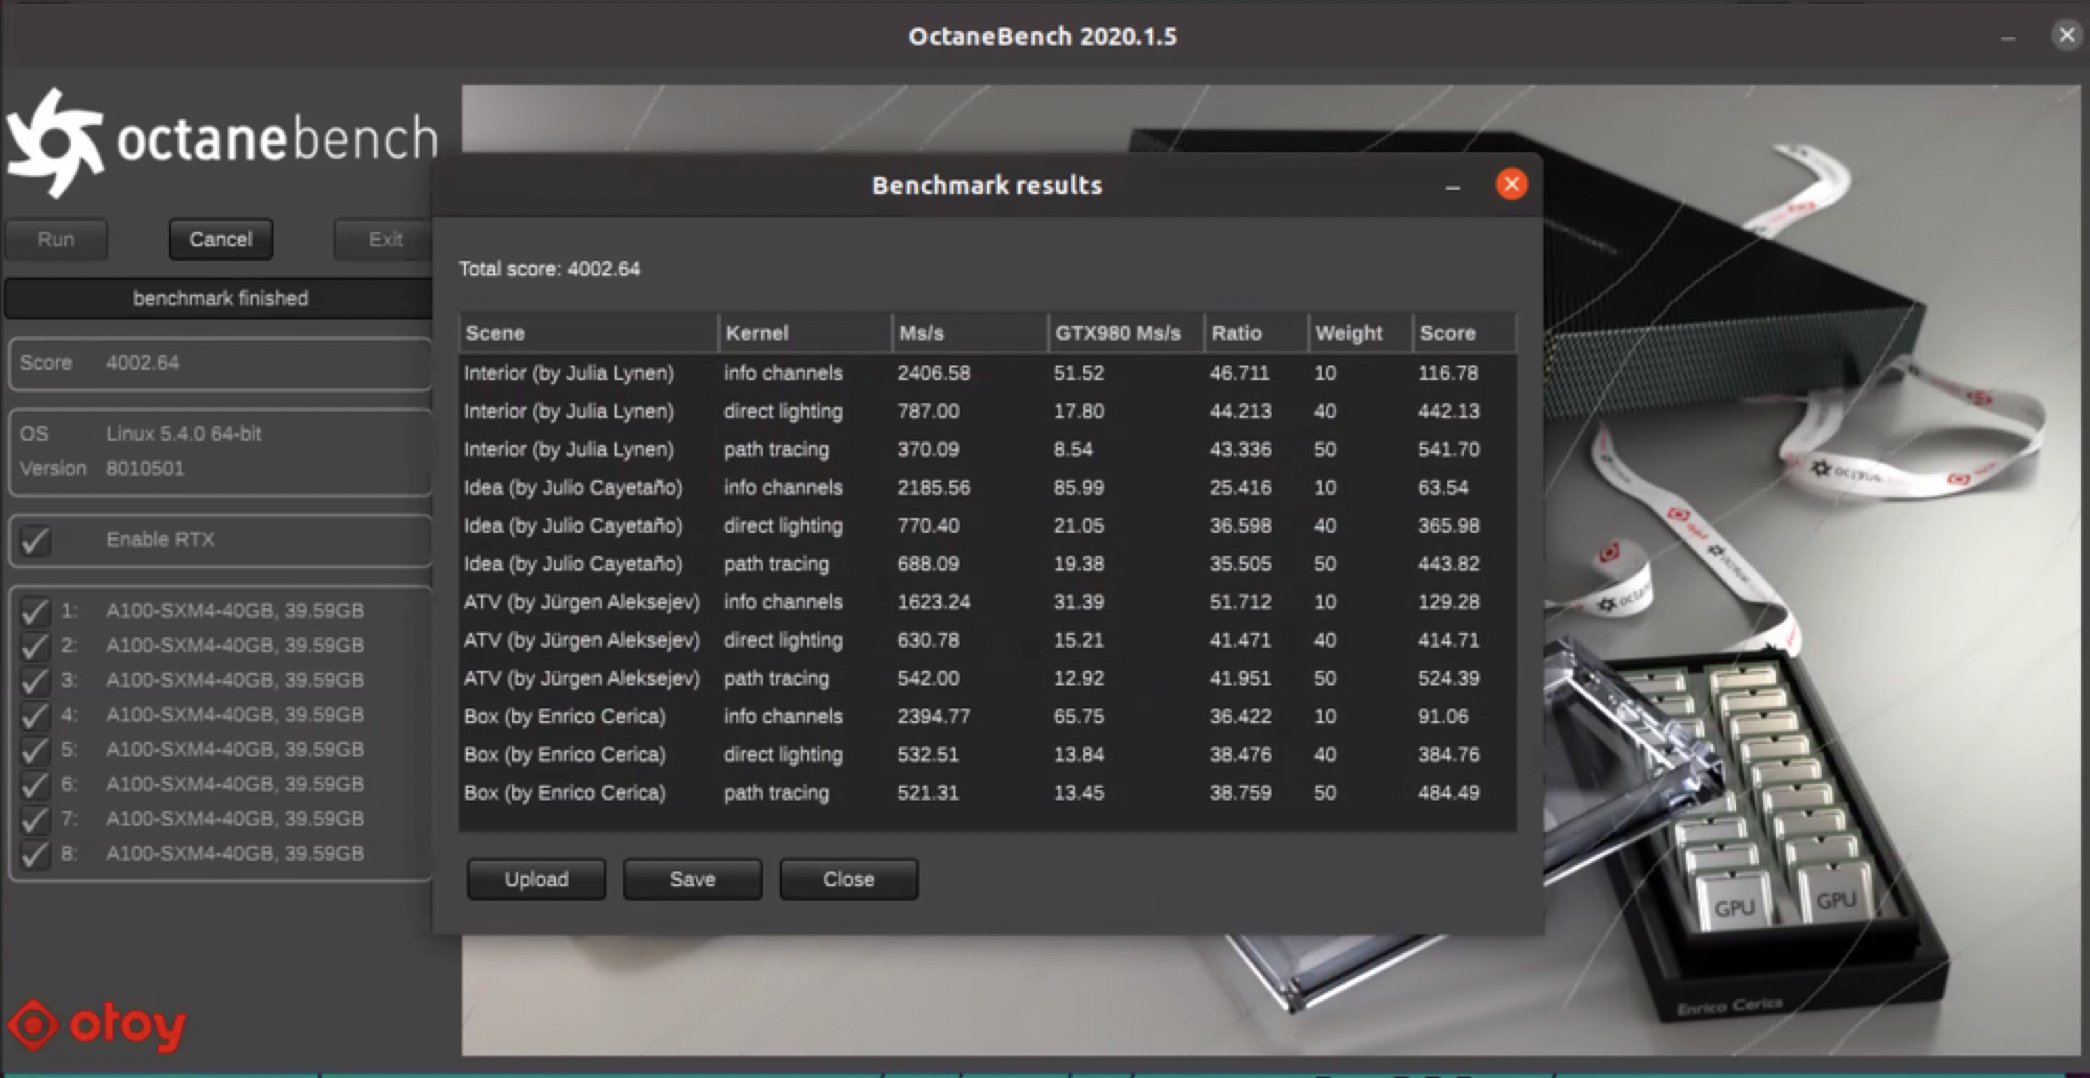
OctaneBench produced the following results on A100:
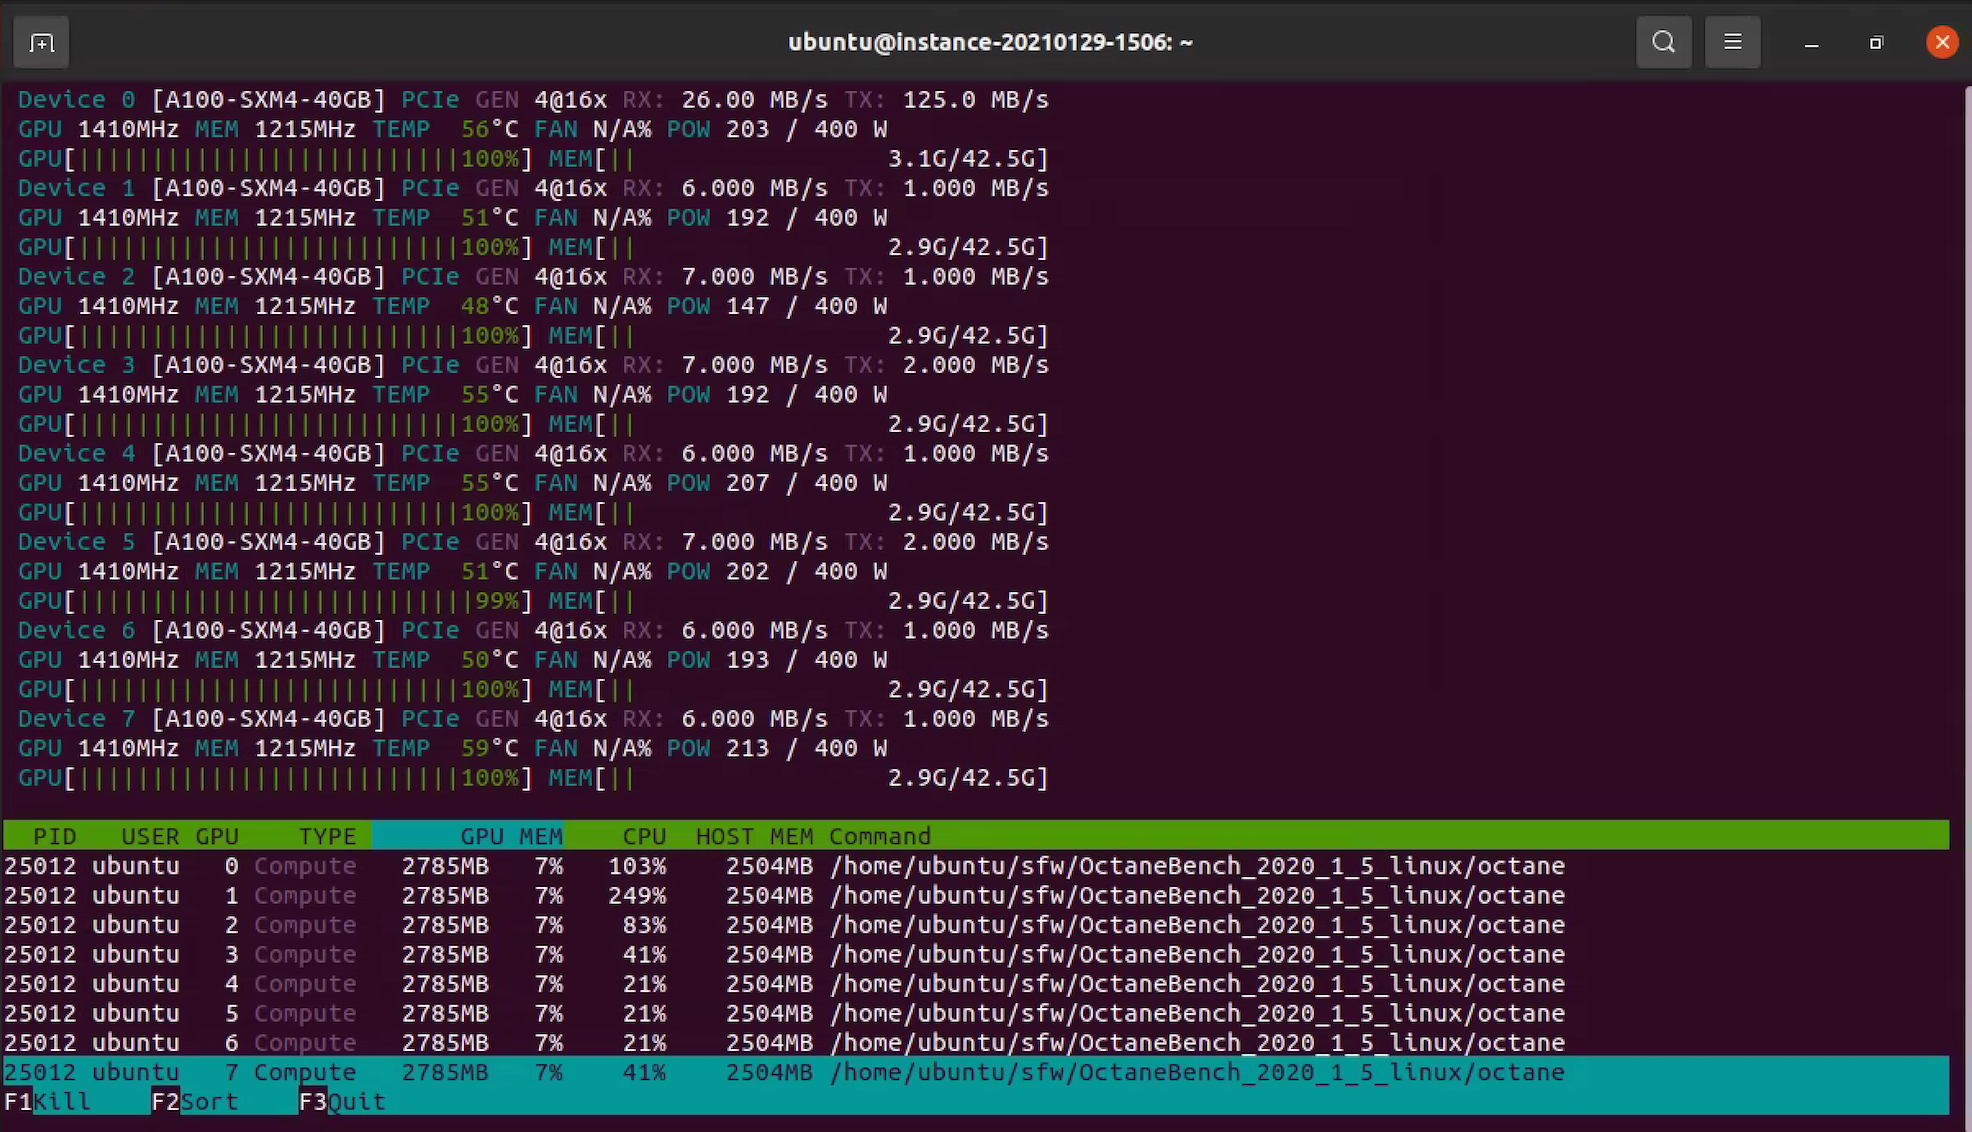
The following screenshot shows the output of “nvidia-smi” CLI while OctaneBench is running. All GPUs are running closer to 100%.
The following charts show more detailed comparisons.
| A100 | V100 | ||||||||
| Scene | Kernel | Ms/s | GTX980 Ms/s | Ratio | Score | Ms/s | GTX980 Ms/s | Ratio | Score |
| Interior (by Julia Lynen) | Info channels | 2406.575448 | 51.52 | 46.711 | 116.7787 | 866.835291 | 51.52 | 16.825 | 42.063048 |
| Interior (by Julia Lynen) | Direct lighting | 786.999573 | 17.8 | 44.213 | 442.134592 | 301.828121 | 17.8 | 16.957 | 169.56636 |
| Interior (by Julia Lynen) | Path tracing | 370.090978 | 8.54 | 43.336 | 541.702251 | 135.803053 | 8.54 | 15.902 | 198.774961 |
| Idea (by Julio Cayetaño) | Info channels | 2185.555242 | 85.99 | 25.416 | 63.540971 | 992.86314 | 85.99 | 11.546 | 28.865657 |
| Idea (by Julio Cayetaño) | Direct lighting | 770.396538 | 21.05 | 36.598 | 365.984104 | 285.22701 | 21.05 | 13.55 | 135.499767 |
| Idea (by Julio Cayetaño) | Path tracing | 688.094549 | 19.38 | 35.505 | 443.817434 | 256.221166 | 19.38 | 13.221 | 165.26133 |
| ATV (by Jürgen Aleksejev) | Info channels | 1623.244713 | 31.39 | 51.712 | 129.280401 | 575.44937 | 31.39 | 18.332 | 45.830628 |
| ATV (by Jürgen Aleksejev) | Direct lighting | 630.777566 | 15.21 | 41.471 | 414.712404 | 218.859478 | 15.21 | 14.389 | 143.891833 |
| ATV (by Jürgen Aleksejev) | Path tracing | 542.004713 | 12.92 | 41.951 | 524.385365 | 184.506869 | 12.92 | 14.281 | 178.508968 |
| Box (by Enrico Cerica) | Info channels | 2394.771736 | 65.75 | 36.422 | 91.05596 | 1006.106289 | 65.75 | 15.302 | 38.254992 |
| Box (by Enrico Cerica) | Direct lighting | 532.508886 | 13.84 | 38.476 | 384.760756 | 192.387149 | 13.84 | 13.901 | 139.008056 |
| Box (by Enrico Cerica) | ]Path tracing | 521.309758 | 13.45 | 38.759 | 484.488623 | 197.256713 | 13.45 | 14.666 | 183.324083 |
| A100 (8 GPUs) | V100 (4 GPUs) | |
| Total score | 4002.641560 | 1468.849682 |
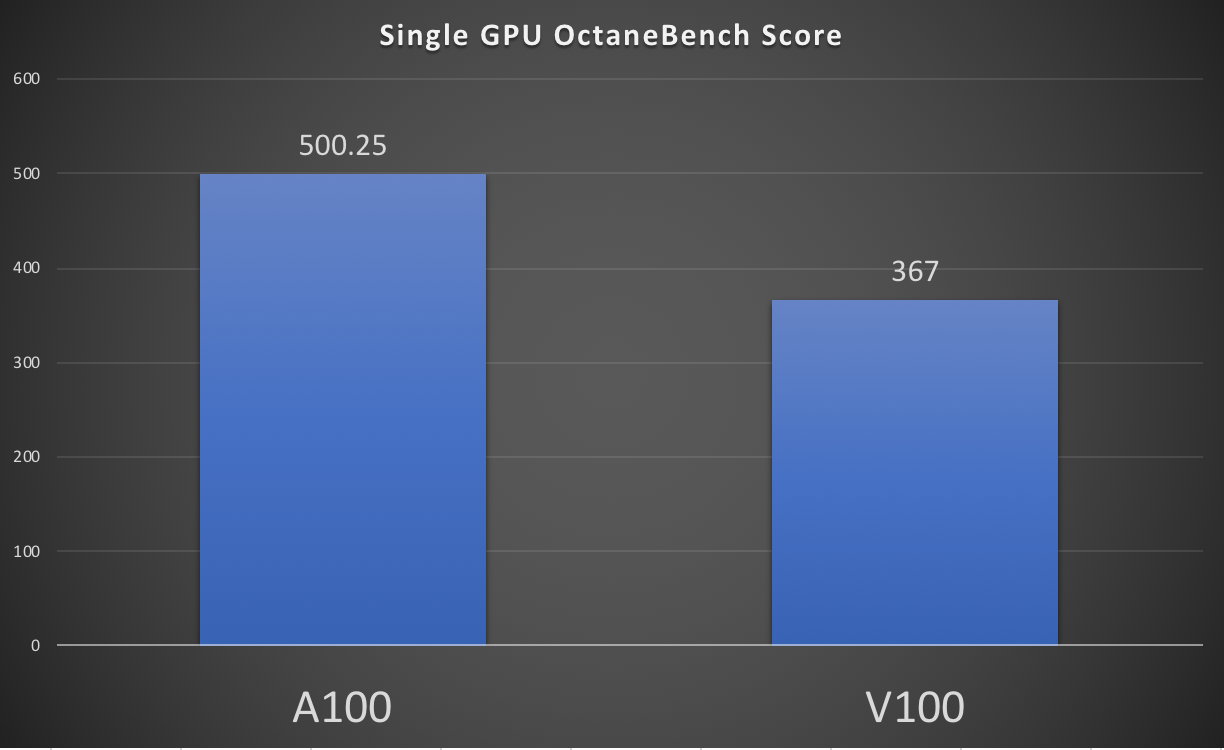
The scores shown in the previous image are for the whole servers with two different counts of GPUs. To compare the single GPU performance, divide the overall server-level score by the number of GPUs.
This graph shows the single GPU score for A100 GPU, 500.25, and V100 GPU, 367. It aligns with the other published results on the OctaneBench website.
Learn more
You can find all the GPU shapes available at Oracle Cloud GPU Offerings.