We’re excited to announce the availability of Oracle Cloud Infrastructure (OCI) Grafana plugins for Metrics and Logging. Grafana is a popular technology for dashboarding operations and visualizing metrics and logs. Joint OCI and Grafana customers can now use these plugins for visualizing metrics and logs from Monitoring and Logging services in a single pane of glass. The OCI Grafana plugins for Metrics and Logging are free and available for download from the Grafana plugin store.
Monitoring and Logging
One of the goals of Oracle Cloud Observability and Manageability platform is to meet our customers where they are. We understand that enterprises have standardized their operational postures using Observability tools from different vendors. They have made deep financial and intellectual investments in these tools and it’s hard to change them.
Grounded in this knowledge, our Observability services support easy interoperability with the rest of the Observability ecosystem, which includes products such as Twilio, PagerDuty, Slack, and so on. Our services support open standards. Our Events service supports CNCF events, our Logging service supports FluentD agents, and our Streaming service supports Kafka-compatibility— all for painless interoperability with the Observability system. The OCI Grafana plugins for Metrics and Logging extend interoperability, so our customers can continue using Grafana with Monitoring and Logging services.
Features
The Oracle Cloud Infrastructure Grafana plugins for Metrics and Logging support the following features:
-
Easy set up: Setting up the plugins to visualize metrics from Monitoring and Logging services is easy. Provide the required configuration in the plugin, such as tenancy OCID and region, and the plugin is ready for use.
-
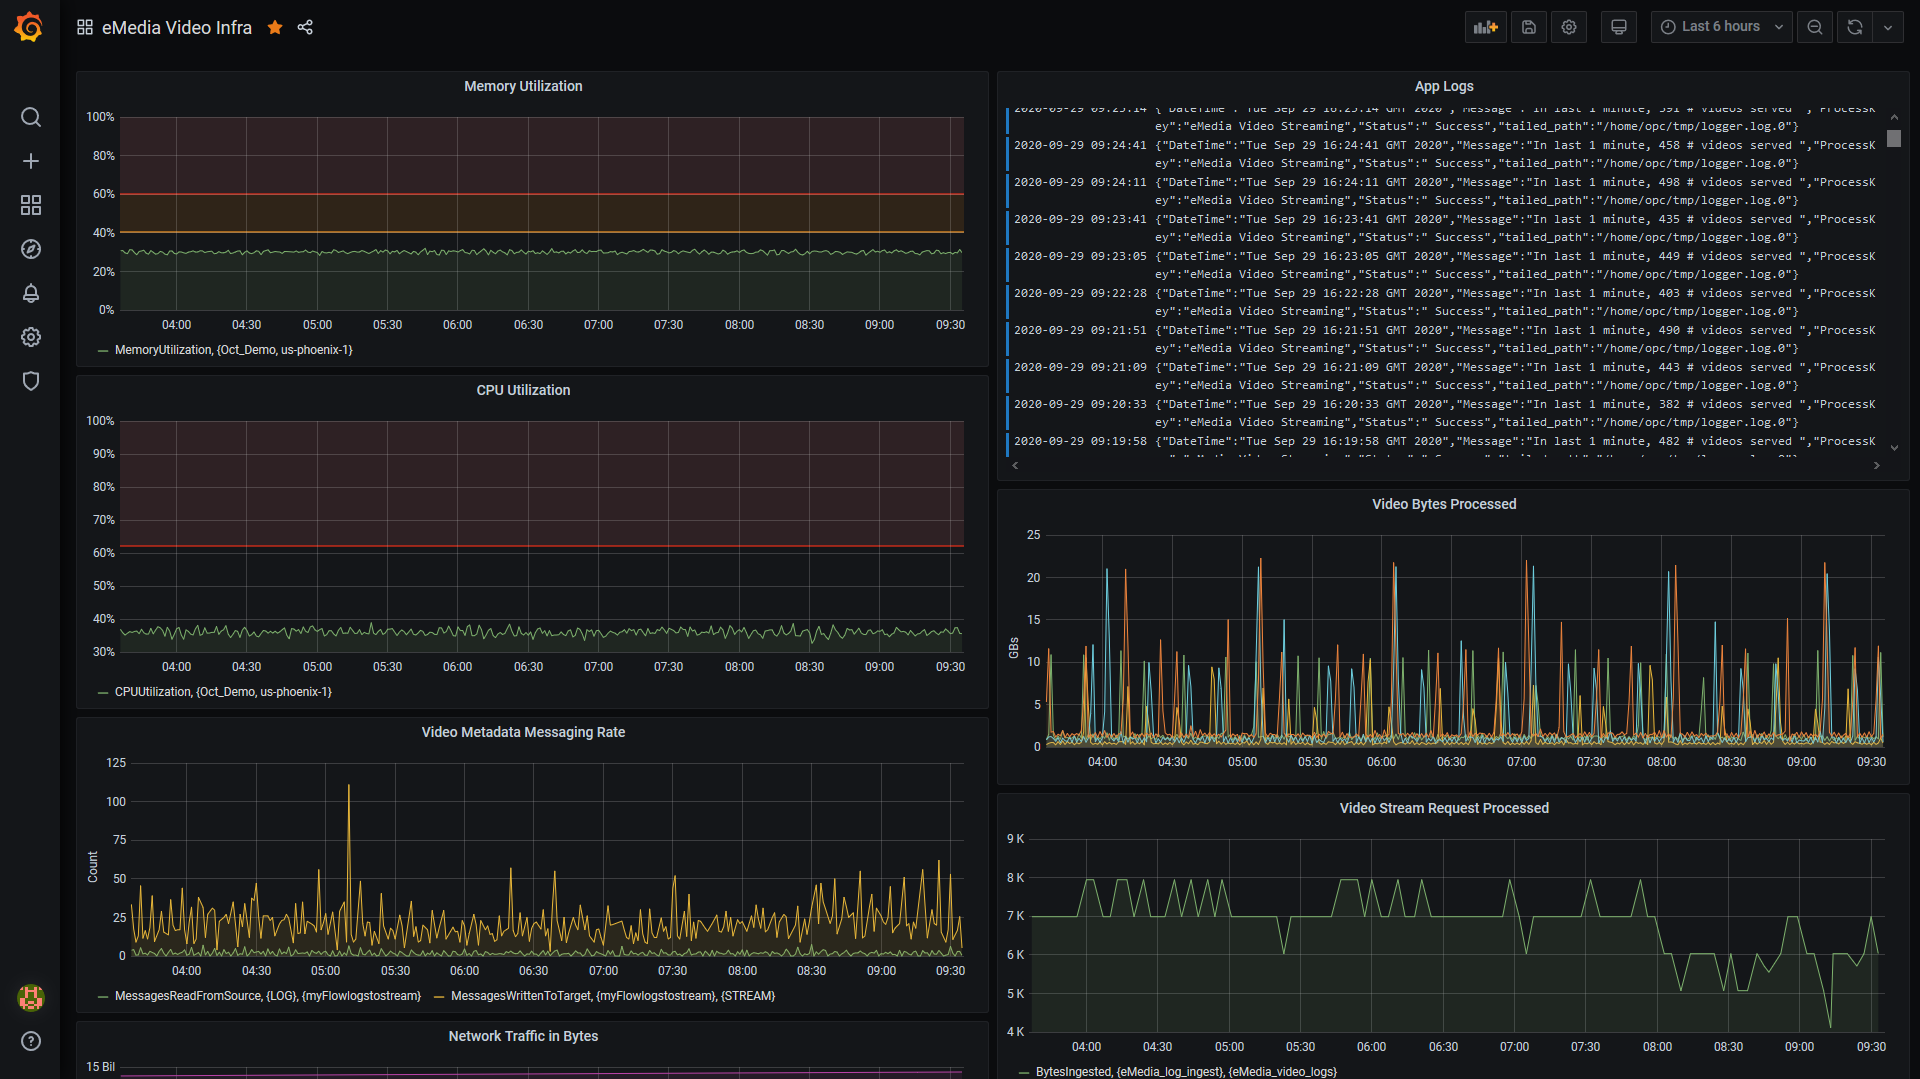
Single pane of glass: You can now visualize all metrics and logs from the Monitoring and Logging services in a single pane of glass, which reduces time to investigate and resolve issues.
-
Integrated with Oracle Cloud Infrastructure Identity and Access Management (IAM): The plugins integrate with OCI IAM, so you’re in control of who can access your data.
-
Dimensions and Templating: The plugins support Dimensions and Templating functionalities for adding specificity to your graphs and for dynamically interacting with them.
-
Custom metrics and logs: Monitoring and Logging services enable you to bring your own custom metrics and logs and prove out of the box metrics and logs from Oracle Cloud services. You can use these plugins to visualize both custom metrics and logs.
Getting Started
The Oracle Cloud Infrastructure Grafana plugins for Metrics and Logging are now officially available from the Grafana plugin store.
We welcome you to sign up for the Oracle Cloud Free Trial or sign in to your account to experience the newly announced Logging and Monitoring services with the Grafana plugins.