Welcome back! We hope that you’re enjoying these introductory blogs about Oracle Cloud Infrastructure (OCI) Data Integration. To get the list of previous blogs related to Data Integration, refer to the Data Integration blog site. Today, we’re learning about the pivot operator feature in OCI Data Integration.
In this blog post, we walk you through an example of how to use the new pivot operator in Data Integration. In this example, we convert data from row level to column level using the pivot operator. The pivot operator rotates a table-valued expression by turning the unique values from one column in the expression into multiple columns in the output. Using the pivot operator, we can perform aggregate operation where we need them.
Prerequisites
- Refer to our previous blogs on Data Integration and Oracle documentation to set up workspace, projects, and applications, and understand the creation and execution of a Data Flow using integration tasks.
- Define data assets for source and target in the workspace.
In this example, we use the following source table, Sales:
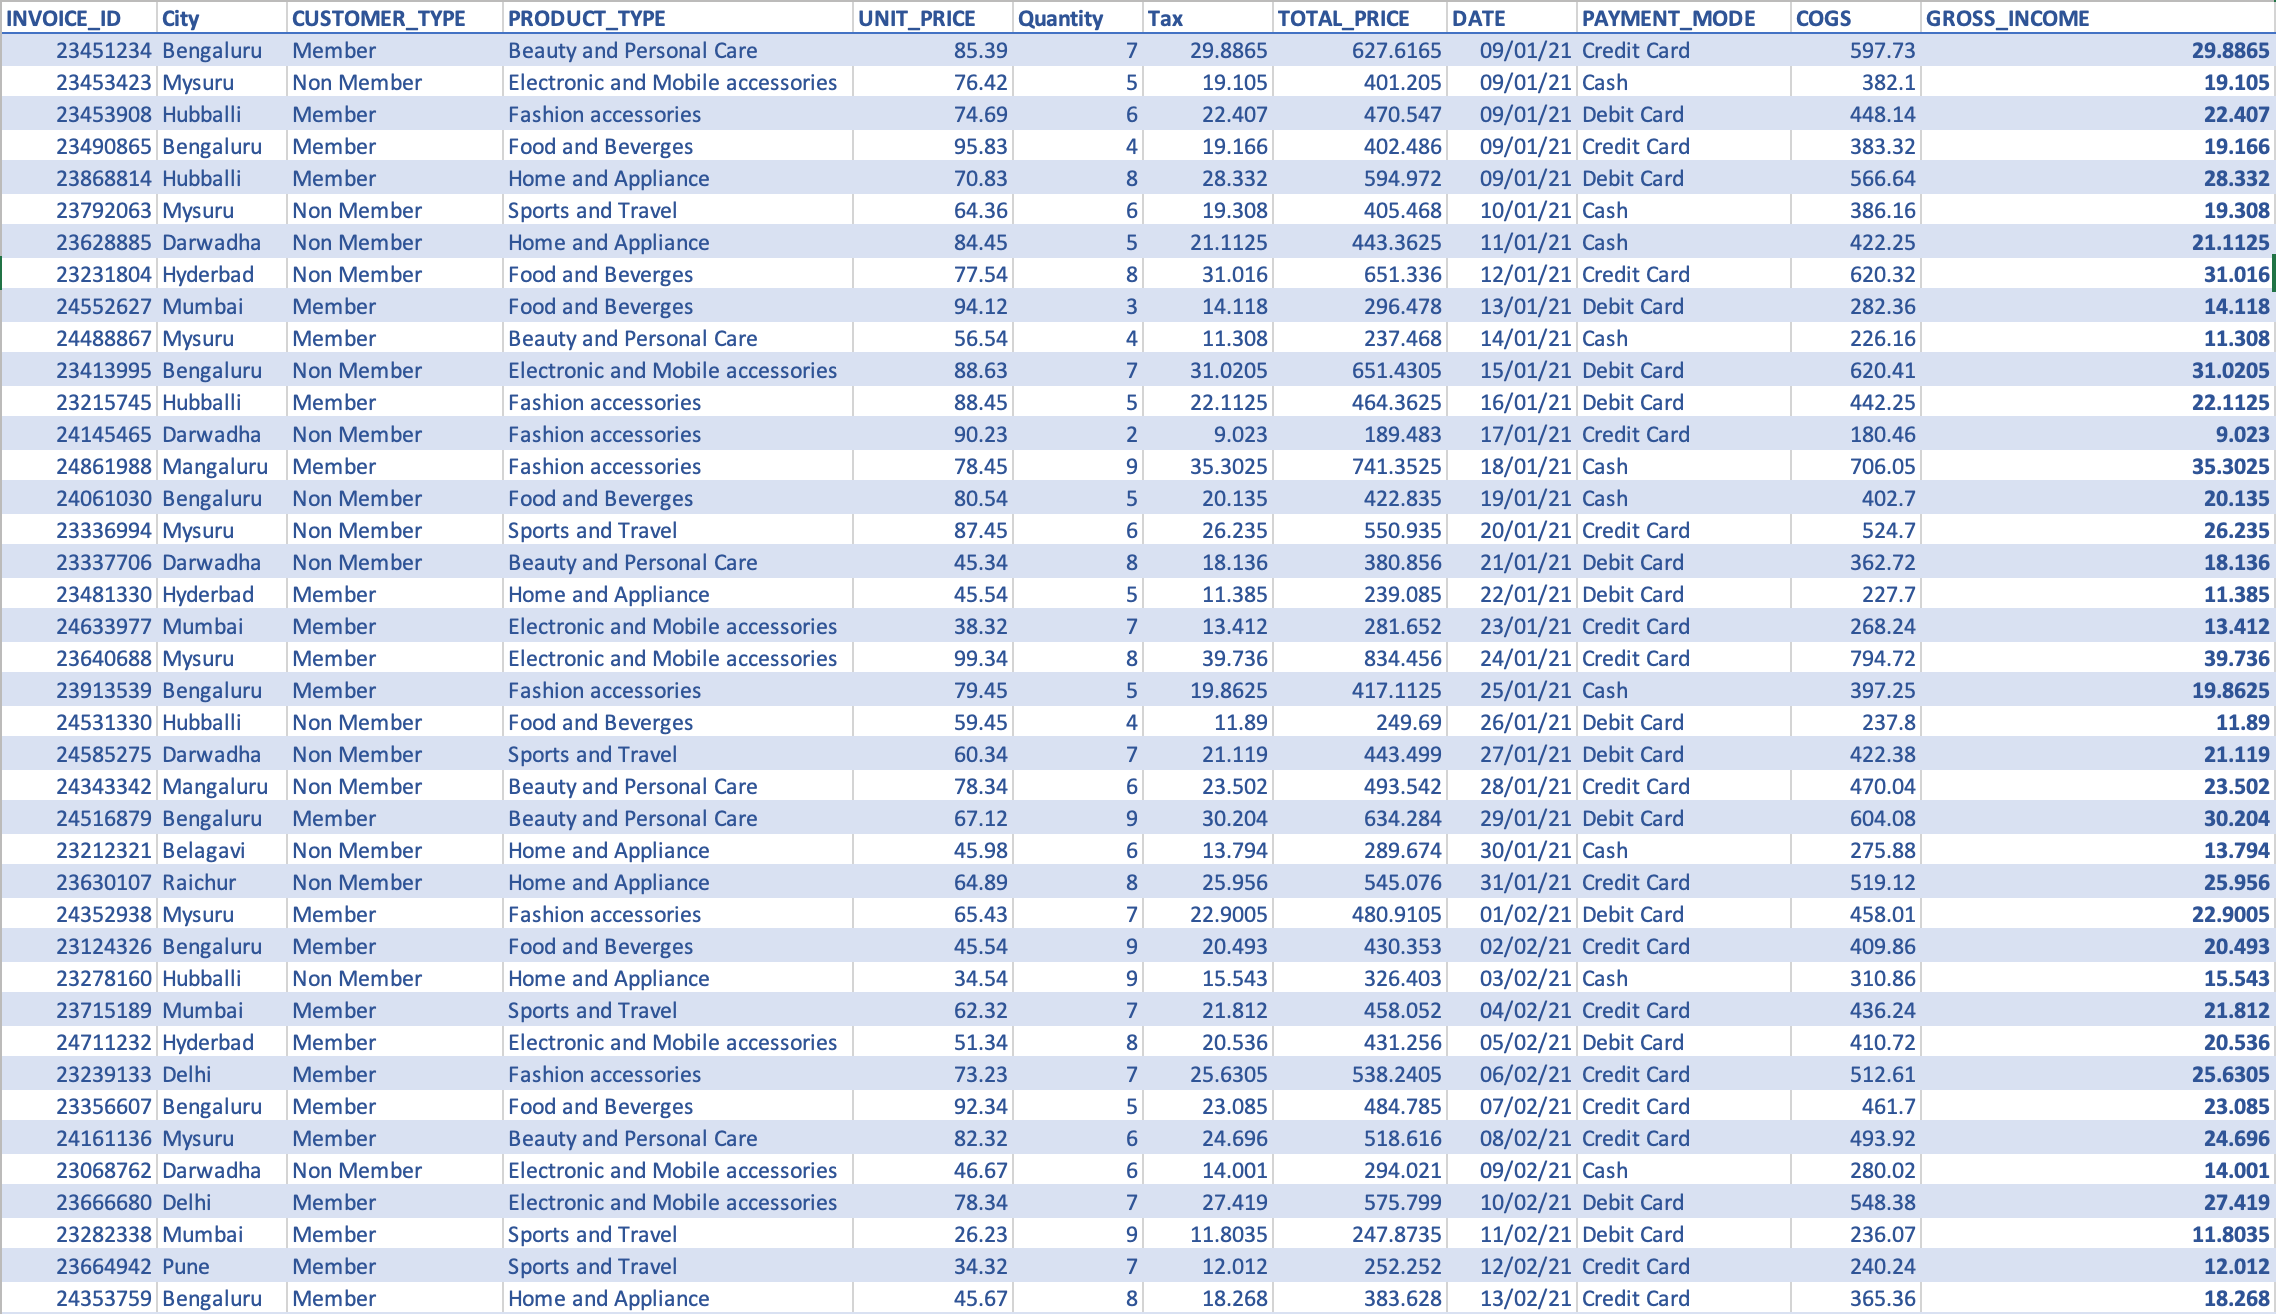
Figure 1: Pivot table example: Source dataset
Our goal is to find sum of gross income for different product types corresponding to customer type (member and non-member), using pivot and load into Autonomous Data Warehouse.
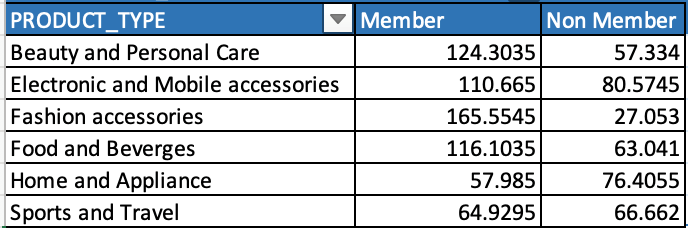
Figure 2: Pivot data
Creating the data flow using pivot operator, creating the integration task, publishing the task into applications, and running the task
1. Add the source operator and select the Sales table.
2. Add a pivot operator and connect to the source. The pivot operator requires following parameters:
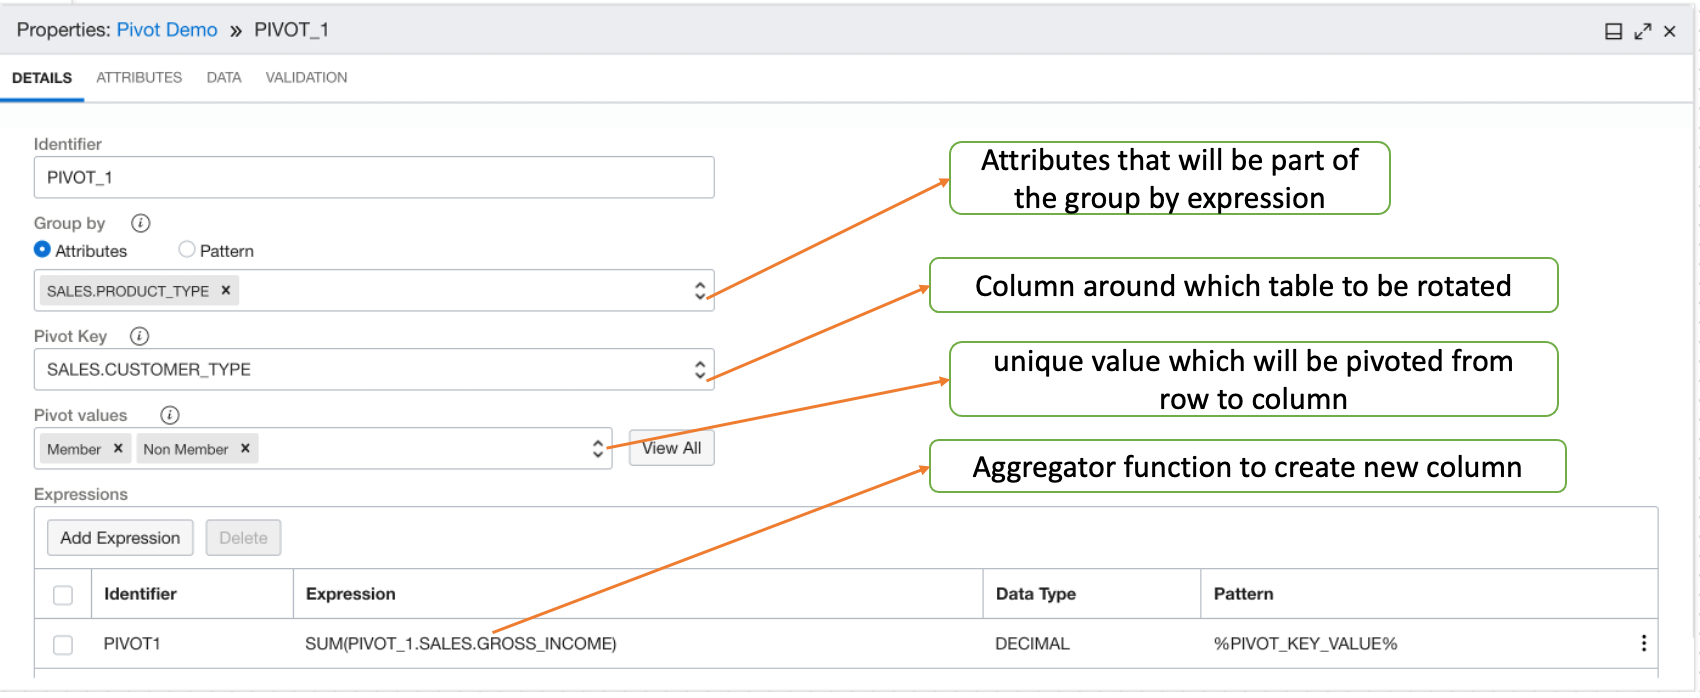
Figure 3: Pivot operator details
When you click the Add Expression button, it opens the Expression Editor panel to specify expressions.
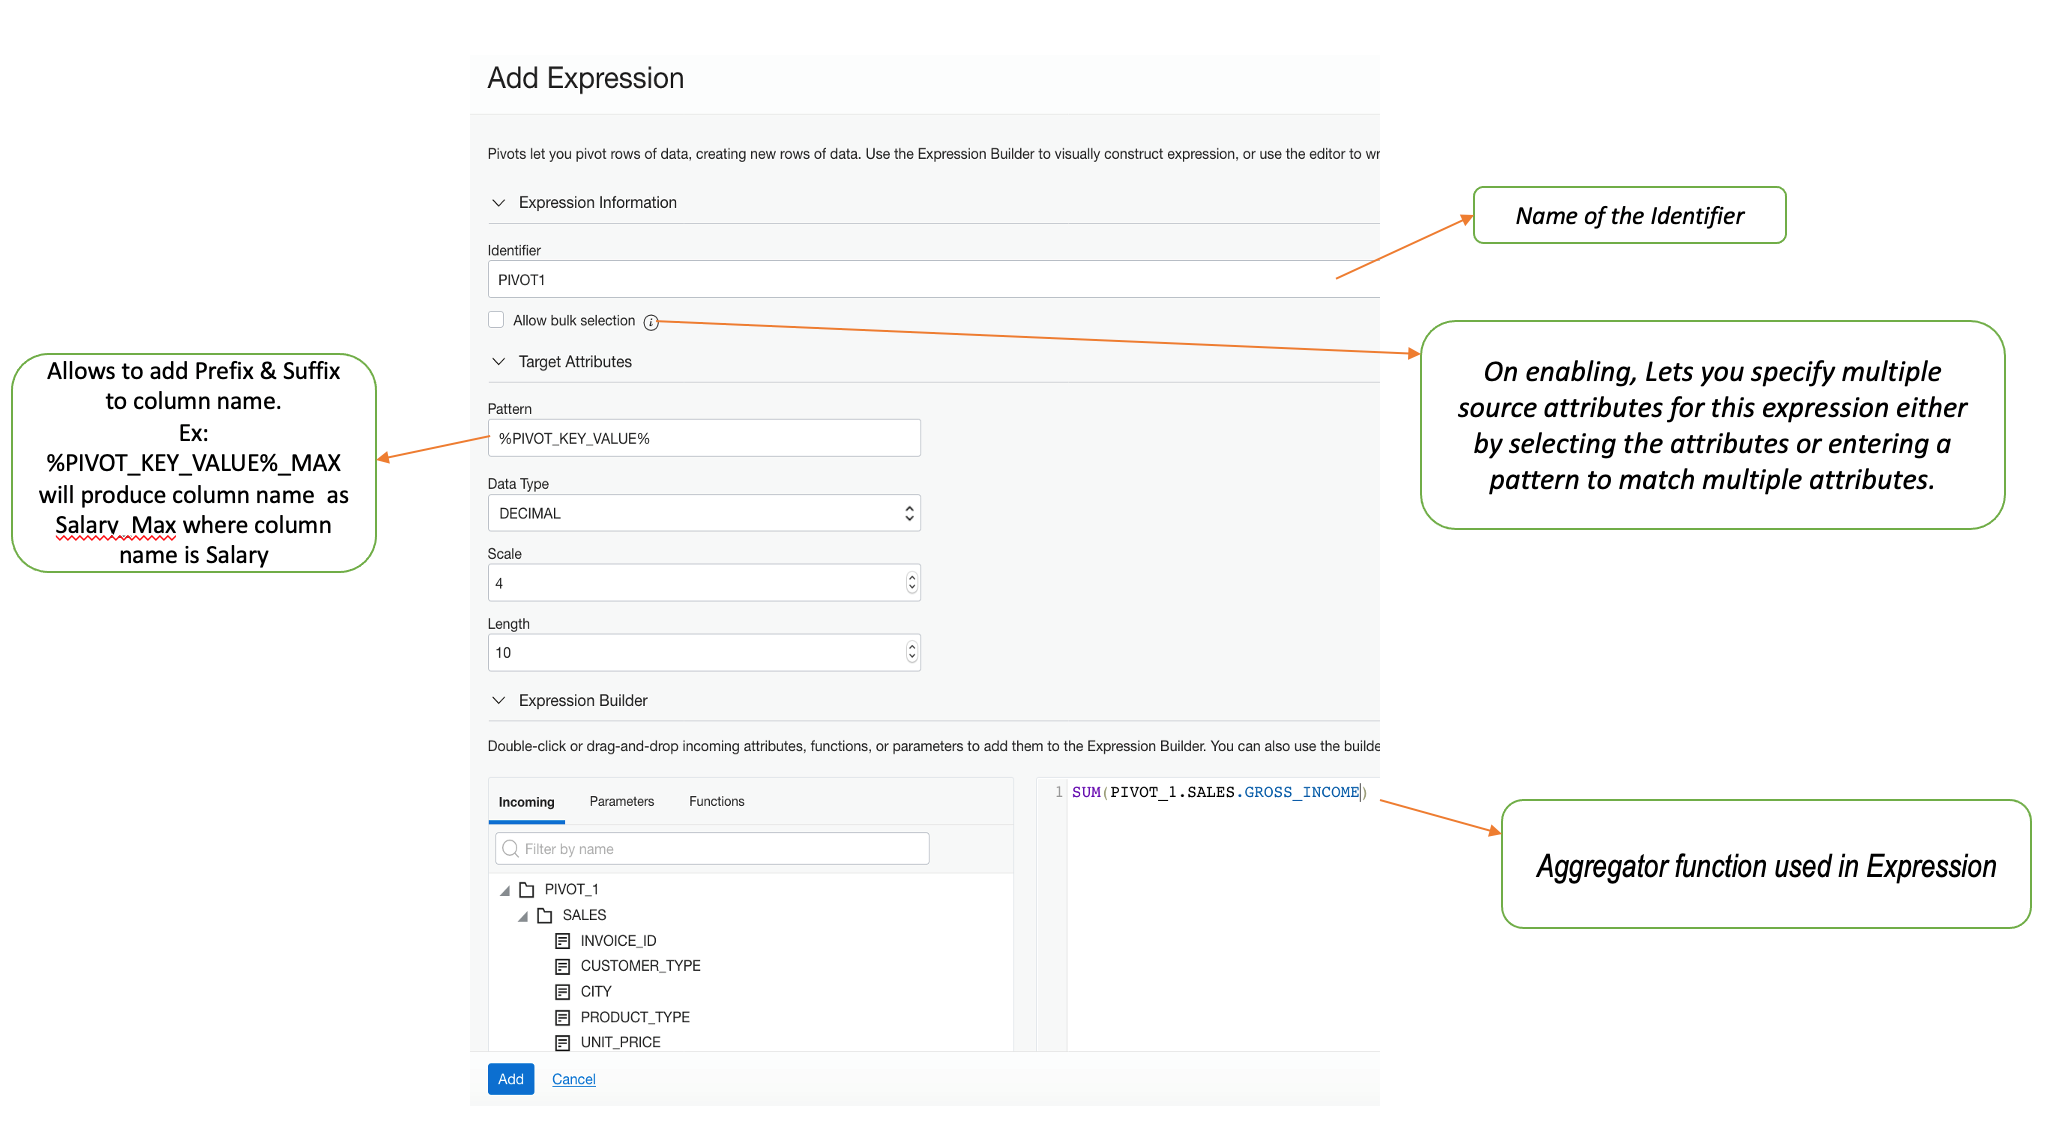
Figure 4: Expression Editor panel details
- Specify the Group By column: Pick attributes as part of the group by expression.
- Specify the pivot key: Pick one attribute to be pivoted from rows to columns (CUSTOMER_TYPE in the example). Pivoting key values is optional. By default, each unique value is pivoted from row to column. You can enter one or more specific values (member and non-member in the example) found in the pivot key attribute to be pivoted.
- Specify pivot expressions: Aggregate function. In this example, we use SUM(Gross_Income).
3. Click the Data tab of the pivot operator to see the pivoted data.
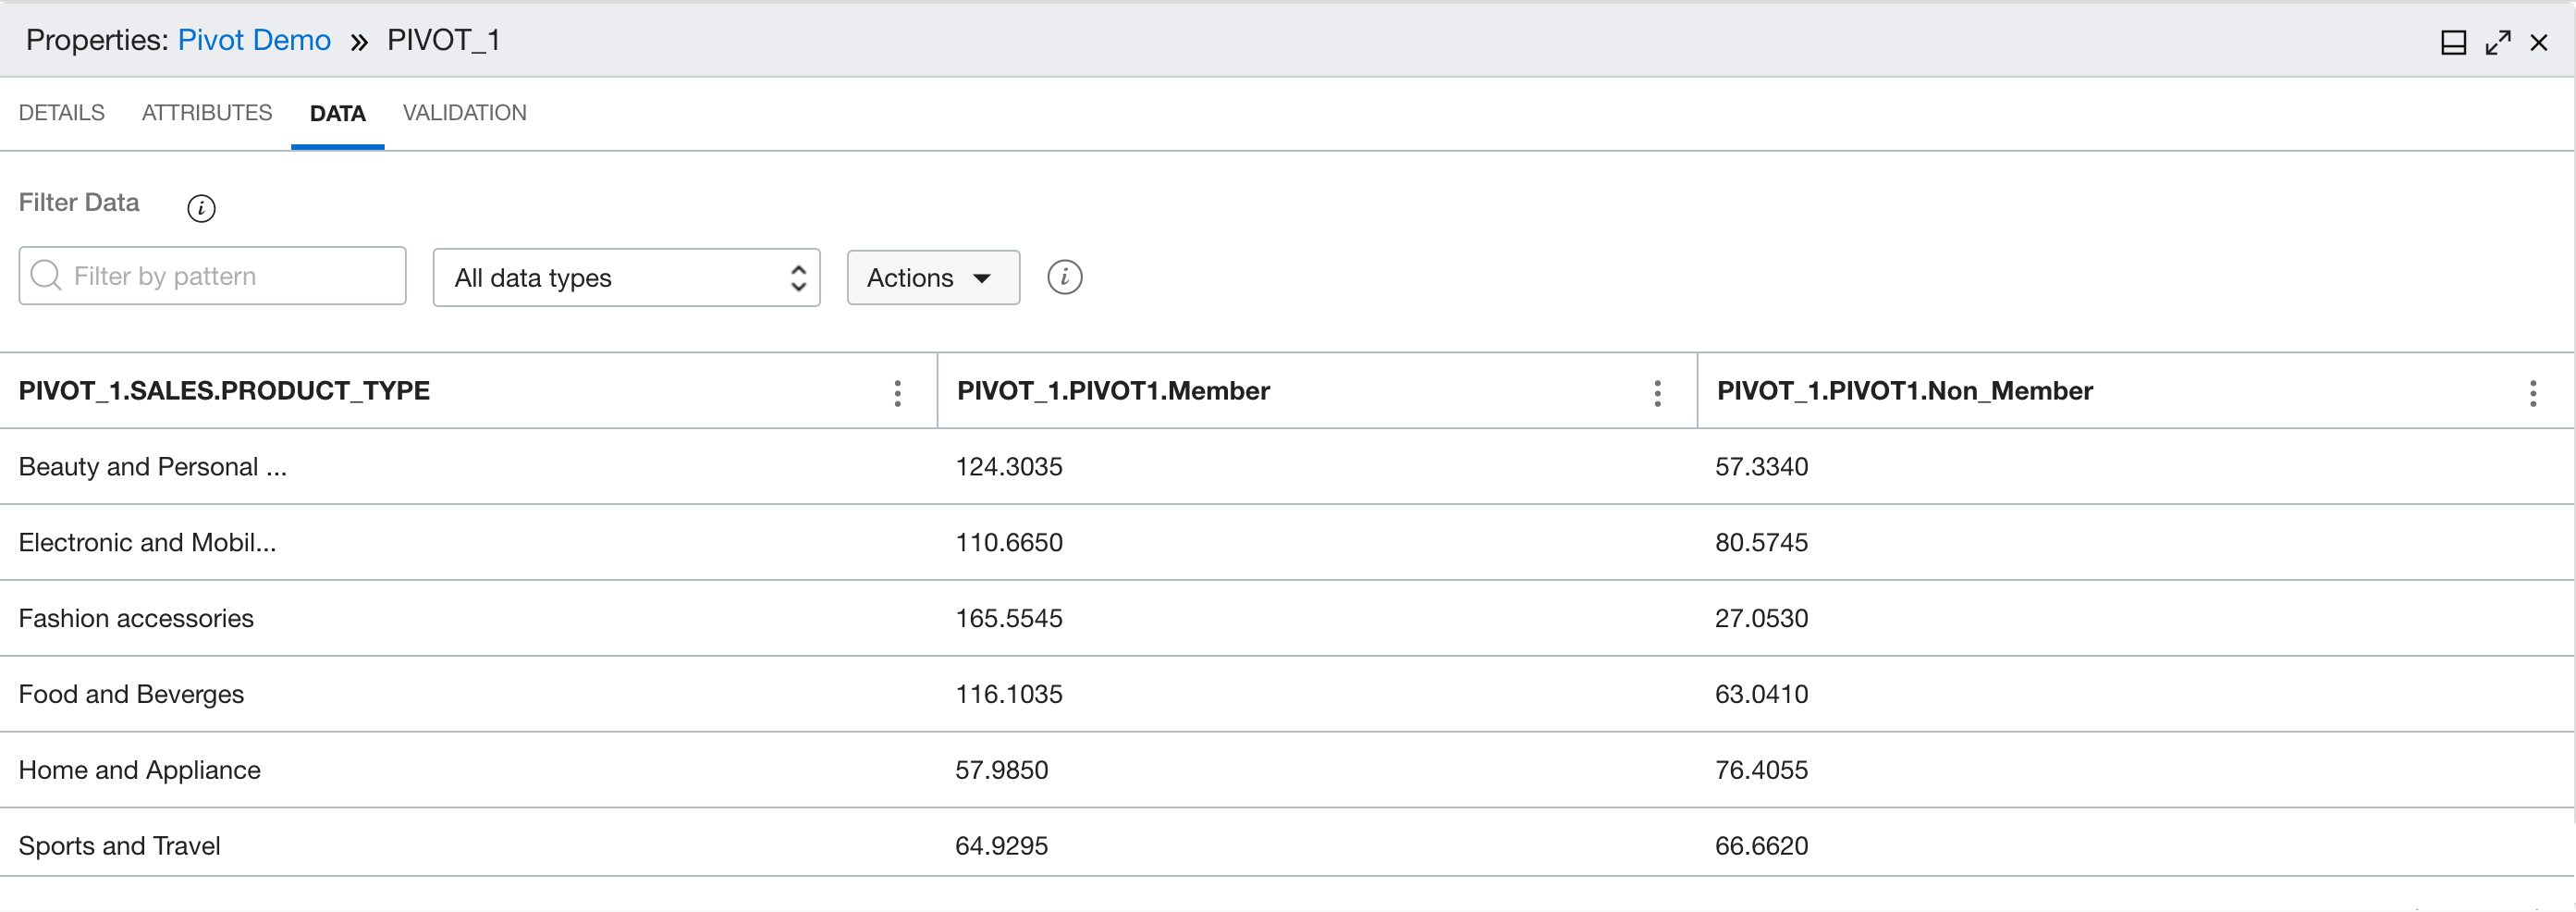
Figure 5: Preview of the pivot data
4. Add a target operator pointing to an Autonomous Data Warehouse table. The final data flow looks like the following example:
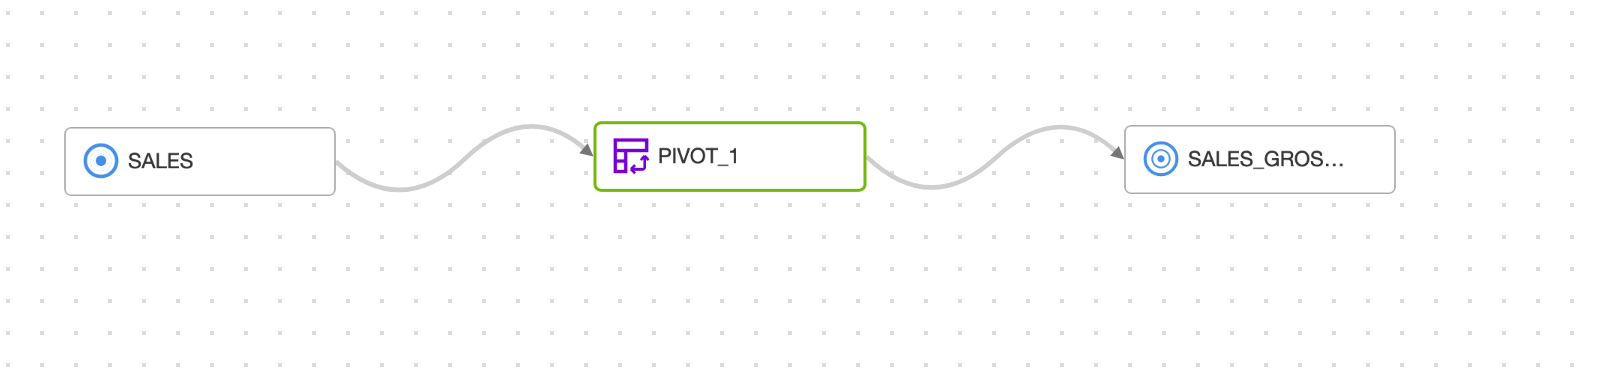
Figure 6: Data flow
When the data flow design is complete, save it, create an integration task, publish to an application, and then run the corresponding task.
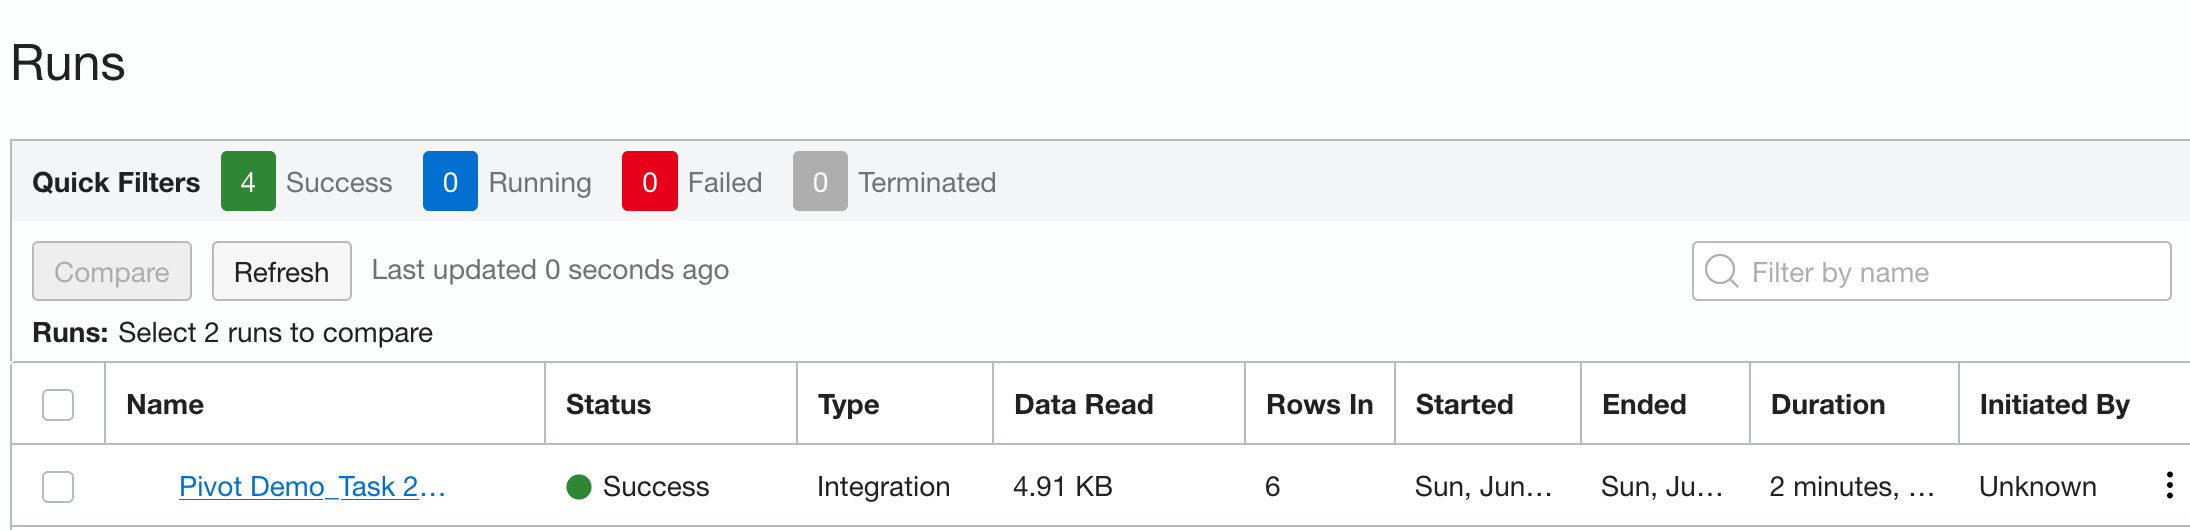
Figure 7: Monitor integration task run
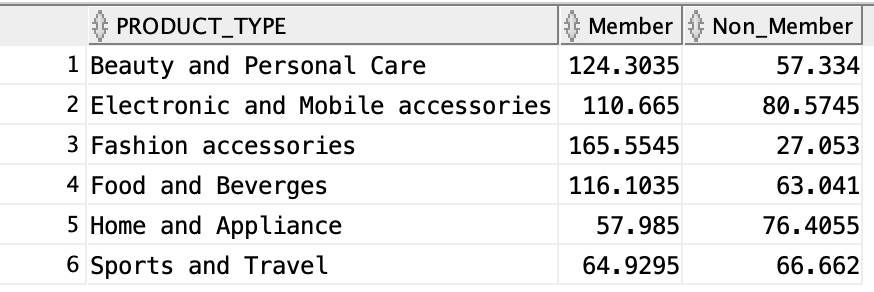
Figure 8: Final output in the target table
Conclusion
In this article, we explained how to use pivot operator in OCI Data Integration service to convert rows into columns. We also demonstrated a simple scenario in which we calculated the sum of gross income for different product types corresponding, to the member and non-member customers values.
We hope that this blog helps as you learn more about Oracle Cloud Infrastructure Data Integration. For more information, check out the tutorials and documentation. Remember to check out all the blogs on OCI Data Integration!