As Oracle AI Database@AWS estates grow, the volume of operational telemetry grows with them. Traditional log queries help teams search faster, but they still leave DBAs and architects doing the heavy lifting of interpretation, correlation, and next-step analysis.
A stronger operating model is to pair OCI Log Analytics with LoganAI for AI-assisted interpretation and Amazon CloudWatch Logs Insights for fast, AWS-native log exploration. Together, they help teams move from raw telemetry to guided investigation, faster incident triage, and more consistent multicloud observability.
This document discusses about the non-database operational logs like Audit logs for OCI and AWS.
| At a glance | Why it matters |
| Focus: LoganAI in OCI Log Analytics , CloudWatch Logs Insights Outcome: faster, AI-assisted root-cause analysis for Oracle AI Database@AWS | Use CloudWatch Logs Insights to centralize and filter AWS-native log streams. use OCI Log Analytics with LoganAI to summarize patterns, explain signals, and guide deeper investigation with follow-up questions and contextual interpretation. |
Logan AI
For Oracle AI Database@AWS customers, the biggest challenge is not simply collecting logs; it is turning high-volume telemetry into operational decisions. LoganAI addresses that gap by embedding generative AI directly into OCI Log Analytics. Instead of reading hundreds of lines of events and manually building a narrative, operators can ask the platform to explain what the logs mean, what patterns stand out, and where to investigate next.
What LoganAI helps you do
• Summarize individual logs, groups of logs, clusters, and supported charts.
• Generate actionable follow-up questions that guide deeper investigation.
• Translate technical log patterns into user-friendly operational explanations.
• Work directly inside the OCI Log Analytics experience without requiring AI expertise.
• Improve DBA productivity by reducing repetitive triage and interpretation work.
Models and regional considerations
LoganAI uses model such as meta-llama or cohere depending on availability. When enabling LoganAI, you select an OCI Generative AI region. Log data is then sent from the current OCI region to that Generative AI region for processing, which is an important consideration for security, privacy, and internal governance reviews.
Enable LoganAI for the tenancy
The enablement flow is straightforward, but it is worth documenting cleanly because several steps are tied to tenancy configuration, IAM alignment, and license handling.
- Navigate to Log Analytics Home and Click on Administration.
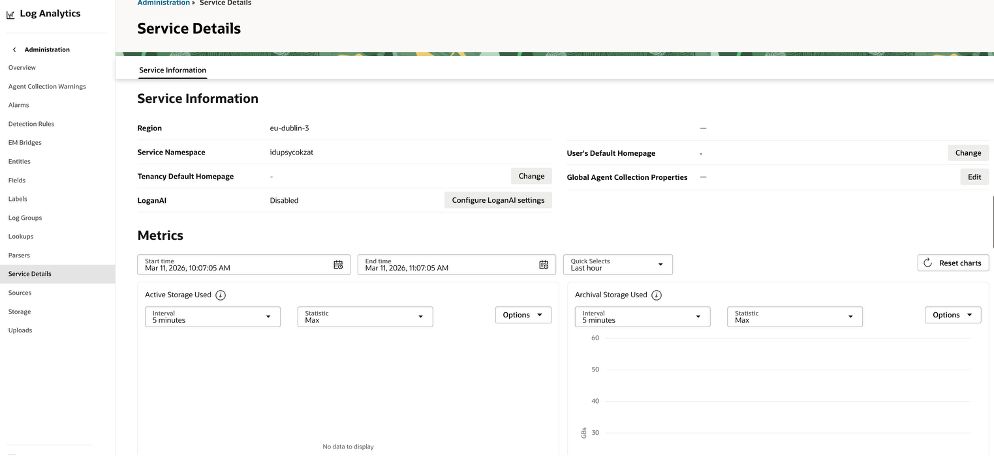
- Open the Service Details page for OCI Log Analytics and review the current LoganAI status. By default this is Disabled.
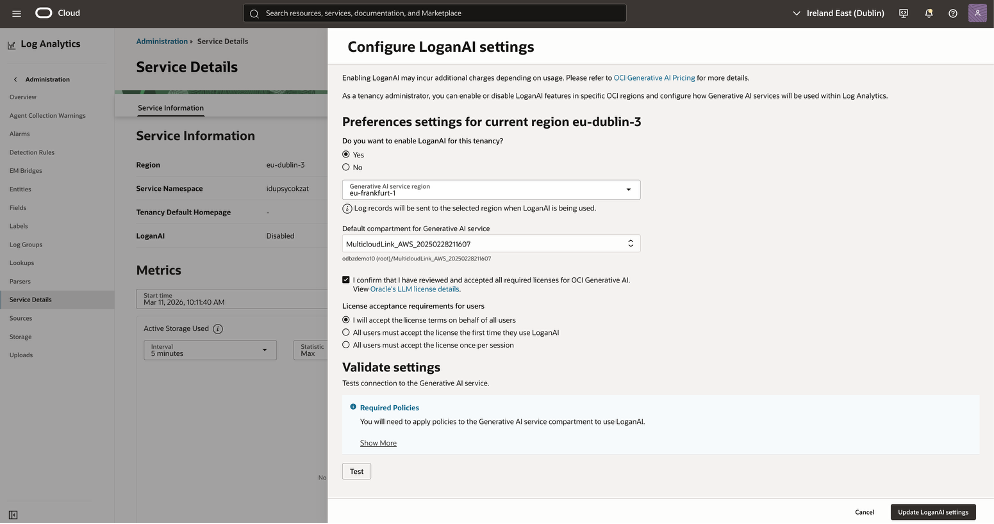
- Select Configure LoganAI settings and set enablement to Yes.
- Choose the OCI Generative AI service region that will process LoganAI requests.
- Select the default compartment for Generative AI access; this must align with the IAM policies used for LoganAI.
- Review and accept the required OCI Generative AI model licenses.
- Choose how license acceptance will be handled for other users in the tenancy.
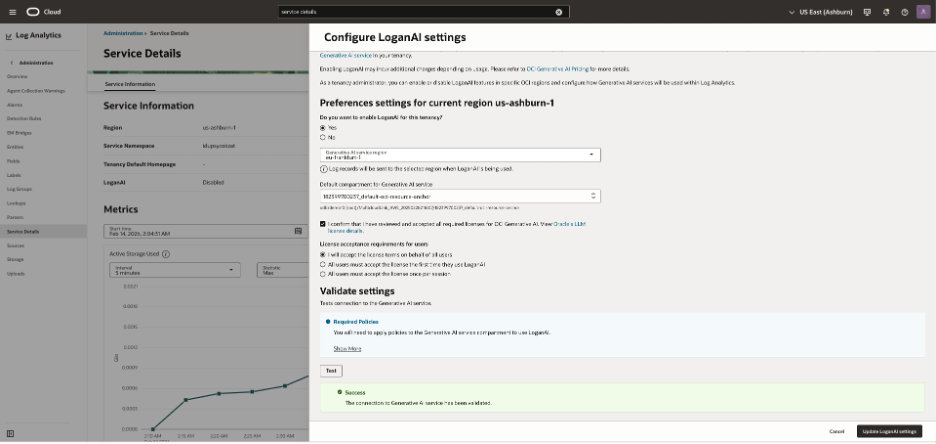
- Run Validate Settings → Test to confirm connectivity to the Generative AI service.
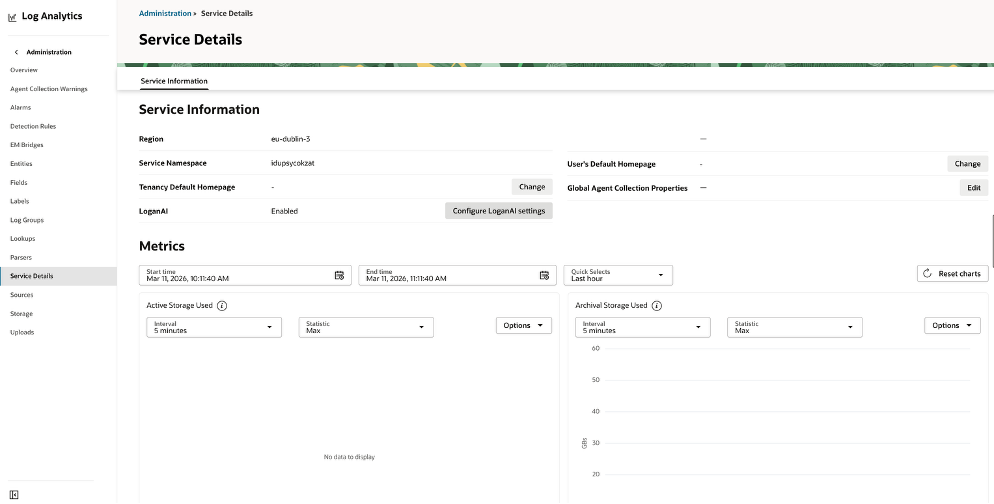
- Save the configuration by selecting Update LoganAI settings.
Use the Explain experience to accelerate investigation
The Explain capability is where LoganAI becomes operationally valuable. It reduces the time between seeing an event and understanding its likely significance.
| Mode | Where you use it | What it helps with |
| Single Log Explain | Individual log record | Explains one event in plain language and supports follow-up questions. |
| Multi-log Explain | Current log result set | Builds a narrative across multiple messages instead of forcing manual scan-and-group work. |
| Cluster Explain | Cluster visualization | Summarizes patterns that appear across grouped logs and helps highlight common event families. |
| Chart Explain | AI-enabled charts | Interprets what the chart is indicating and helps connect visual signals to operational impact. |
Navigate to Log explorer to access the Logan AI.
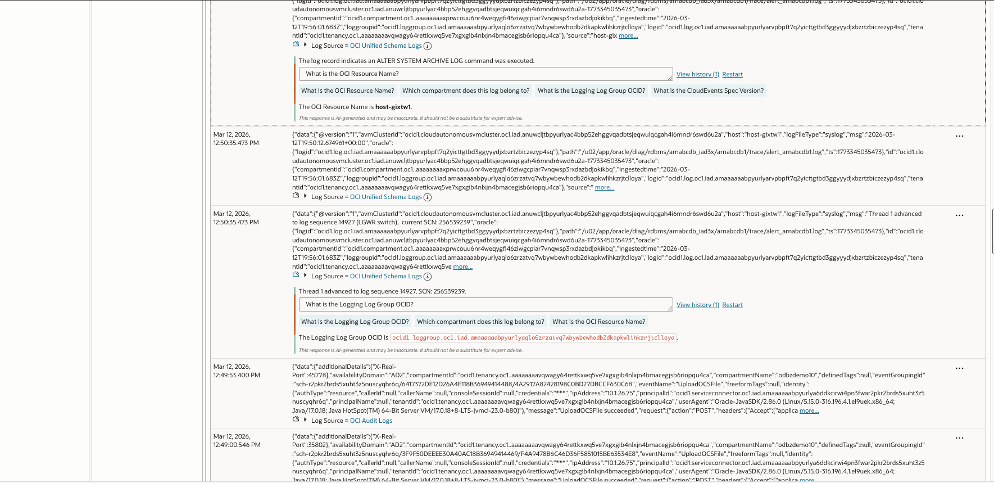
Log Analytics (OCI) showing two parsed log records from an Autonomous Database. OCI Log captured database alert/trace messages from an Autonomous DB host and stored them in a specific Log inside a Log Group.
Log Analytics ingested those log events, parsed them with OCI Unified Schema, and is displaying the normalized fields and metadata (tenant, compartment, log group, log OCIDs).
The Generative AI panel summarizes the event and extracts key identifiers (OCIDs) to help you navigate to the exact Logging resources. Refer to this document for more details on OCI native monitoring for Oracle AI Database@AWS.
AI-powered log analysis with CloudWatch Logs Insights
CloudWatch remains highly valuable in Oracle AI Database@AWS environments because it provides an AWS-native place to collect, search, and analyze operational logs at scale. It is especially useful for first-pass exploration and targeted troubleshooting before or alongside deeper OCI-side analysis.
Recommended workflow in CloudWatch
1. Stream the right logs — Collect operational signals into CloudWatch Log Groups so the data is centralized.
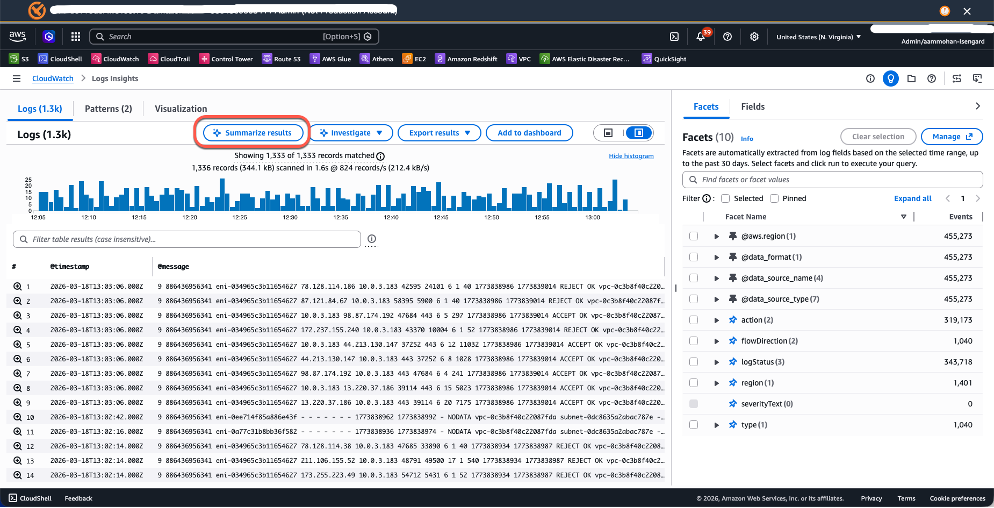
2. Query with Logs Insights — Use the Logs Insights language to filter patterns such as ORA- errors, sort by time, and isolate incident windows quickly.
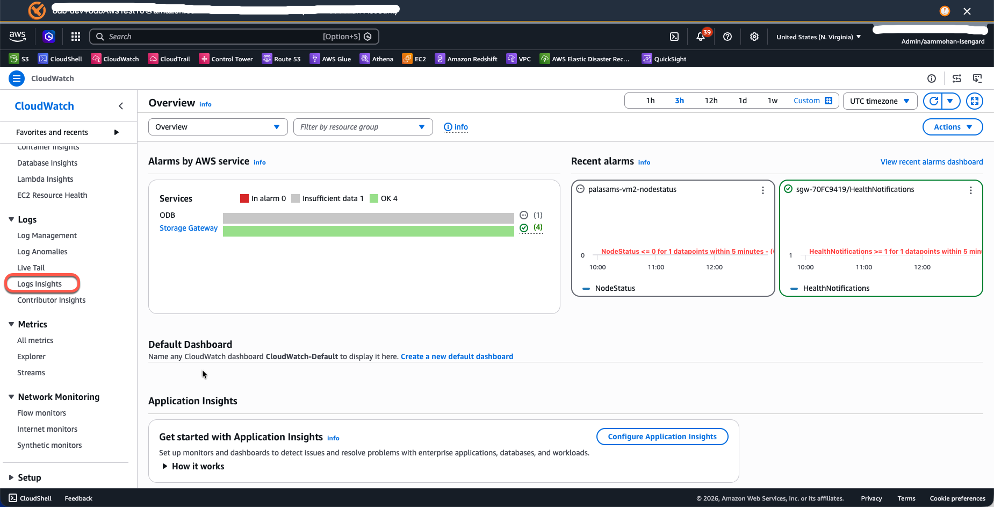
Navigate to CloudWatch →
Logs → Logs Insights in the AWS Console.
Select your target Log Group and write queries using the Logs Insights query language.
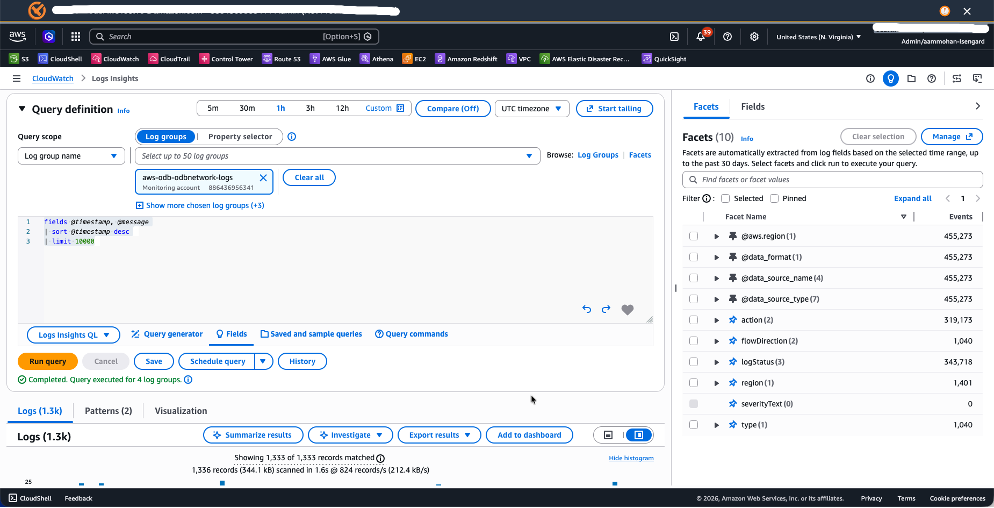
For example:
fields @timestamp, @message | sort @timestamp desc| limit 10000or
fields @timestamp, @message
| filter @message like /ORA-/
| sort @timestamp desc
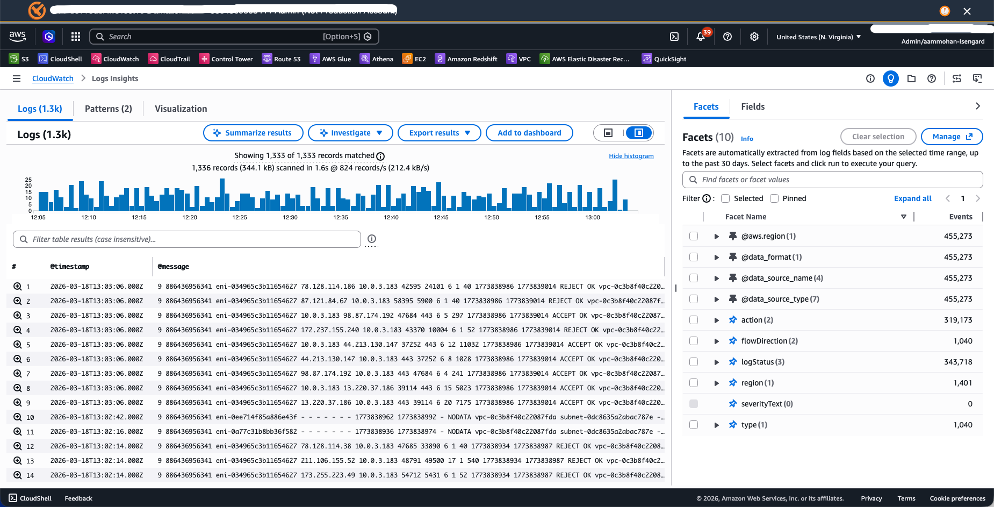
| limit 50This query surfaces the 50 most recent Oracle error messages, helping you quickly identify issues like `ORA-04031` (shared pool memory errors) or `ORA-01555` (snapshot too old).
Pro Tip: Create field indexes on frequently queried fields to dramatically improve query performance and reduce scan volume — especially important when searching across high volumes of logs and thousands of log groups.
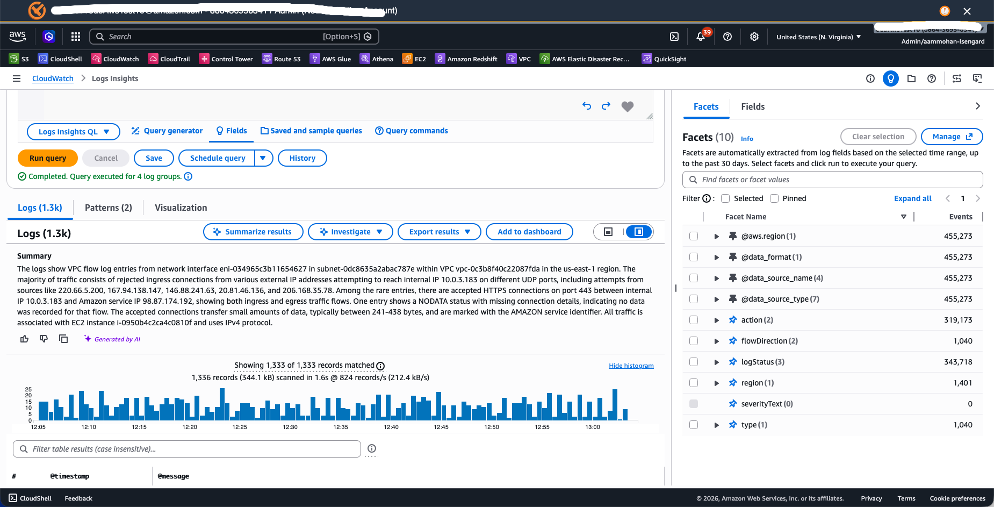
3. Use AI summarization — After running a query, use the Summarize results capability to generate a concise explanation of patterns, anomalies, and likely themes in the returned log set.
Recommended multicloud operating model
| OCI Log Analytics with LoganAI | AWS CloudWatch Logs Insights | When to use both |
| • Analytics need to be centralized across Oracle AI Database@AWS, OCI, and potentially on-premises • AI-assisted summary and contextual interpretation are the priorities • The team wants one platform for broader operational analysis instead of cloud-specific tooling • DBA, SRE, and platform teams want richer explanation and investigation support | • Logs originate primarily in AWS • Operations teams work mainly in the AWS Console • AWS-native automation is part of the incident workflow • Minimize complexity with no added analytics layer | • AWS teams still need fast access to logs in the AWS Console • Customers want richer summarization and guided investigation • The environment spans multiple clouds • The operating model requires both speed in response and depth in analysis |
Conclusion
LoganAI elevates Oracle AI Database@AWS monitoring from query-and-scan drudgery to guided, AI-assisted observability. CloudWatch Logs Insights remains an important companion for AWS-native log collection and fast analysis. Together, they create a practical operating model: collect broadly, query quickly, explain intelligently, and remediate faster.
 Amit Mohanty is a Sr Partner Solutions Srchitect at AWS, specializing in designing and implementing Oracle database solutions for AWS customers and partners. He works with the AWS APO team, focusing on commercial database engines like Oracle and Oracle Applications. He enjoys working with customers to help design, deploy, migrate, and optimize relational database workloads on AWS.