1. Overview
Monitoring database workload and identifying performance bottlenecks are critical tasks for database administrators and developers. As application traffic grows, understanding how queries behave inside the database becomes increasingly important.
OCI Managed PostgreSQL provides Query Insights, a built-in observability feature that helps users analyze database workload, identify inefficient queries, and troubleshoot performance issues. Query Insights offers detailed visibility into query activity by presenting metrics such as Average Active Sessions, wait events, execution time, and query frequency.
Using these insights, users can quickly determine what queries are running, how long they take to execute, and what resources they are waiting on.
2. Objective
- Provide a clear understanding of OCI PostgreSQL Query Insights and its role in database performance monitoring.
- Help users learn how to analyze database workload and query behavior effectively using built-in metrics and visualizations.
- Enable administrators and developers to identify performance bottlenecks and inefficient queries quickly.
- Guide users in using Query Insights to troubleshoot issues and optimize database operations.
- Support proactive monitoring by helping users detect performance degradation and trends over time.
- Improve overall database efficiency by promoting data-driven tuning and performance optimization practices.
- Assist in maintaining a stable, scalable, and high-performing PostgreSQL environment on OCI.
3. Enabling Disabling Query Insights Feature in OCI PostgreSQL
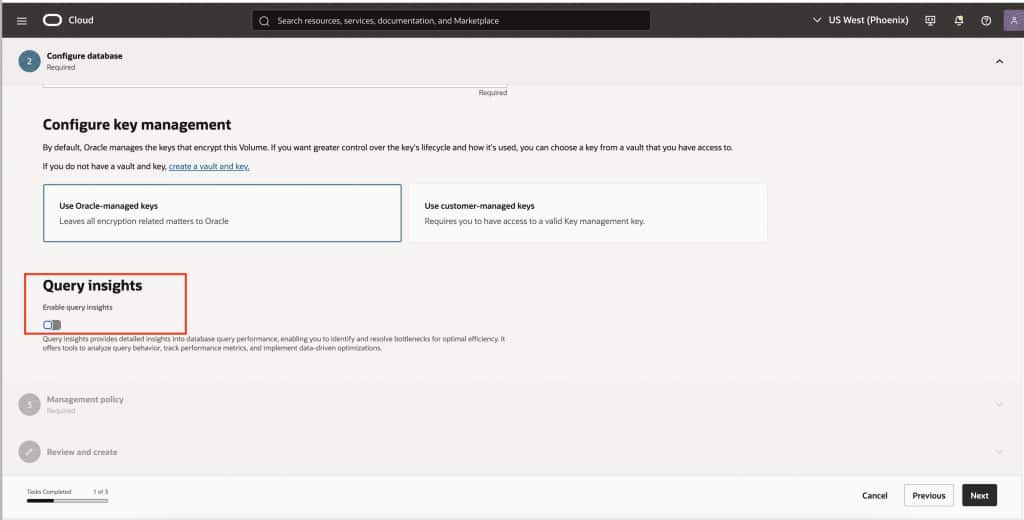
3.1.1. Enabling Query Insights for a Newly Provisioned DBSystem
You can enable or disable Query Insights in OCI PostgreSQL directly from the OCI Console. This option is useful during the provisioning of a new DBsystem, allowing you to configure performance monitoring from the start.
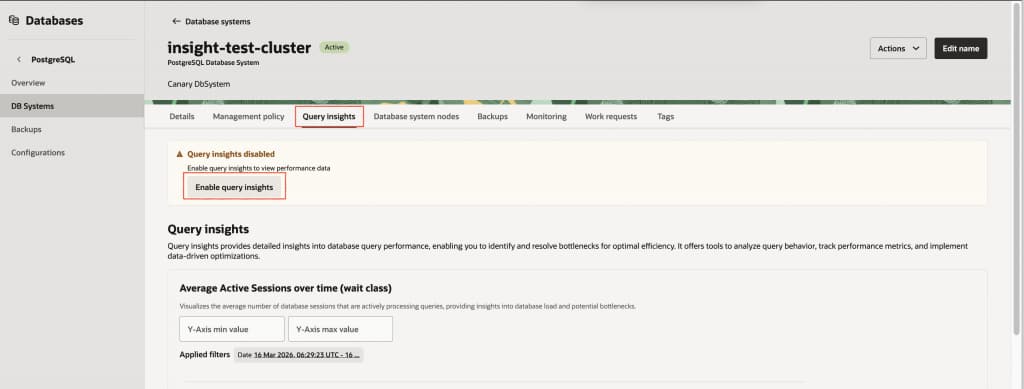
3.1.2. Enabling Query Insights for Existing DBSystem
You can enable Query Insights for an existing OCI PostgreSQL DB system from the OCI Console by modifying the database settings. This allows you to turn performance monitoring on or off based on current operational needs.
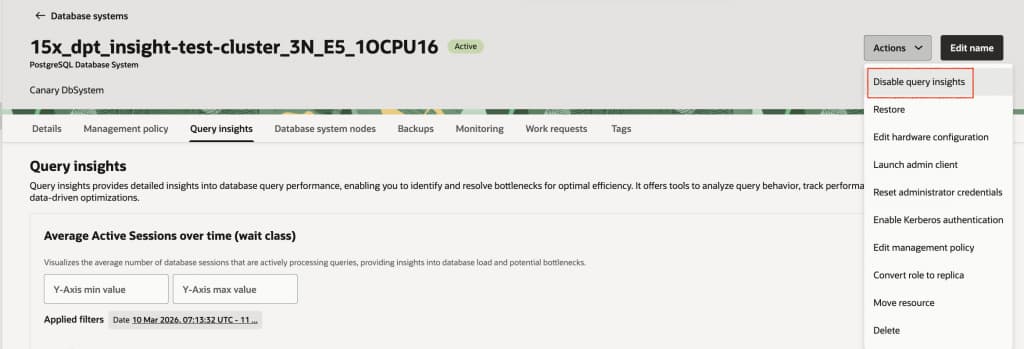
3.1.3. Disabling Query Insights for existing DBSystem
Disabling the Query Insights feature for existing DBSystem
4. Policy Required Query Insights
OCI PostgreSQL Query Insights access is controlled through IAM policies. Users with write or manage permissions on the DBsystem can directly view and use Query Insights.
For users with read-only access, an additional policy is required to enable access to Query Insights features.
POSTGRES_DB_SYSTEM_INSIGHTS_READ5. Query Insights Dashboard Overview
The Query Insights dashboard provides an interactive view of database workload and query behavior. It helps users understand how database resources are utilized over time and which queries contribute most to the overall load.
The dashboard primarily consists of two sections:
· Average Active Sessions over time (wait class)
· Top queries analysis
Together, these views allow administrators to quickly identify performance hotspots and investigate problematic queries.
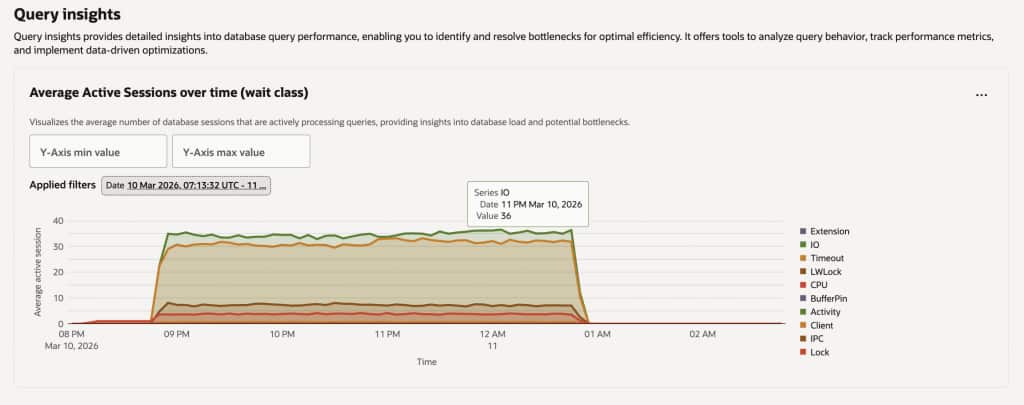
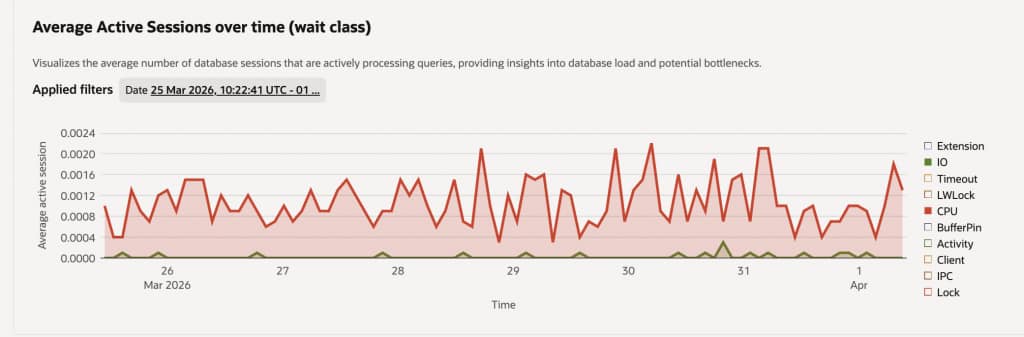
6. Average Active Sessions over time (wait class)
Average Active Sessions (AAS) is a key performance metric used to understand database workload intensity and resource pressure caused by queries.
AAS chart represents the number of database sessions that are actively running or waiting for resources during a given time period. The metric is commonly referred to as Average Active Sessions (AAS).
Average Active Sessions (AAS)Calculation
AAS is calculated using active session sampling, typically at a default interval of one second.
Each sampled active session contributes 1 unit at that instant.
AAS = Total active session time / Observation time(window time period)
If a query appears in 60 samples over 60 seconds, its AAS = 1.0.
Average Active Sessions help answer important questions such as:
- How busy is the database at a given time?
- Is the workload increasing or decreasing?
- What type of resource waits are contributing to database load?
The chart groups database activity into different wait classes, which indicate where time is being spent while executing queries.
Select a specific wait events to filter and focus on particular types of database activity. This helps isolate performance issues related to CPU, I/O, locks, or other resource waits.
Typical wait classes
- CPU – Queries actively consuming CPU resources for execution, typically involving computation, joins, or data processing.
- IO – Queries waiting for disk operations such as reading or writing data, often due to large scans or insufficient caching.
- Lock – Sessions blocked while waiting to acquire locks held by other transactions, usually caused by concurrent updates or long-running transactions.
- LWLock – Lightweight locks used internally by PostgreSQL to manage shared memory structures, indicating internal contention under high concurrency.
- Client – The database is waiting for the client to send the next request or receive results, commonly seen in application-driven workloads.
- IPC – Inter-process communication waits occurring when PostgreSQL processes coordinate with each other, often in parallel query execution.
- BufferPin – Waiting for access to a shared buffer that is currently pinned by another operation, typically seen during concurrent data access.
- Timeout – Time-based waits such as deliberate delays (e.g.,
pg_sleep) or configured timeout events. - Activity / Extension – Time spent in internal background processes or extension-related operations that support database functionality.
By observing the distribution of these wait classes over time, administrators can quickly determine the root cause of performance issues.
For example:
- A rise in IO waits may indicate large scans or heavy storage usage.
- Increased Lock waits can suggest transaction contention.
- High CPU usage may point to inefficient query execution.
The time-series visualization makes it easier to correlate database load with application activity or operational tasks.
7. Top Queries Analyzing
The Top Queries section in Query Insights provides a detailed breakdown of the queries contributing most to database load. This view helps identify both high-frequency queries and resource-intensive operations, enabling targeted performance tuning.
It presents query-level metrics in a tabular format, allowing users to quickly understand how each query impacts the system.
Filtering and Searching Queries : Query Insights provides flexible filtering capabilities to narrow down the analysis.
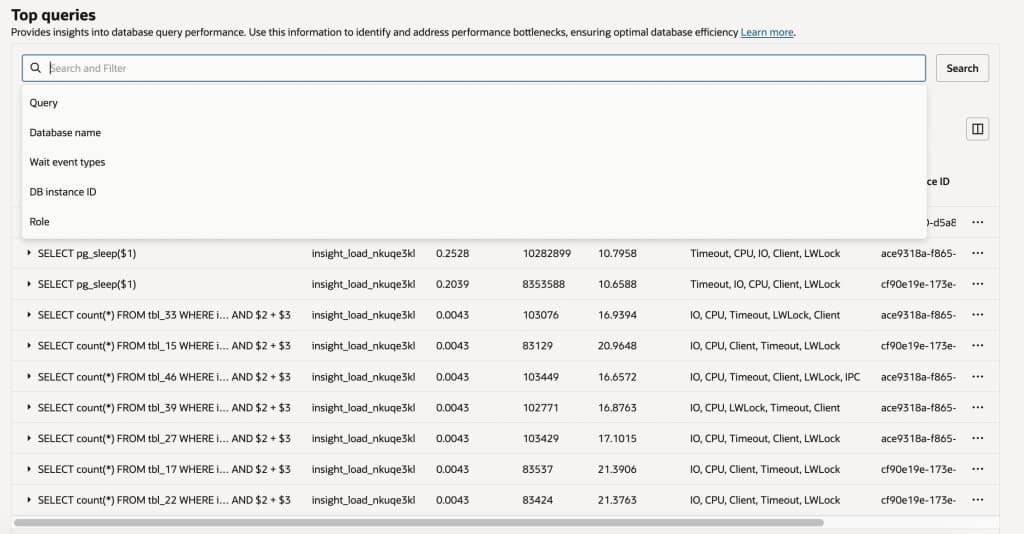
7.1.1. Search and Filter Options in Top Queries
Use the Search and Filter bar to efficiently narrow down query results based on specific criteria. This helps you quickly identify performance issues, analyze workload patterns, and focus on relevant queries. By applying filters such as query text, database name, wait events, and instance role, you can gain more precise and actionable insights into database activity.
- Query
Filters queries based on the SQL statement pattern or keywords, helping identify specific queries or workloads. - Database name
Narrows results to a particular database within the PostgreSQL instance for targeted analysis. - Wait event types
Filters queries by wait conditions (e.g., I/O, lock, CPU), useful for diagnosing performance bottlenecks. - DB instance ID
Selects a specific database instance to analyze query performance in multi-instance environments. - Role (Primary/Replica)
Differentiates queries running on the primary (write) node versus replica (read) nodes for workload distribution analysis.
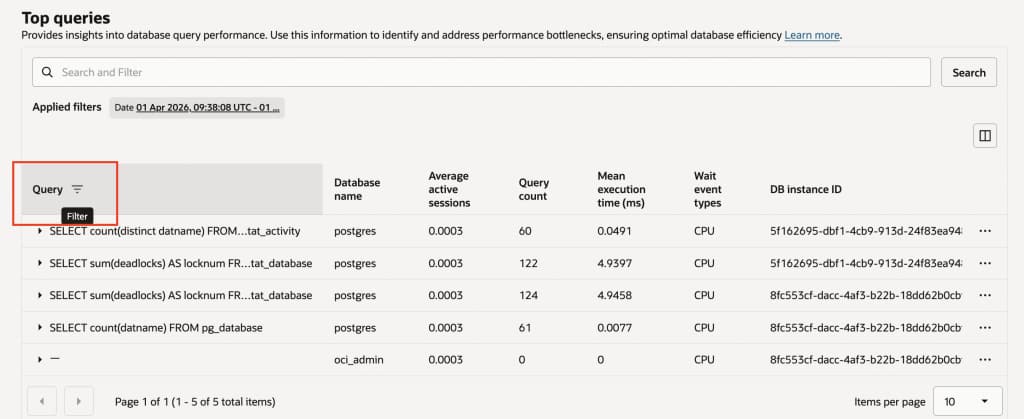
We can also apply filtering directly from the column headers(Query ,Database name,Wait event types,DB instance ID and Role) to quickly refine the displayed results. This allows you to focus on specific query metrics without using the main search bar.
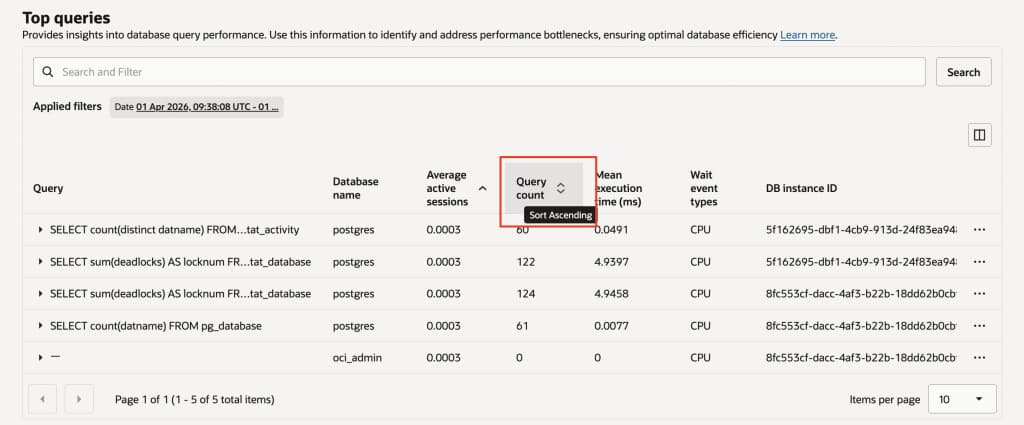
7.1.2. Sort Options in Top Queries :
Sorting allows you to organize query results to quickly identify performance patterns and bottlenecks. You can sort the data based on Average active sessions, Query Count and Mean Execution Time(ms) to analyze frequently executed queries and performance-impacting operations.
7.1.3. Drilling Down into Query Details :
Query Insights allows users to go beyond the aggregated Top Queries view and analyze individual queries in detail. By expanding a query from the Top Queries list, users can access deeper insights into how time is spent during its execution.
Wait Breakdown by Query :When a query is selected, Query Insights provides a visual breakdown of wait events associated with that query. This is typically displayed as a chart showing the proportion of time spent across different wait categories.Where is the query spending most of its execution time?query shows a distribution across wait types such as IO ,CPU , LWLock , Timeout , Client.
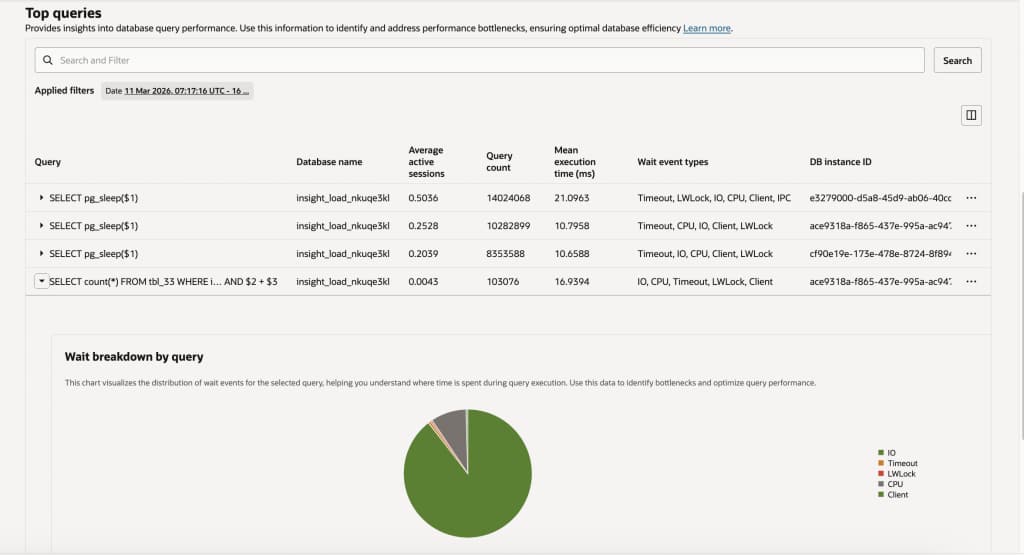
Additionally, wait event filtering allows you to focus on specific resource bottlenecks . This filtering capability is particularly useful when diagnosing specific types of performance issues.By analyzing these wait combinations, you can determine the root cause of performance issues.
Spike Analysis
If you are looking to investigate spikes in specific wait events, you can filter by the wait event type and sort the data by Average Active Sessions(AAS) in descending order. This helps identify the top queries contributing to that particular wait event.
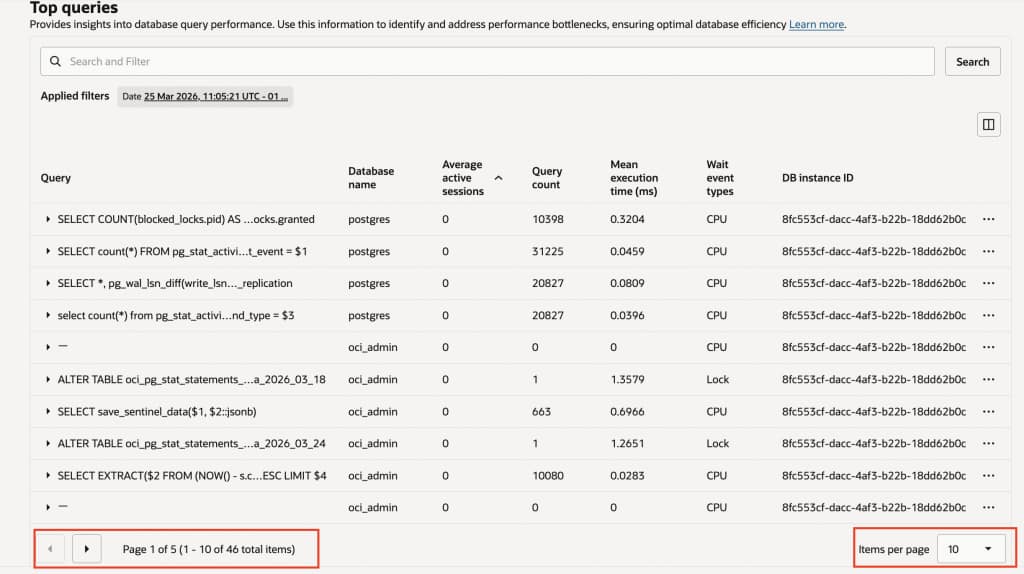
7.1.4. Pagination and Results Display
The pagination controls at the bottom allow you to navigate through multiple pages of query results. It shows the current page number along with the total number of items, helping you understand how much data is available.
The Items per page option lets you customize how many records are displayed on each page (e.g., 10, 25, 50). Adjusting this setting helps you balance between viewing more data at once and maintaining better readability and performance.
Typical metrics displayed include:
| Metric | Description |
| Query | SQL statement executed in the database |
| Database Name | Database where the query was executed |
| Average Active Sessions | AAS represents the average number of active database sessions during a given observation window. |
| Query Count | Total number of executions |
| Mean Execution Time | Average time taken by the query |
| Wait Event Types | Resource waits encountered during execution |
| DB Instance ID | Instance where the query executed |
| Role | Indicates whether the instance is Primary or Replica |
8. Understanding Query Workload with Practical Examples
The Query Insights dashboard can highlight different types of database activity depending on the workload being executed.
For example, during benchmarking or application testing, the dashboard may show queries such as:
Investigating Performance Issues
When database performance issues occur, Query Insights can help narrow down the root cause.A typical investigation workflow may include:
- Observe the database load graph to identify spikes in activity.
- Check the wait classes to understand whether the workload is CPU, IO, or lock bound.
- Identify the top queries contributing to the load.
- Analyze query execution time and frequency to determine optimization opportunities.
Once problematic queries are identified, administrators can further analyze them using PostgreSQL tools such as:
- Query execution plans
- Index analysis
- Query rewriting
For example, a query execution plan can be analyzed using:
EXPLAIN ANALYZE <query>;9. Best Practices for Using Query Insights
To effectively monitor and optimize database performance using Query Insights, consider the following best practices:
- Monitor Average Active Sessions (AAS) regularly to understand workload patterns and detect unusual spikes in activity.
- Investigate queries with high execution time or high load contribution, as they often have the greatest impact on overall performance.
- Pay close attention to wait event types, since they help identify underlying bottlenecks such as CPU pressure, I/O delays, or lock contention.
- Correlate database activity with application traffic, deployments, or scheduled jobs to better understand the root cause of performance changes.
- Optimize frequently executed queries using proper indexing, query tuning, and execution plan analysis to improve efficiency.
- Review trends over time instead of isolated snapshots to gain a more accurate view of system behavior.
Consistent and proactive monitoring enables administrators to detect performance degradation early, troubleshoot issues faster, and take corrective actions before they impact application performance and user experience.
OCI PostgreSQL Best Practices
Please refer to the document mentioned in the blog for detailed guidance on OCI PostgreSQL best practices, troubleshooting, and monitoring.The blog provides an overview, while the referenced document covers the topics in greater depth for practical implementation.
OCI PostgreSQL Best Practices for Database
OCI PostgreSQL Resource Monitoring & Troubleshooting
10. Conclusion
Query Insights in OCI PostgreSQL provides a powerful and intuitive way to observe database workload and understand query behavior . By combining database load visualization with detailed query-level metrics, it enables administrators to quickly detect performance issues and take targeted optimization actions.
With clear visibility into active sessions, wait events, and top queries, users can efficiently diagnose bottlenecks, analyze resource utilization, and improve query performance. It also helps in identifying trends over time, allowing proactive tuning and better capacity planning. Overall, Query Insights is an essential tool for maintaining a stable, efficient, and high-performing database environment.
11. FAQ: Query Insights
1. What happens when the Query Insights feature is disabled OR re-enabled?
When an active Query Insights feature make it disabled, data collection stops immediately and all existing Query Insights data is removed. Once the feature is re-enabled, data collection resumes from that point onward. Historical data from the period when the feature was disabled is not retained.
2. How long is Query Insights data retained?
Query Insights retains performance and query analysis data for a maximum of seven days . Data older than seven days is not preserved as per the current feature architecture.
3. Where is Query Insights data stored?
As per the current architecture, Query Insights data is stored within the same DBsystem, specifically under the oci_admindatabase.
4.Is Query Insights chargeable?
No, Query Insights does not incur any additional charges. It is included as part of the OCI PostgreSQL service and is available without any extra cost.
Additional Resources