
1.1. Overview
OCI PostgreSQL exposes a comprehensive set of metrics through the OCI Monitoring service under the oci_postgresql namespace. These metrics are available directly in the OCI PostgreSQL Console under Monitoring → Metrics, providing easy access for visualization and analysis.
They provide visibility into key aspects such as database performance, storage utilization, connection behavior, and replication status. These metrics are automatically collected and can be viewed in dashboards, queried using MQL, or used to configure alarms. This enables consistent monitoring and integration with OCI observability workflows.
Metrics are automatically collected and can be:
- Visualized in dashboards
- Queried using MQL (Monitoring Query Language)
- Used to configure alarms and notifications
Supported Dimensions
All metrics support the following dimensions
resourceTyperesourceNameresourceIddbInstanceRoledbInstanceId
These dimensions enable filtering and aggregation at instance, role (primary/replica), and resource levels.
1.2. Metrics Chart
OCI PostgreSQL metrics are available for both Primary and Replica instances, enabling monitoring across DBSystem instance node.
- Filter metrics by instance role (Primary/Replica)
- Compare performance across nodes
- Analyze workload distribution
1.3. Metrics Description by Category
Metrics are organized into categories to provide a structured view of database behavior across compute, storage, sessions, and replication. This grouping helps in easily navigating and understanding related metrics within the OCI Monitoring dashboard.
🧩 Resource Utilization Metrics
1.3.1. 🔹 CPU Utilization
- Represents CPU usage relative to allocated compute capacity. Reflects how database workloads utilize available processing resources over time.
- Helps in understanding overall compute consumption patterns. Useful for observing how efficiently CPU resources are being used.
X-axis: DateTime
Y-axis: Percentage (%)
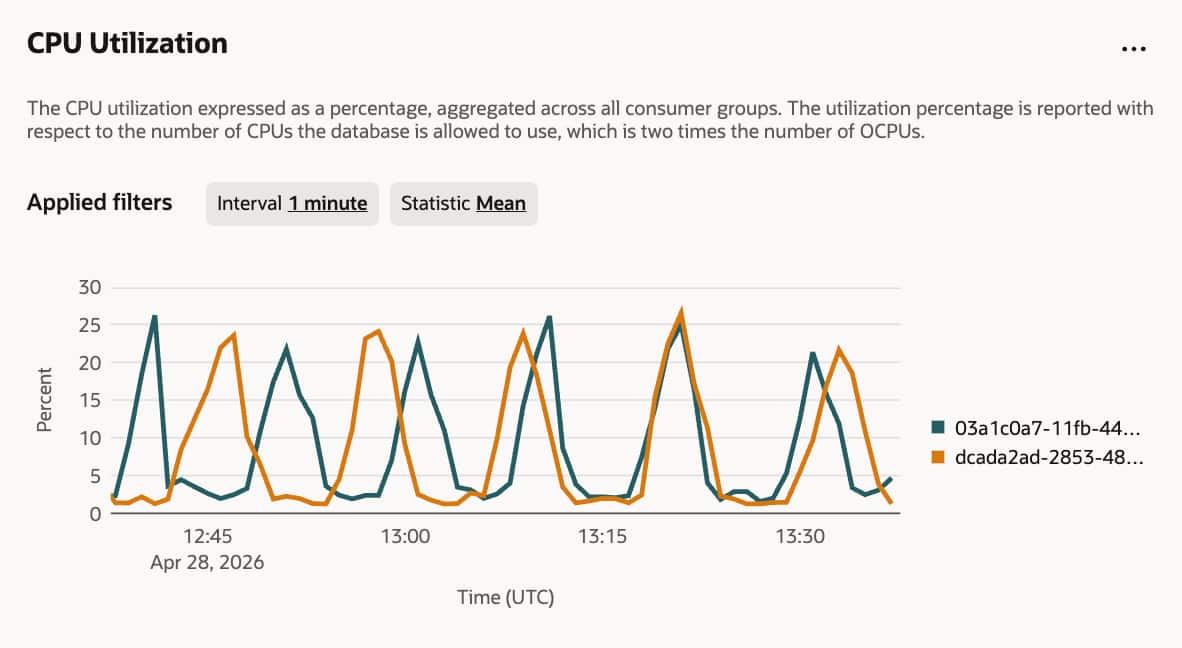
Example: CPU utilization indicates usage of available CPU resources.
1.3.2. 🔹 Memory Utilization
- Indicates the percentage of total memory currently in use. Includes memory consumed by database processes, buffers, and operations.
- Helps track memory consumption behavior. Provides visibility into how memory resources are being utilized.
X-axis: DateTime
Y-axis: Percentage (%)
Example: Memory utilization shows most of the allocated memory is in use.
OCI Memory Management
OCI PostgreSQL pre-allocates approximately 50% of total memory for the page cache and 25% for
shared_buffersAs a result, around 75% of total memory is allocated by default, and observing approximately 80% memory utilization immediately after provisioning is normal behaviour across all shapes.
1.4. 🧩 Connection & Session Metrics
1.4.1. 🔹 DB Connections
- Represents the total number of active client connections. Includes all sessions established by applications or external users.
- Helps monitor connection load on the database. Provides insight into concurrent access patterns.
X-axis: DateTime
Y-axis: Count
Example: 150 connections indicate 150 clients connected simultaneously.
1.4.2. 🔹 Active Sessions
- Shows the number of sessions currently executing queries. These sessions represent active database workload.
- Helps understand concurrency and workload intensity. Indicates how many operations are running at a given time.
X-axis: DateTime
Y-axis: Count
Example: 20 active sessions indicate 20 queries running at the same time.
1.4.3. 🔹 Idle Sessions
- Represents sessions that are connected but not executing queries. These sessions remain open without performing active work.
- Helps identify unused or idle connections. Useful for understanding connection utilization efficiency.
X-axis: DateTime
Y-axis: Count
Example: 40 idle sessions indicate many open but inactive connections.
1.4.4. 🔹 Idle In Transaction
- Represents sessions idle while holding open transactions. These sessions may still retain locks or database resources.
- Helps track transactional session behavior. Indicates sessions that are inactive but still holding resources.
X-axis: DateTime
Y-axis: Count
Example: 5 sessions idle in transaction indicate open transactions without activity.
1.5. 🧩 Storage Metrics
1.5.1. 🔹Used Storage
- Represents total storage consumed by database data and indexes. Includes all allocated and utilized storage components.
- Helps track storage usage over time. Provides visibility into database growth patterns.
X-axis: DateTime
Y-axis: Gigabytes (GB)
Example: 400 GB indicates total database storage usage.
1.5.2. 🔹WAL Storage
- Represents storage consumed by Write-Ahead Logs. Includes log data generated for durability and replication.
- Helps monitor WAL data accumulation. Provides insight into log storage utilization.
X-axis: DateTime
Y-axis: Gigabytes (GB)
Example: 30 GB WAL storage indicates accumulated log data.
1.6. 🧩 I/O & Throughput Metrics
1.6.1. 🔹Read IOPS
- Represents the number of read operations per second. Indicates how frequently data is accessed from storage.
- Helps observe read workload patterns. Useful for understanding data access frequency.
X-axis: DateTime
Y-axis: Count (operations/sec)
Example: 900 read IOPS indicates 900 read operations per second.
1.6.2. 🔹Write IOPS
- Represents the number of write operations per second. Indicates how frequently data is written to storage.
- Helps monitor write workload activity. Provides insight into data modification patterns.
X-axis: DateTime
Y-axis: Count (operations/sec)
Example: write IOPS indicates heavy write activity.
1.6.3. 🔹Read Latency
- Represents the time taken to complete read operations. Indicates responsiveness of the storage system for reads.
- Helps measure read performance characteristics. Useful for understanding data retrieval timing.
X-axis: Date Time
Y-axis: Milliseconds (ms)
Example: 1 ms read latency indicates quick data retrieval.
1.6.4. 🔹Write Latency
- Represents the time taken to complete write operations. Indicates responsiveness of the storage system for writes.
- Helps measure write performance characteristics. Provides visibility into write operation timing.
X-axis: Date Time
Y-axis: Milliseconds (ms)
Example: ms write latency indicates moderate write delay.
1.6.5. 🔹Average Read Latency
- Represents the average time taken for read operations. Provides an aggregated view of read latency over time.
- Helps observe overall read performance trends. Useful for analyzing average response behavior.
X-axis: Date Time
Y-axis: Milliseconds (ms)
Example: 1.5 ms average read latency shows typical read timing.
1.6.6. 🔹Read Kilobytes
- Represents the volume of data read per second. Indicates throughput of read operations in kilobytes.
- Helps analyze data access volume. Provides insight into read data patterns.
X-axis: Date Time
Y-axis: Kilobytes/sec (KB/s)
Example: 6000 KB/s indicates data read throughput.
1.6.7. 🔹Write Kilobytes
- Represents the volume of data written per second. Indicates throughput of write operations in kilobytes.
- Helps analyze data write volume. Provides insight into data modification patterns.
X-axis: Date Time
Y-axis: Kilobytes/sec (KB/s)
Example: 8000 KB/s indicates data write throughput.
1.7. 🧩 Cache & Efficiency Metrics
1.7.1. 🔹Buffer Cache Hit Ratio
- Represents the percentage of reads served from memory. Indicates how often data is retrieved from cache instead of disk.
- Helps evaluate cache efficiency. Provides visibility into memory versus disk usage behavior.
X-axis: Date Time
Y-axis: Percentage (%)
Example: 95% hit ratio indicates most data served from cache.
1.8. 🧩 Concurrency & Query Metrics
1.8.1. 🔹Deadlocks
- Represents the number of deadlock events between transactions. Occurs when transactions block each other indefinitely.
- Helps identify transactional conflicts. Provides visibility into concurrency issues.
X-axis: Date Time
Y-axis: Count
Example: deadlocks indicate transaction conflicts.
1.8.2. 🔹Number of Blocked Queries
- Represents queries waiting due to locks held by other sessions. Indicates blocking conditions in the database.
- Helps monitor query contention. Provides insight into locking behavior.
X-axis: DateTime
Y-axis: Count
Example: blocked queries indicate waiting operations.
1.8.3. 🔹Number of Long-running Queries (Over 5 Minutes)
- Represents queries running longer than five minutes. Indicates extended execution operations.
- Helps identify long-duration workloads. Provides visibility into query execution time.
X-axis:DateTime
Y-axis: Count
Example: long-running queries indicate prolonged operations.
1.9. 🧩 Replication Metrics
1.9.1. 🔹Replication Lag
- Represents lag between primary and replica in WAL data. Indicates how much data is pending to be applied on replica.
- Helps track replication synchronization. Provides visibility into replication status.
X-axis:DateTime
Y-axis: Megabytes (MB)
Example: 200 MB lag indicates delay in replication.
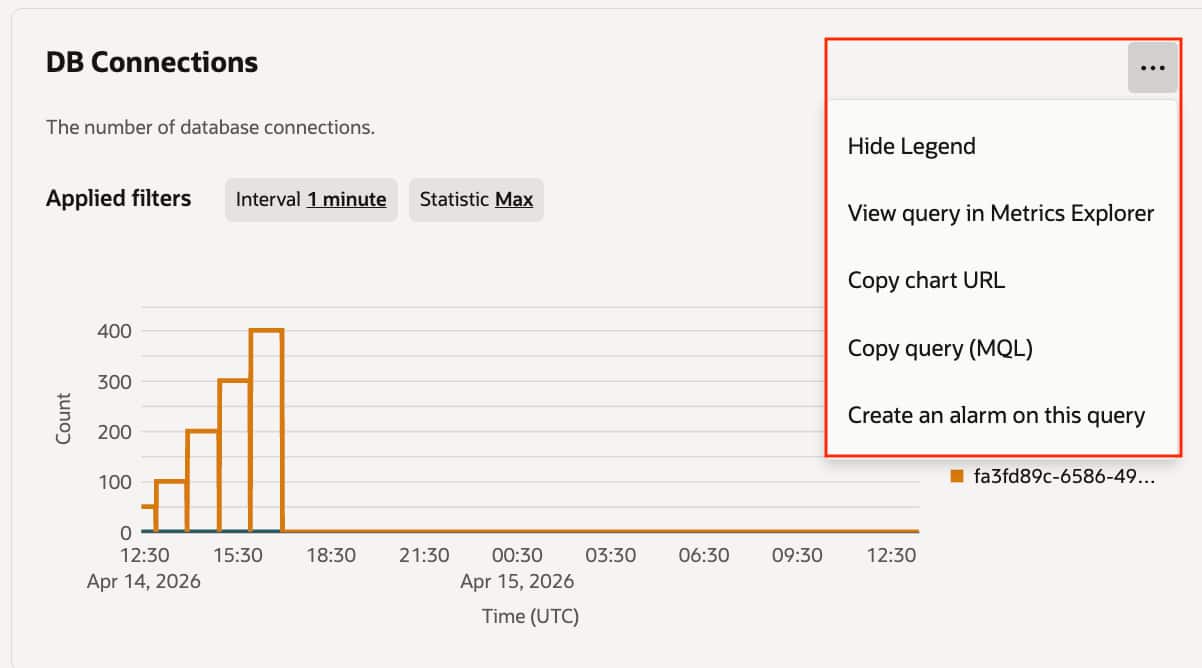
1.10. Metrics Options Menu (⋯)
The Metrics Options Menu (⋯) provides quick access to additional actions for each metric panel.
Key Capabilities:
- Explore advanced queries
- Share metric visualizations
- Create alarms directly
1.10.1. View Query in Metrics Explorer
Opens the selected metric in Metrics Explorer, providing a more advanced interface for analysis.
It allows you to refine queries, apply additional filters, change aggregations, and analyze trends using MQL (Monitoring Query Language).
1.10.2. Copy Chart URL
Generates a shareable URL for the current metric chart.
The link preserves the selected time range, filters, and visualization settings, making it easy to share insights with others.
1.10.3. Copy Query (MQL)
Copies the underlying Monitoring Query Language (MQL) expression used for the metric.
This query can be reused in Metrics Explorer, alarms, or automation workflows for consistent monitoring.
1.10.4. Create an Alarm on this Query
Allows you to quickly create an alarm using the current metric and query configuration.
The metric query is pre-filled, enabling faster setup of threshold-based alerts and integration with OCI Notifications.
1.11. Alarms & Notifications
OCI Monitoring enables you to create alarms based on PostgreSQL metrics by defining threshold conditions using MQL. When a metric breaches the defined condition, the alarm is triggered and sends notifications via configured channels such as email or webhooks.
Alarm Components:
- Metric query (MQL)
- Threshold condition
- Evaluation interval
- Trigger rule
You can follow the official OCI documentation to set up alarms here: Create an Alarm in OCI Monitoring
1.12. Notifications Integration
OCI Notifications service is used to deliver messages when alarms are triggered in OCI PostgreSQL Monitoring. You can create a notification topic and add subscriptions such as email, HTTPS/webhooks, or integrations like Slack and Message. Once configured, alarms can be linked to a topic to automatically notify subscribers when conditions are met. This enables seamless alerting and integration with external systems.
- Create a Topic
- Add subscriptions:
- HTTPS/Webhook
- External integrations
Notifications are triggered automatically when alarm conditions are met.
You can follow the official OCI documentation to set up notifications here: Notification setup
1.13. Third-Party Monitoring tool Integration
OCI PostgreSQL metrics can be integrated with third-party observability tools such as Datadog to enable centralized monitoring across multi-cloud or hybrid environments.
How it works:
- OCI Metrics → Connector Hub
- Connector → OCI Functions
- Functions → External tool (Datadog API)
For example, in Datadog integration, metrics from the oci_postgresql namespace are forwarded via Connector Hub to OCI Functions, which then send the data to Datadog using API-based ingestion. This setup enables real-time monitoring, dashboards, and alerting within Datadog
Tutorial for Datadog integration with OCI PostgreSQL: Tutorial OCI PostgreSQL using Datadog
1.14. Summary
OCI PostgreSQL metrics provide a comprehensive and structured monitoring framework for database environments. By leveraging built-in metrics, users can gain visibility into compute utilization, storage behavior, connection patterns, and replication status.
The integration with OCI Monitoring, alarms, and notifications enables proactive issue detection and automated alerting. Additionally, support for primary and replica monitoring, along with third-party integrations like Datadog, allows for flexible and scalable observability.
Overall, OCI PostgreSQL metrics help organizations maintain performance, reliability, and operational efficiency through a centralized monitoring approach.