Management and monitoring are the backbones of any IT infrastructure environment, without which no one can track the issues, changes, or updates done on the environment. Many tools and services are available in the market for this purpose, but deploying and integrating them in your cloud or on-premises environment can be a hectic task and requires effort and expertise to manage it. To reduce these efforts, Oracle Cloud Infrastructure (OCI) offers many tools under its Observability and Management Portfolio, including Stack Monitoring.
Stack Monitoring provides metrics for availability, CPU, Memory, disk activity, and paging of the Compute instances. It also allows virtual machine (VM) disk utilization monitoring and the tools to monitor file systems created on each disk attached with a Compute instance.
In this article, we discuss the OCI Stack Monitoring service and how it works, along with various services offered by OCI, to give you detailed insights into your environment and point you toward a step-by-step tutorial to learn how to manage disk utilization using Stack Monitoring.
Prerequisites
To deploy the solution, we need the following prerequisites:
-
Install the OCI command line interface (CLI) on the VM where you want to run the CLI commands or through Cloud Shell.
-
Ensure that OCI CLI Version is 3.18 or later.
-
Have adequate permissions to create and manage dynamic groups and policies.
About the services used in this solution
-
Stack Monitoring lets you proactively monitor an application and its underlying application stack, including application servers and databases. It starts by discovering all components of the application, including the application topology. After discovery, it automatically collects status, load, response, error, and utilization metrics for all application components.
-
The Management Agent allows a service plugin to collect data from the host where you install the Management agent. It can connect to OCI directly using the Management Agent cloud service. The Management agent is installed on a host, where it monitors and collects data from the sources that reside on hosts or virtual hosts.
-
The OCI CLI is a small-footprint tool that you can use on its own or with the Console to complete tasks. The CLI provides the same core functionality as the Console with more commands. Some of these commands, such as the ability to run scripts, extend the Console’s functionality. You can also check the CLI commands of various OCI services in the OCI CLI documentation.
-
Cloud Shell is a web browser-based terminal accessible from the Oracle Cloud Console. Cloud Shell is free to use within monthly tenancy limits and provides access to a Linux shell with a preauthenticated CLI, a preauthenticated Ansible installation, and many other useful tools.
Solution overview
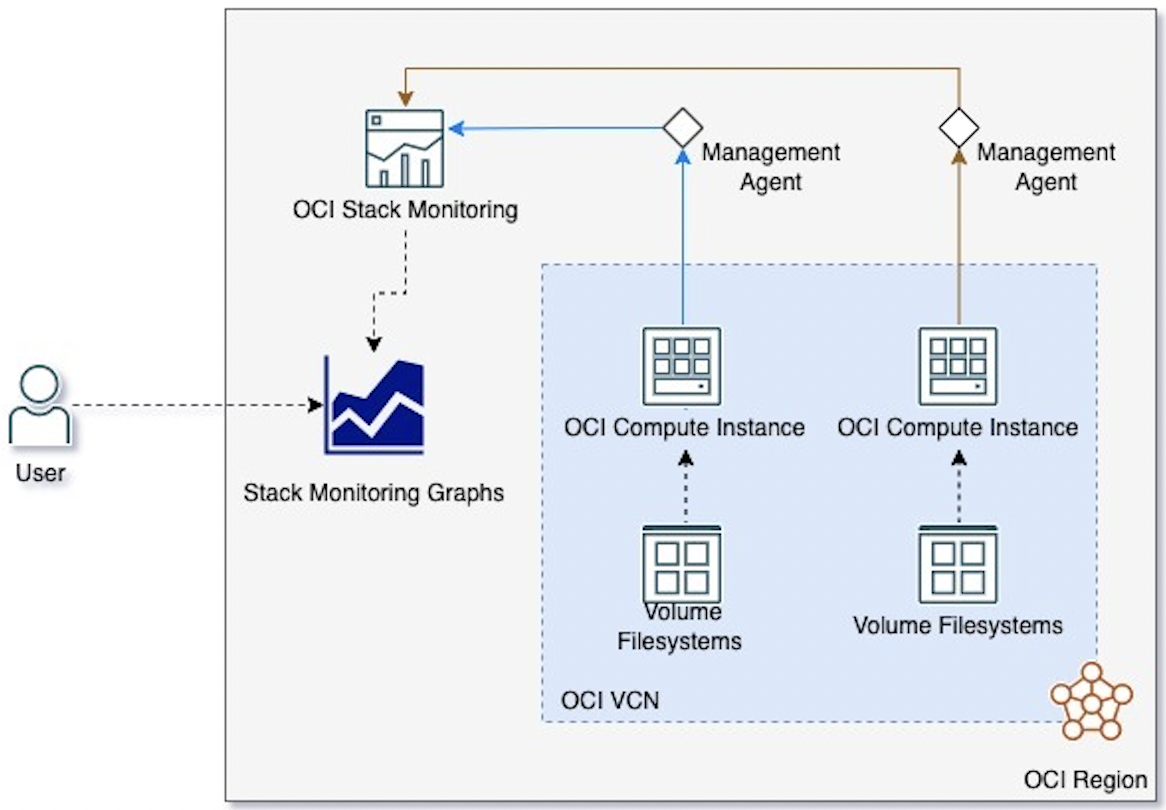
The solution revolves around the OCI Stack Monitoring service, which we use for monitoring Compute instance metrics. We also use OCI Management agents, which gather all the data from the VMs. For a detailed step-by-step on how to implement this solution on OCI, see our tutorial, Manage VM disk utilization using Stack Monitoring.
The metric data from any VM is collected by a dedicated management agent, which you can install on a VM with a single click on the dashboard. However, getting the agent in a running state after it has been enabled takes some time. The data from Management agents is then passed onto OCI Stack Monitoring, but first you need to run a discovery job to add any VM to be monitored using Stack Monitoring. The CLI command creates a discovery job to add the VM under Stack Monitoring. We discuss more about the following command in our tutorial:
oci stack-monitoring discovery-job create --compartment-id "your-compartment-id" --from-json file://
When the discovery job is completed, you can see the data being populated on the Stack Monitoring Service Summary page. You can further check the graphical data of all the VMs being monitored under OCI Stack Monitoring. One of the major use cases that you can use this solution for is monitoring the file systems of Compute instances, which we discuss in detail in our tutorial.
Conclusion
In this article, we discussed the solution of how you can use the OCI Stack Monitoring service to fetch data from Compute VMs through OCI Management agents. We also discussed various services involved in the solution and how they work with each other to provide you monitoring metrics for your OCI VMs. You can implement the solution in your tenancy by following the step-by-step tutorial.
If you’re new to Oracle Cloud Infrastructure, you can try out this solution for free using Oracle Cloud Free Tier, which provides US$300 free trial credits for a 30-day period. Free Tier also includes several Always Free services that are available for an unlimited time, even after your free credits expire.