Introduction
As applications become more distributed, understanding what happens inside a single user request becomes harder. A frontend call can trigger several services, database queries, cache lookups, retries, and downstream calls before a response reaches the user. When latency increases or errors appear, logs and metrics are useful, but they do not always show the full request path.
Distributed tracing fills this gap. It allows teams to follow a request across service boundaries and understand where time is spent, where failures occur, and which dependencies are involved.
In this blog, we look at a simple way to try CNCF Jaeger on Oracle Cloud Infrastructure (OCI). The solution runs Jaeger on a single OCI Compute virtual machine (VM), together with the Jaeger HotROD demo application.
Why Distributed Tracing Matters
Modern applications rarely fail in isolation. A request that looks slow from the browser might actually be waiting on a downstream service, a database call, a cache lookup, or an external dependency. Without tracing, teams often have to correlate logs manually across multiple components.
Jaeger helps make that request path visible. It shows each operation as a span, groups related spans into a trace, highlights errors, and makes it easier to see which services participated in a request. This is especially useful for microservices, event-driven applications, and any environment where one transaction crosses several components.
For teams starting with observability, Jaeger provides a practical entry point:
- It shows end-to-end request timelines.
- It helps identify latency hotspots.
- It highlights errors inside the trace path.
- It supports OpenTelemetry-based instrumentation.
- It provides service dependency visibility through the Jaeger UI.
A Lightweight Jaeger Environment on OCI
This solution uses a single OCI Compute VM to provide a compact Jaeger environment that is easy to deploy, inspect, and clean up.
The result is an environment that can be used for demos, workshops, or early experimentation with distributed tracing without introducing unnecessary infrastructure complexity.
The environment includes the Jaeger UI for trace exploration and OTLP endpoints for trace ingestion.
OCI already provides native observability services such as Monitoring, Logging, and Application Performance Monitoring. This Jaeger-based pattern complements those services by showing how teams can also run a CNCF-native tracing tool on OCI infrastructure, especially when they want open source tooling, OpenTelemetry alignment, or consistency with observability practices used across cloud native environments.
Using HotROD to Tell the Story
HotROD, short for Rides on Demand, is Jaeger’s sample ride-sharing application. It simulates a small distributed system with services such as frontend, customer, driver, route, MySQL, and Redis. When a user requests a ride, HotROD emits traces that show how the request moves through those components.
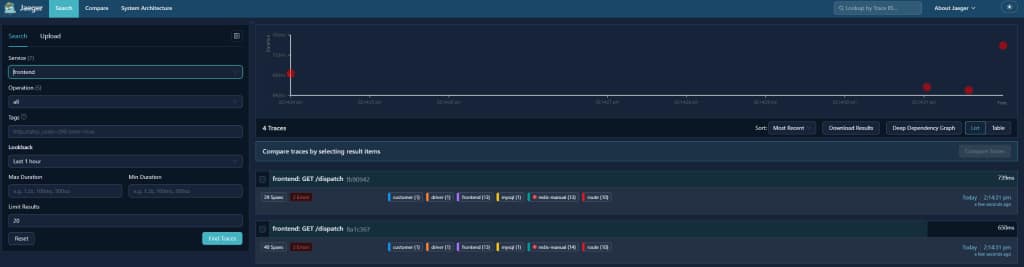
This makes HotROD useful for a demo because the Jaeger UI is not empty after deployment. Users can generate a few requests, search for the frontend service, and open a frontend: GET /dispatch trace. The trace view shows the full request timeline, including service spans, duration, and any errors.
Some HotROD traces intentionally include errors or slower spans. This is expected and helps demonstrate how distributed tracing can point users toward the dependency or operation that contributed to a failed or slow request.
Try It Yourself
The deployment automation is available in the Oracle DevRel automation repository. The repository contains the full deployment steps, configuration variables, and validation flow. Before using the solution in a shared environment, restrict access to trusted client networks and review the exposed endpoints.
Automation repository: jaeger-on-oci-sample
When to Use This Pattern
This pattern is useful when teams want to combine a CNCF-native observability tool with OCI infrastructure. Jaeger brings open source distributed tracing and OpenTelemetry alignment, while OCI provides the compute, networking, and operational foundation to run the environment consistently.
It is a good starting point for organizations that want to evaluate cloud native observability patterns on OCI, demonstrate distributed tracing concepts, or prepare for deeper integration with instrumented applications running on OCI services. For production environments, the same idea can evolve toward private networking, controlled ingress, persistent storage backends, and application instrumentation across the broader OCI estate.
Conclusion
Jaeger makes distributed systems easier to understand by showing how requests move across services and where latency or errors appear. With this solution on OCI, teams can see how CNCF-native tracing fits into an OCI-based observability strategy.
The result is intentionally simple: one OCI Compute VM, Docker, Jaeger, and HotROD. That simplicity makes it useful as a first step into distributed tracing and as a practical demo for showing why observability matters.