We’re excited to announce the launch of Oracle Cloud Infrastructure (OCI) Dashboards service. Dashboards are a critical component to running applications and workloads at scale in the cloud. Using OCI Dashboards, customers can derive insights, observe trends, and diagnose issues, all from a single location in the Oracle Cloud Console!
Powerful visualizations native to the cloud platform
OCI Dashboards provides a new way to visualize metrics, logging, billing, and other resource data in OCI. You can build beautiful, powerful visuals with a few clicks. You can use dashboards to personalize your Console by creating a single view of your cloud, directly from the home screen. Best of all, dashboards are natively integrated into OCI services and are always free, compared to costly third-party dashboard tools.
Dashboards come with a library of six widget types, and soon we’re adding more to make this experience even richer. The following core capabilities of dashboards are available today:
- Visualize metric data on a bar, line, and pie chart or as a table.
- Visualize logging data on a bar, line, donut, and pie chart or as a table.
- Visualize your billing cycle month and credits spent in the cycle.
- Visualize OCI resources as tiles.
- Create markdown widgets.
- Share dashboards with other users in your OCI tenancy.
- Collect a set of related dashboards in a Dashboard Group.
Collaborate with your teammates
You can create Dashboards for all your use cases, like infrastructure for DevOps, billing for FinanceOps, applications dashboards for software-as-a-service (SaaS) environments, and view them together in a single pane of glass. What make Dashboards truly powerful for the enterprise are the built-in collaboration capabilities. With Dashboard Groups, admins or users can create a set of default dashboards for the entire team so that when a new user comes in, they see a beautiful, informative view. Managing permissions and sharing capabilities is inherent to both Dashboard and Dashboard Groups because OCI classifies them as resources, meaning that they have OCIDs, adhere to Identity and Access Management (IAM) policies, and reside in OCI compartments. You can customize a default dashboard and save it for your own needs.
Use Dashboards at no cost
OCI Dashboards service is always free to use. When you visualize Monitoring or Logging data visualized using widgets, it counts toward the corresponding service usage. Oracle Cloud has a generous free tier allocation for both these services that you can benefit from every month. For pricing details and estimation, refer to the Monitoring and Logging overview pages.
Setting up your Dashboard
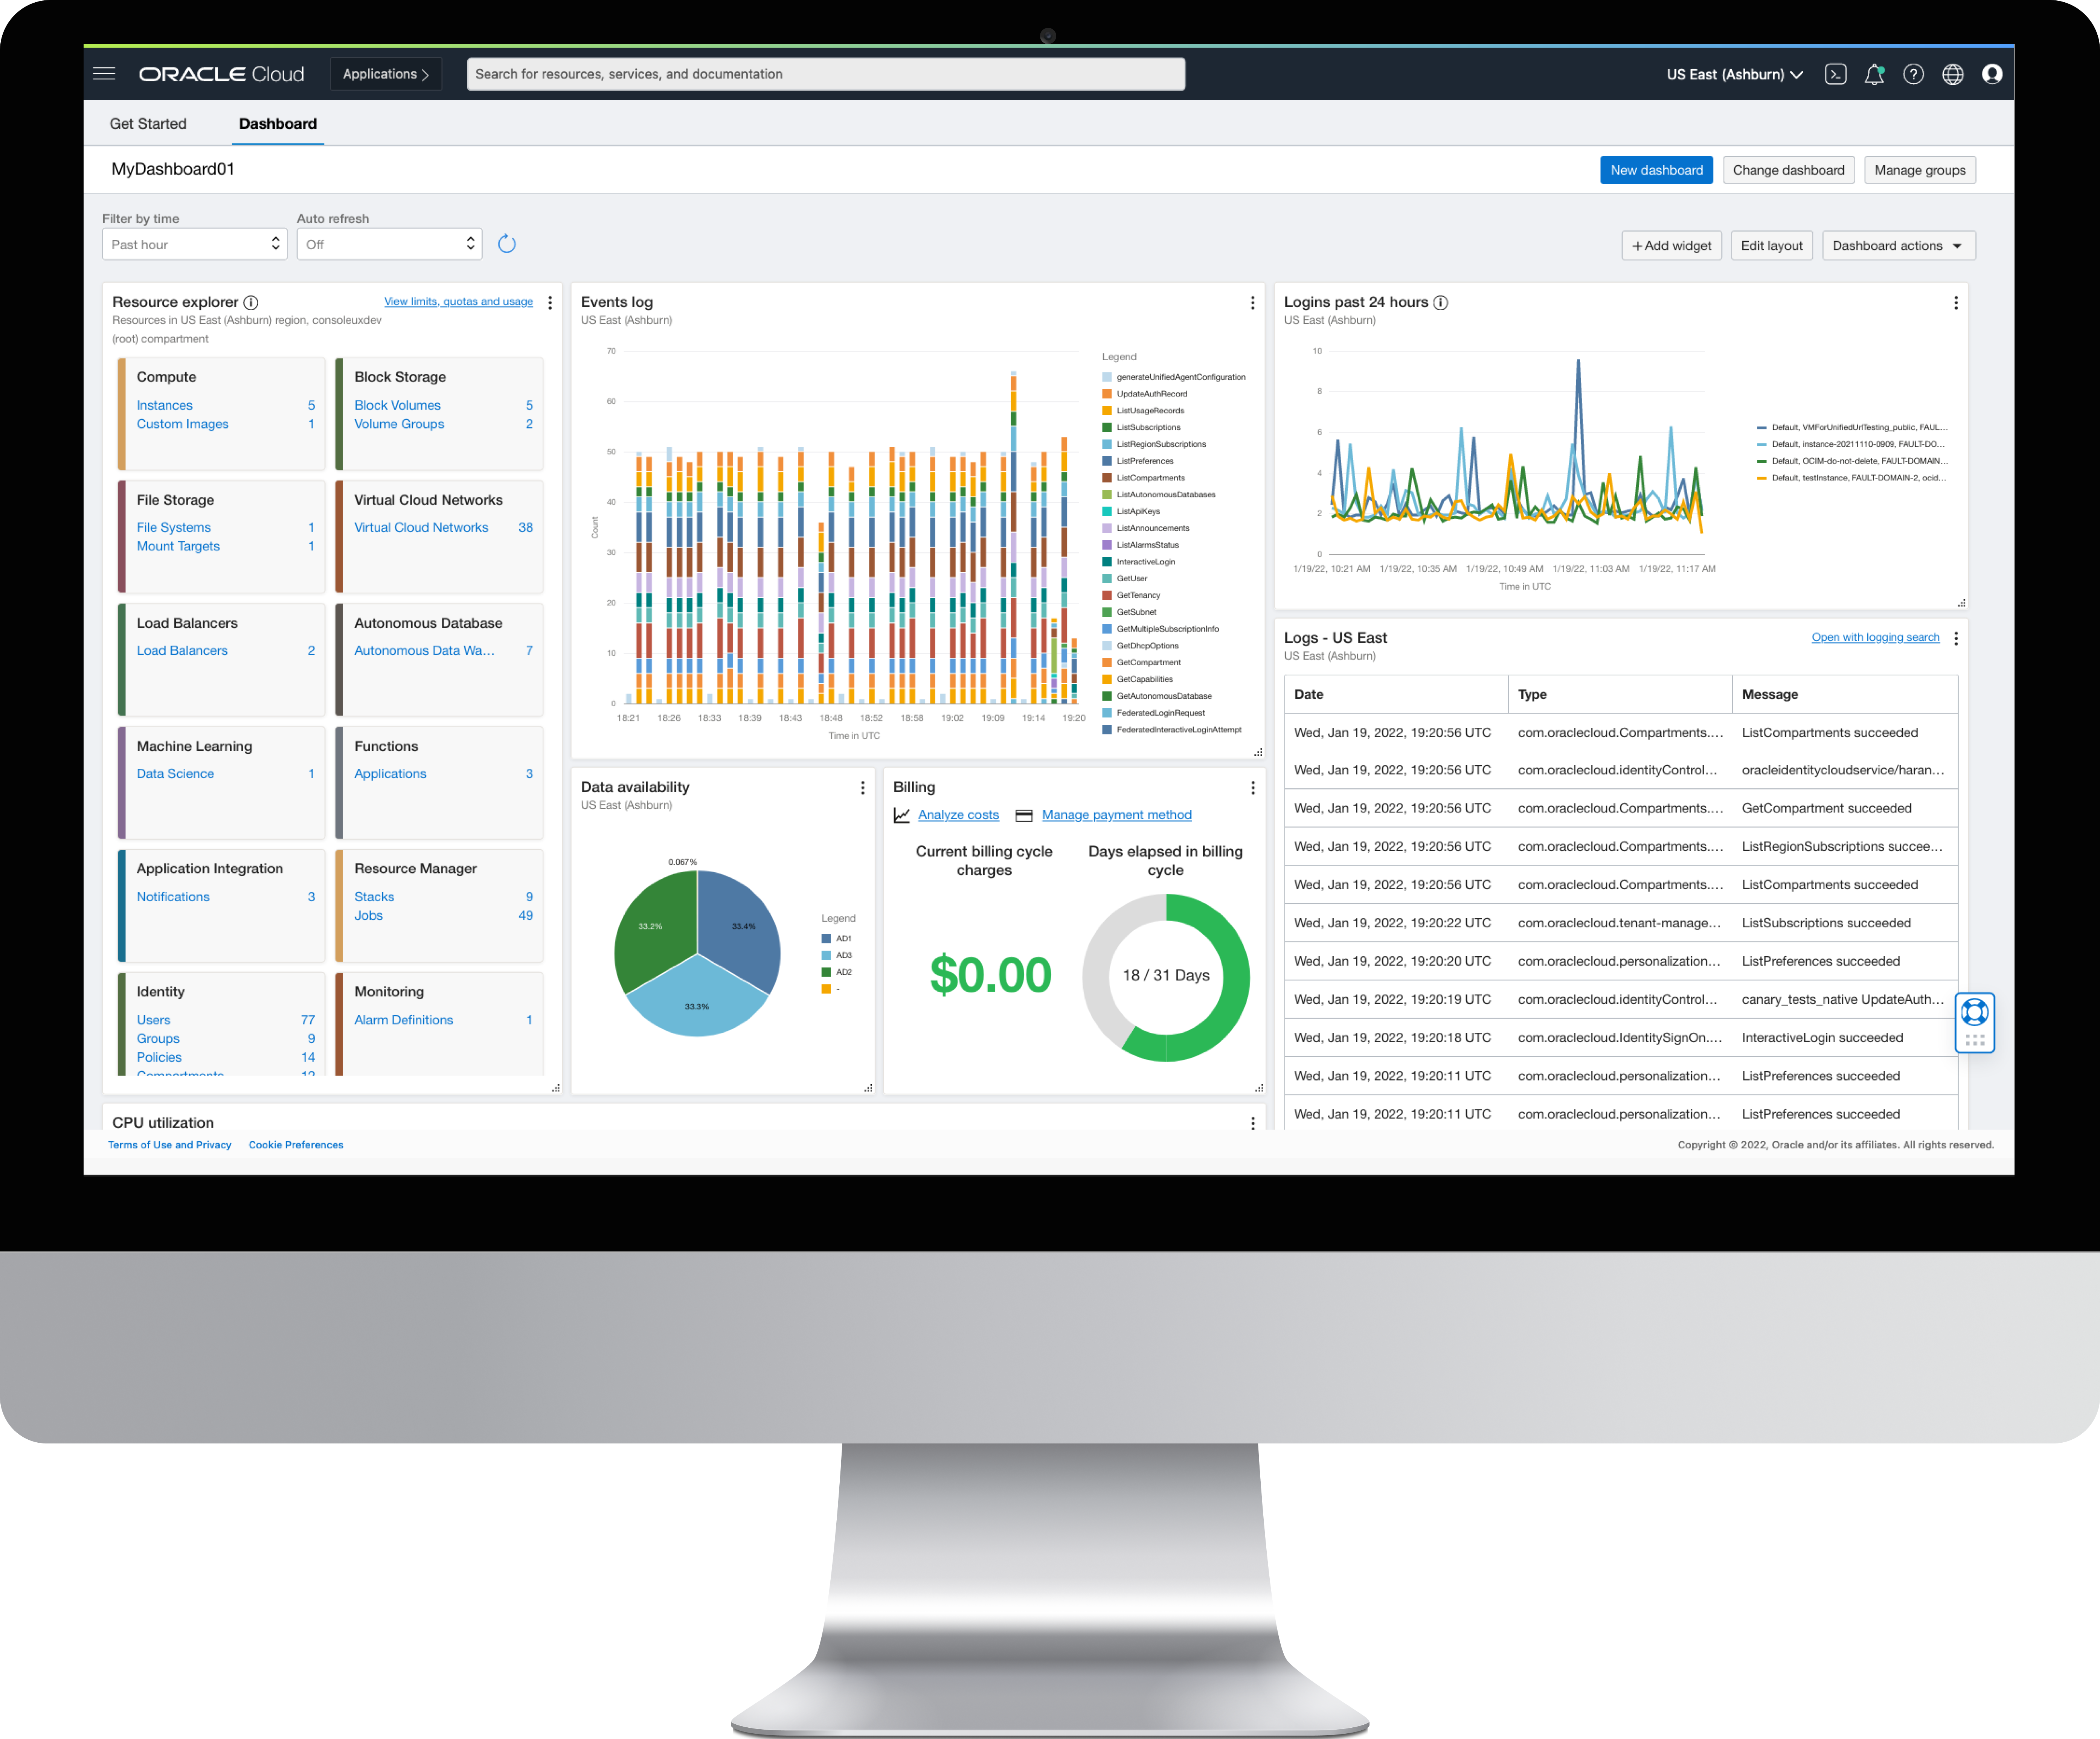
We designed Dashboards with ease of use and speed to experimentation in mind. From the home page in the Console, creating a Dashboard is easy.
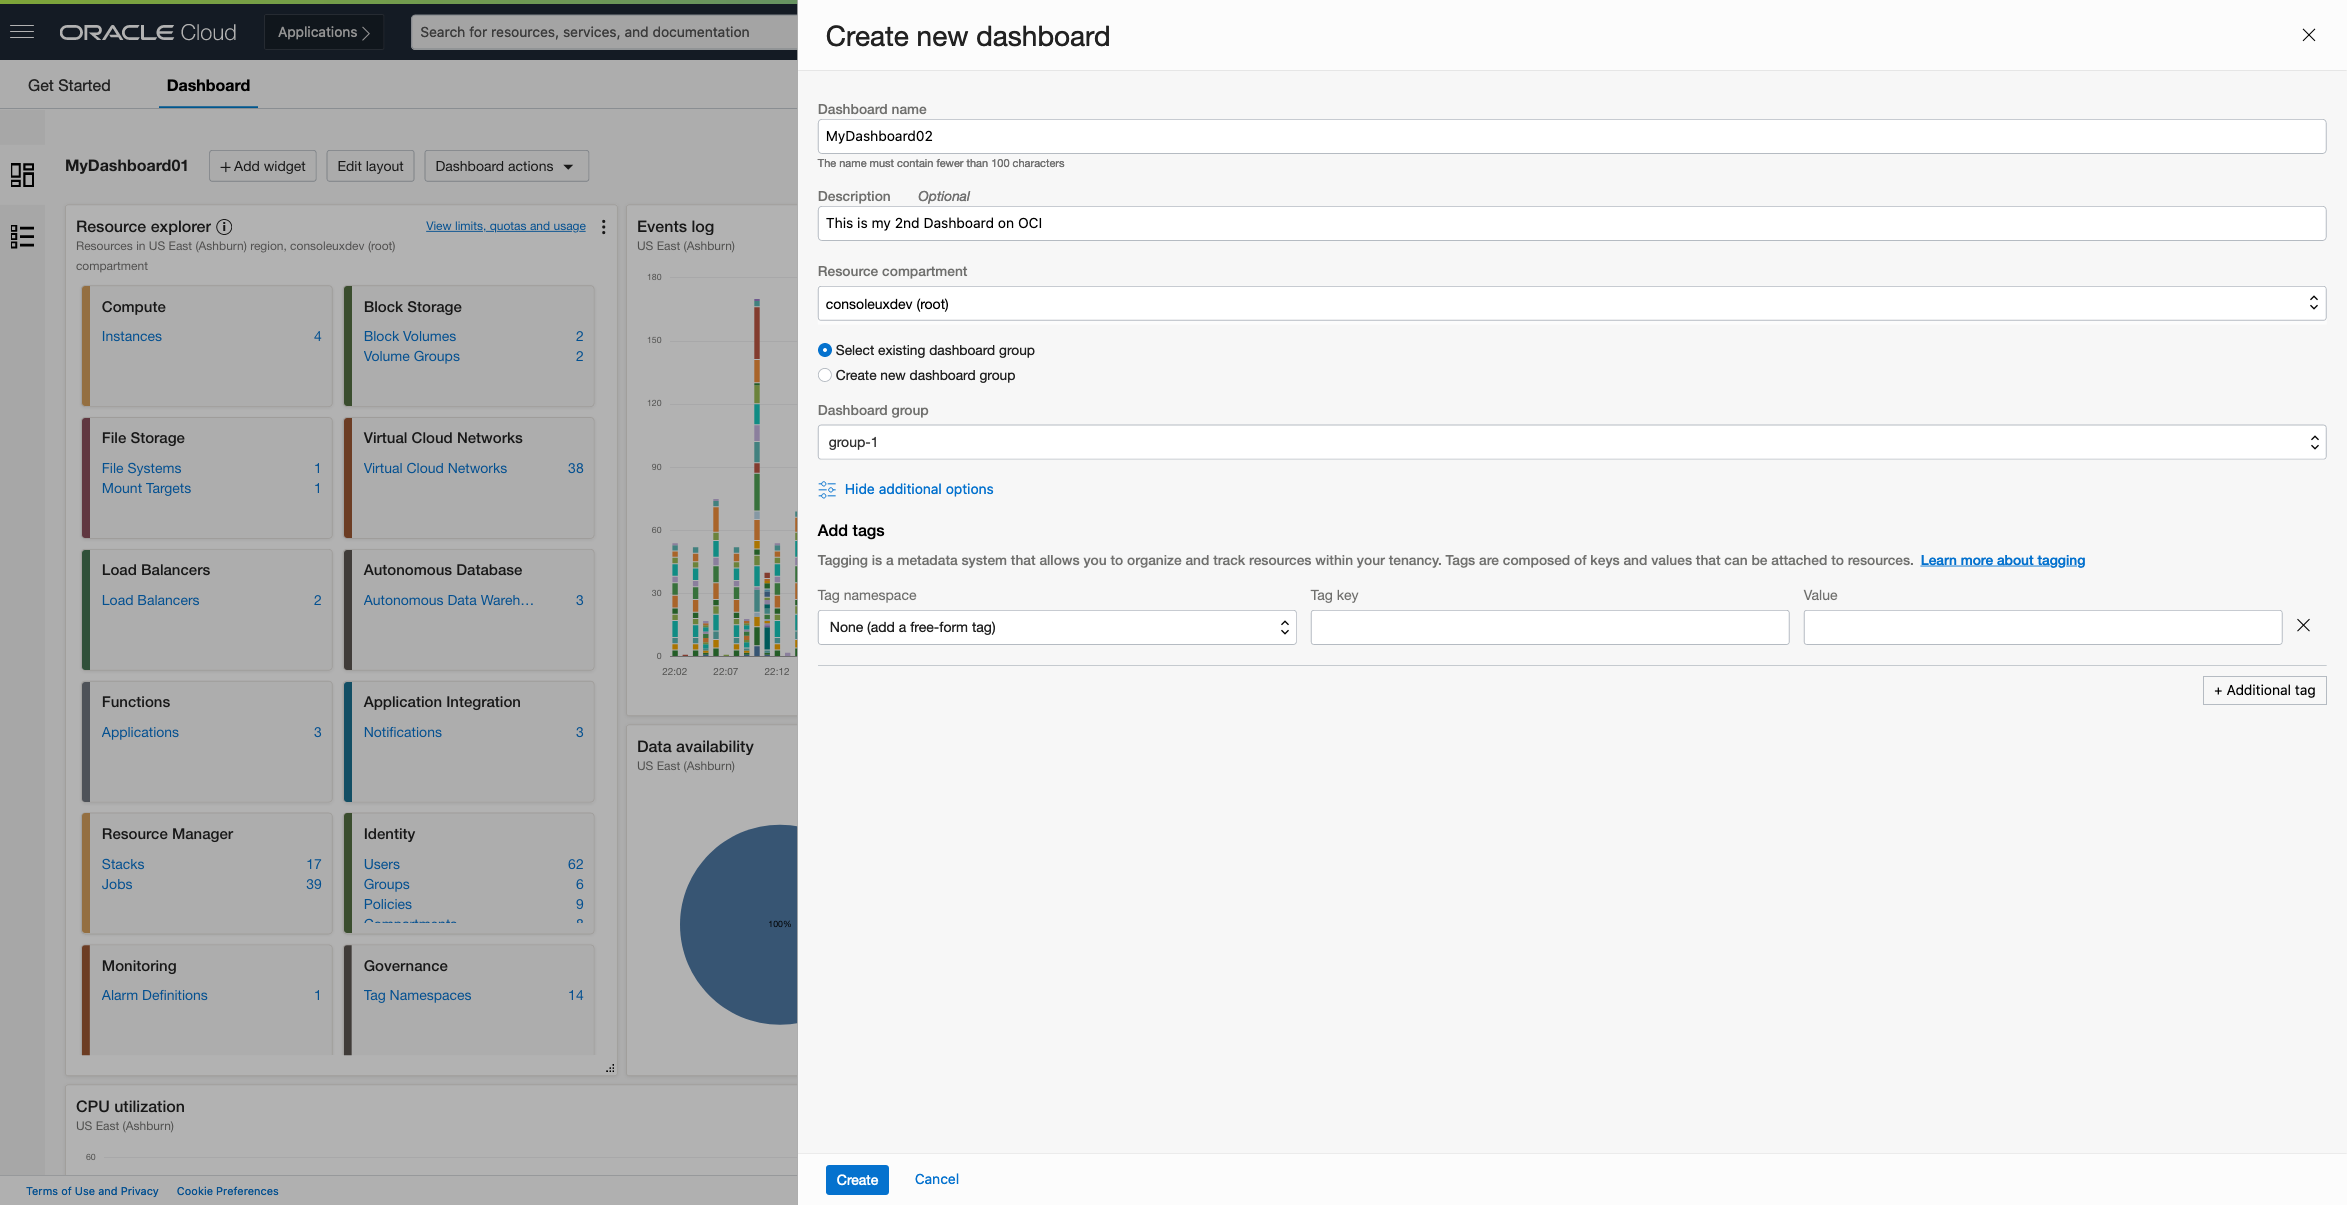
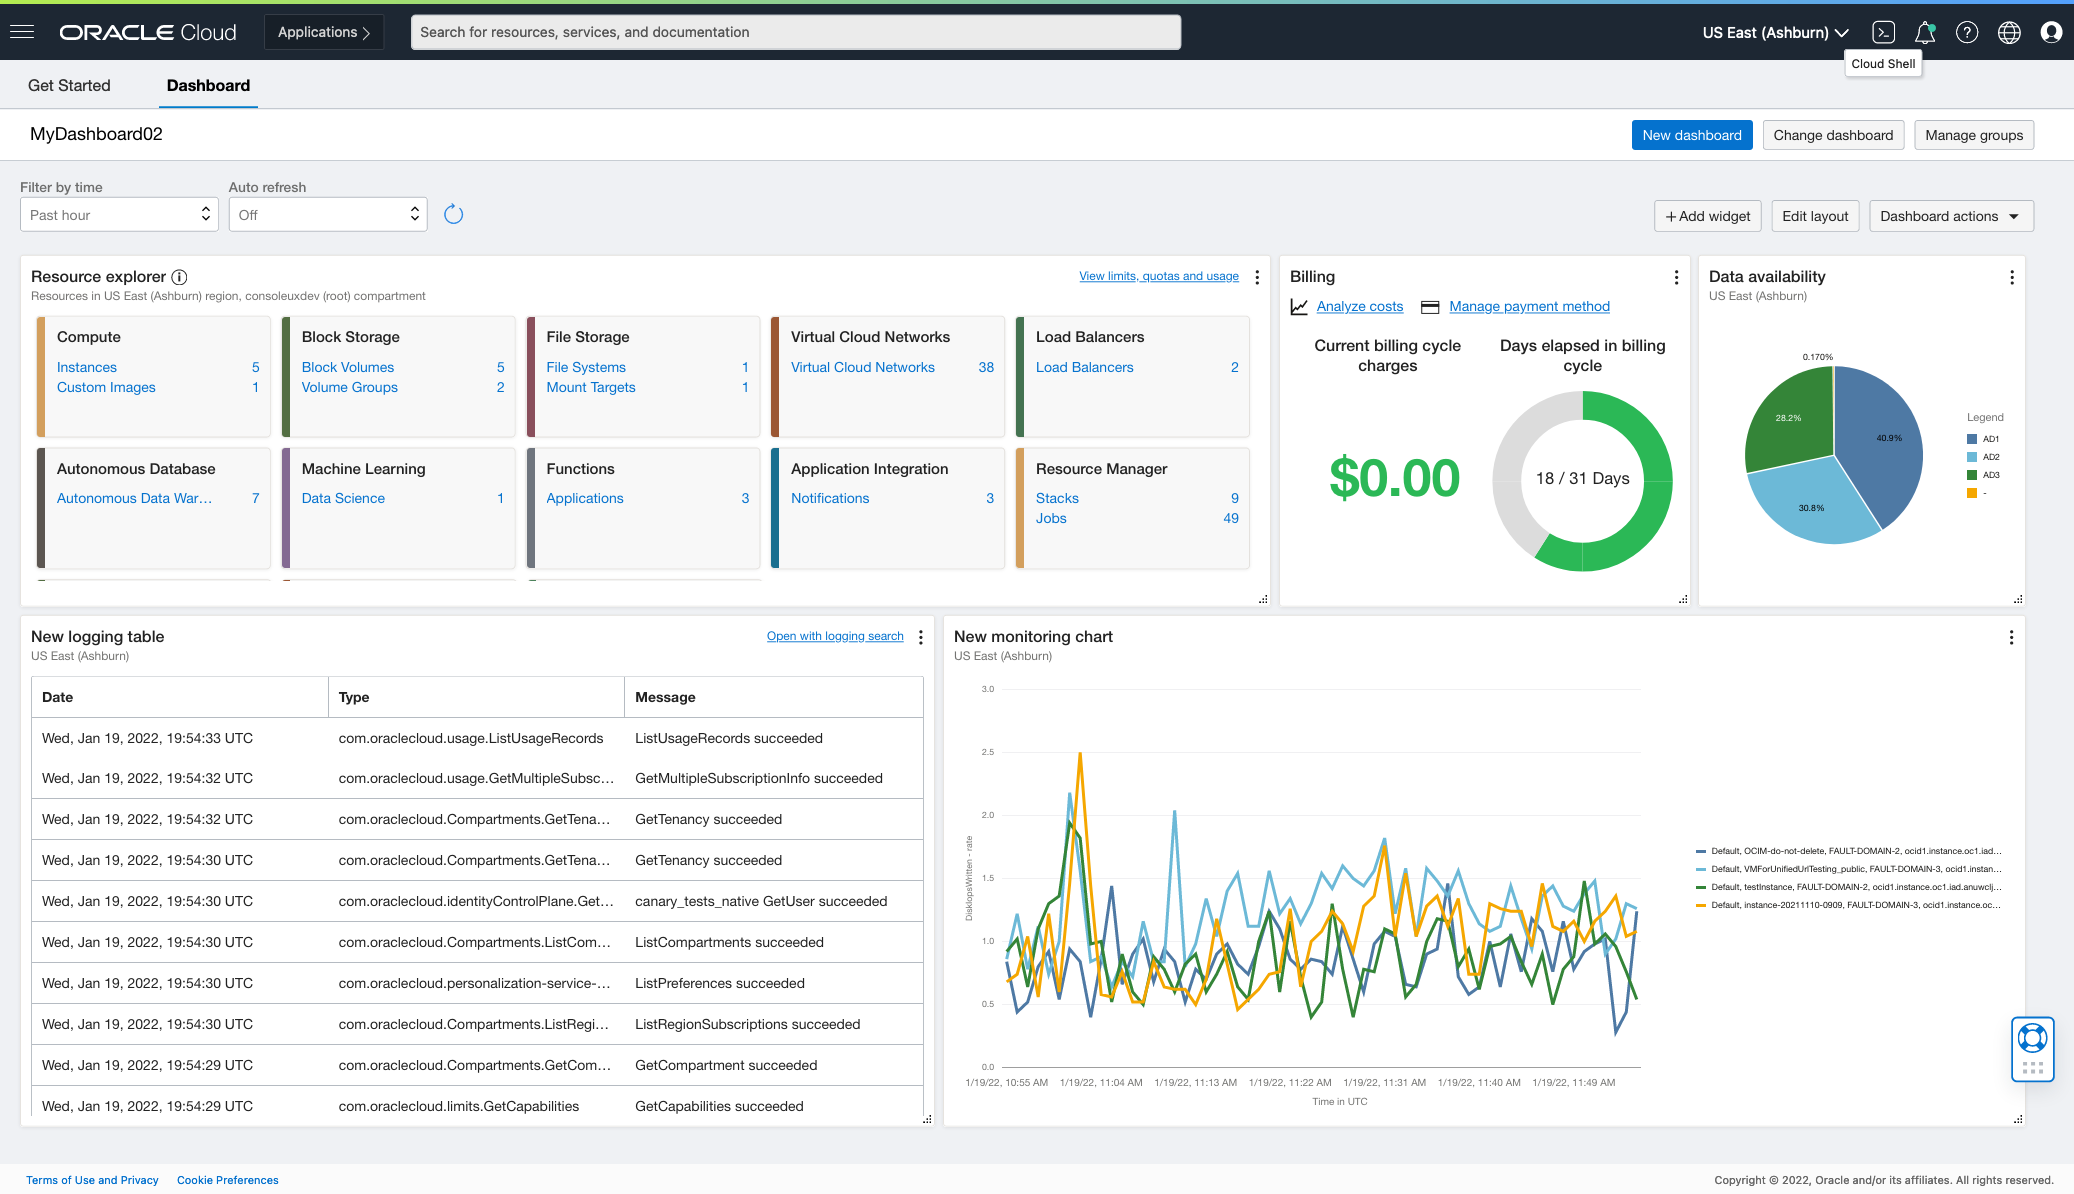
Next to the Getting Started tab on the home page, click Dashboard, which loads the dashboard that you were last working with. If it’s your first time here, you see a default dashboard. Here, we see a previously configured dashboard that has several widgets showing real-time data and resource information. To create a dashboard, click +New Dashboard. After entering a few details, the new dashboard is deployed, and we see a canvas ready to work on.
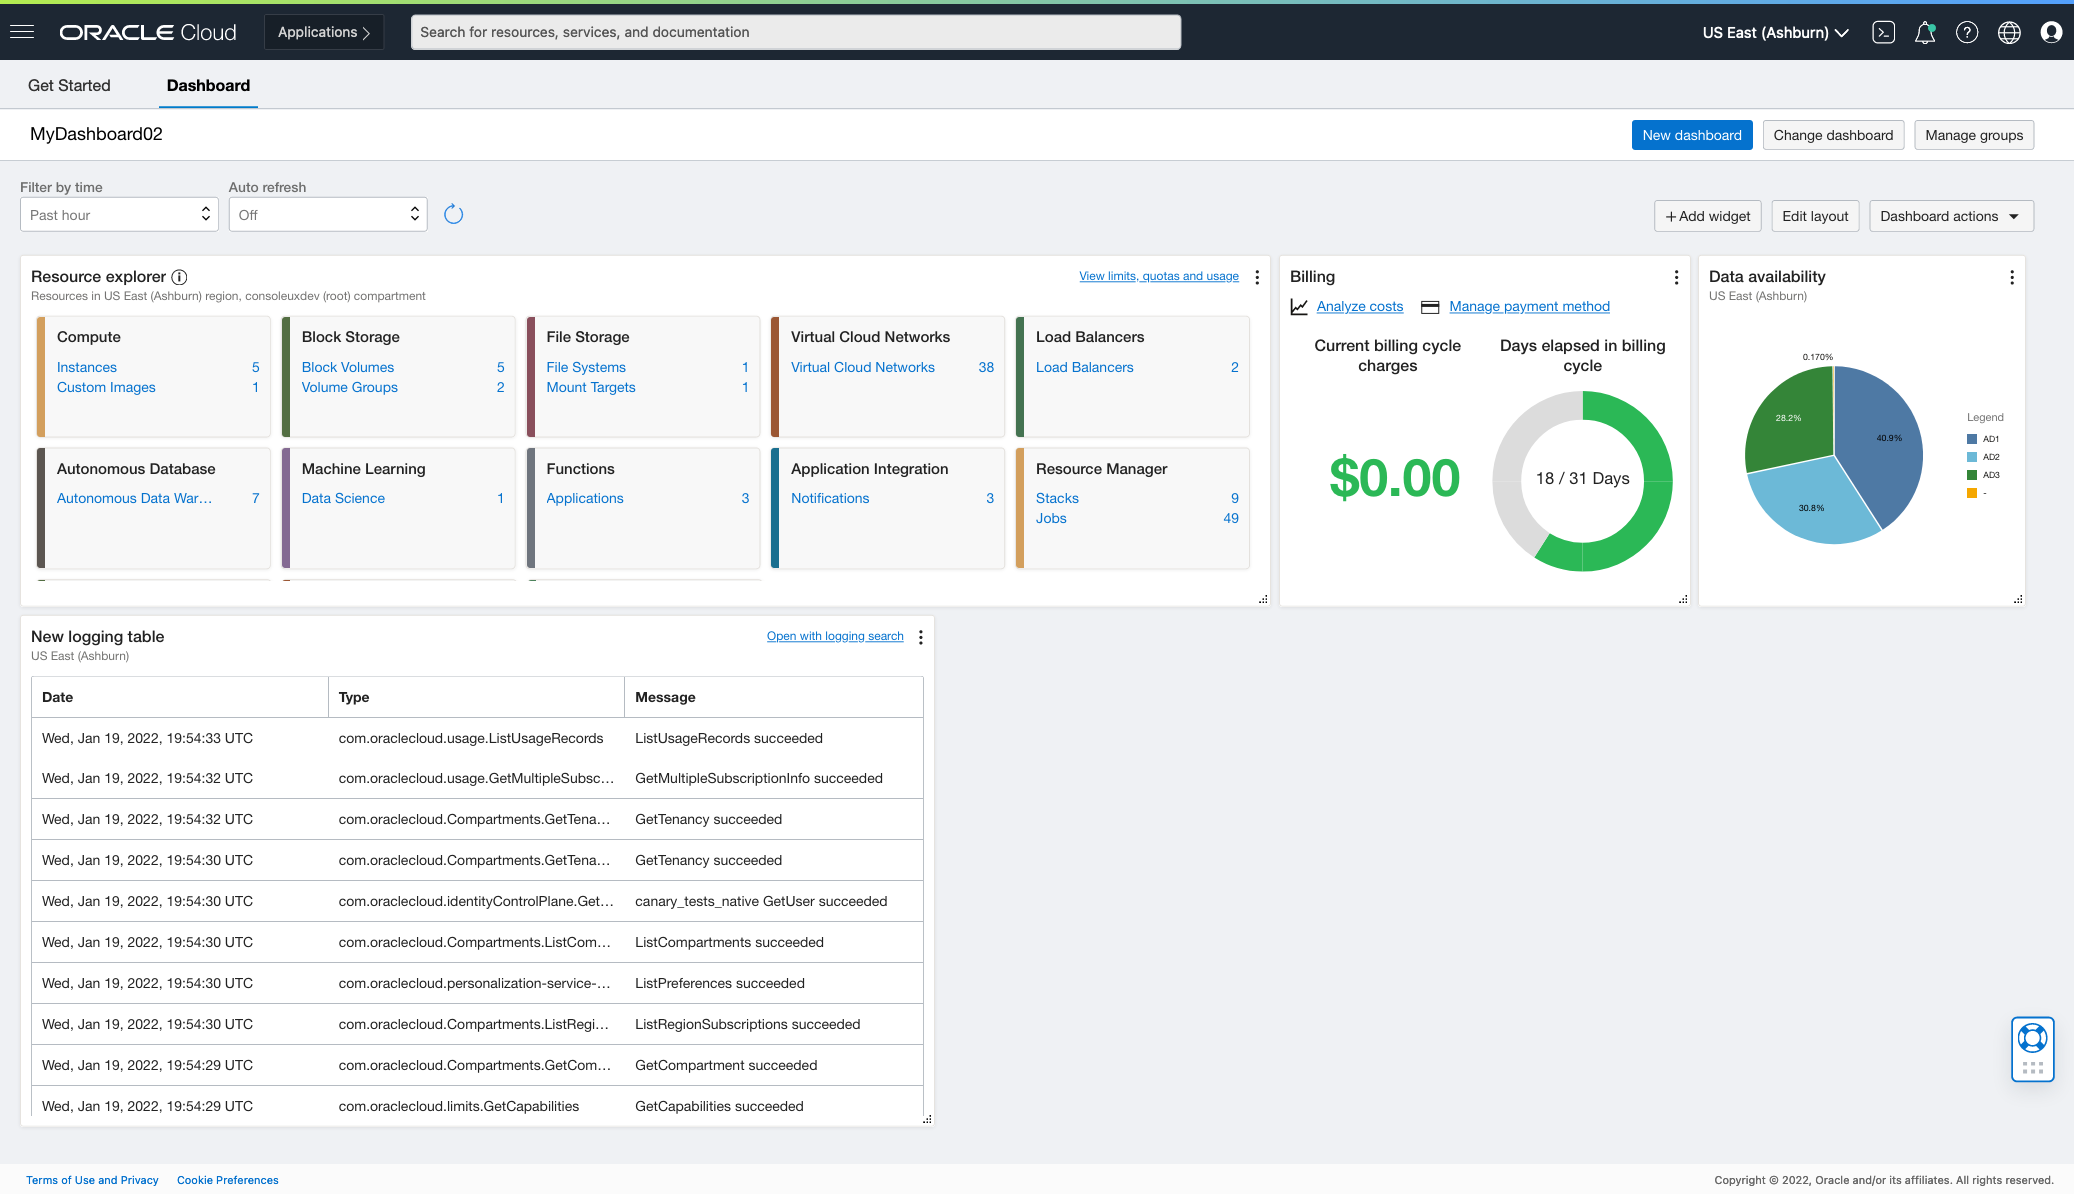
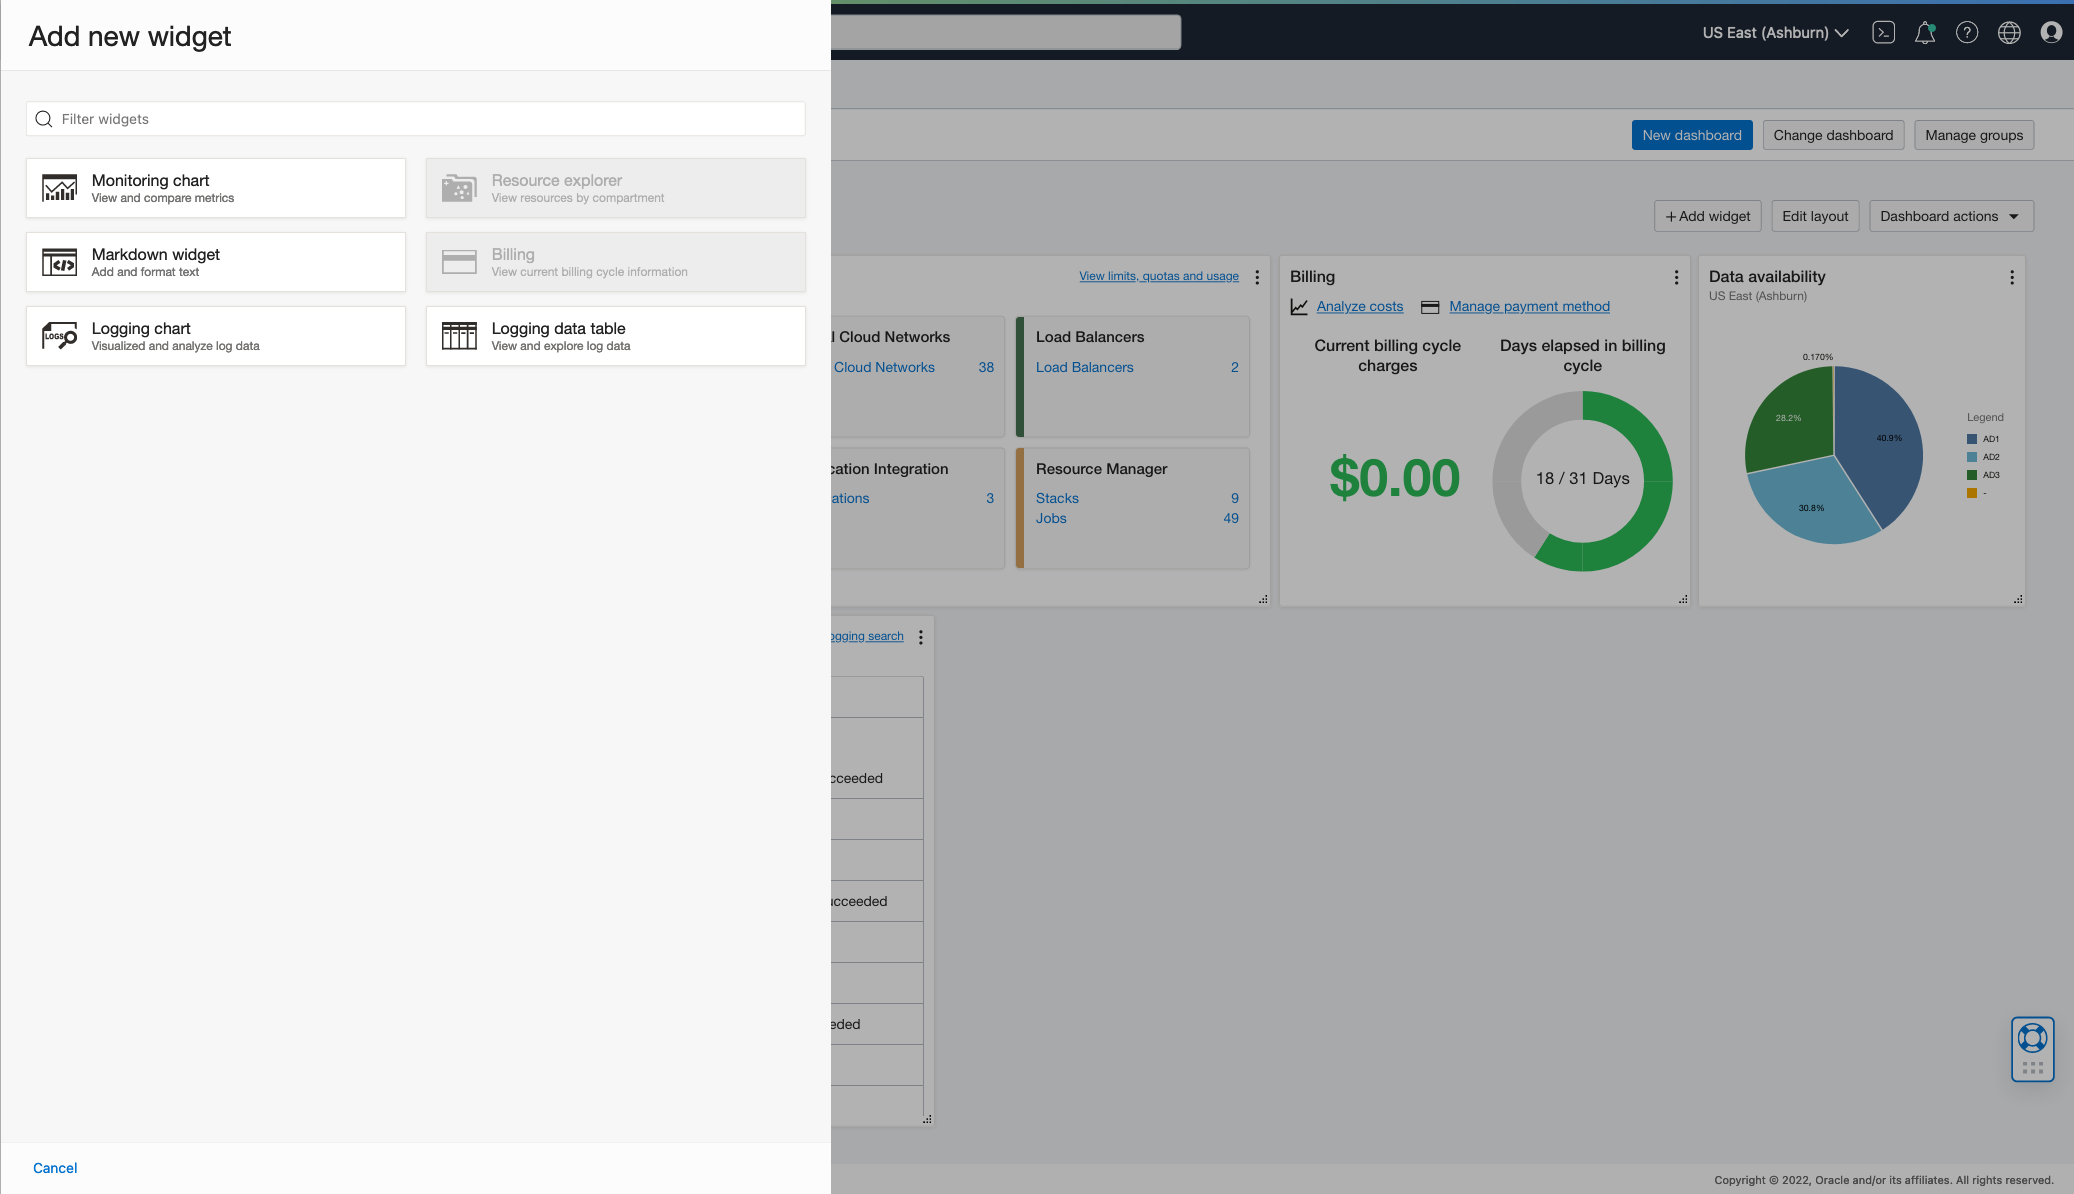
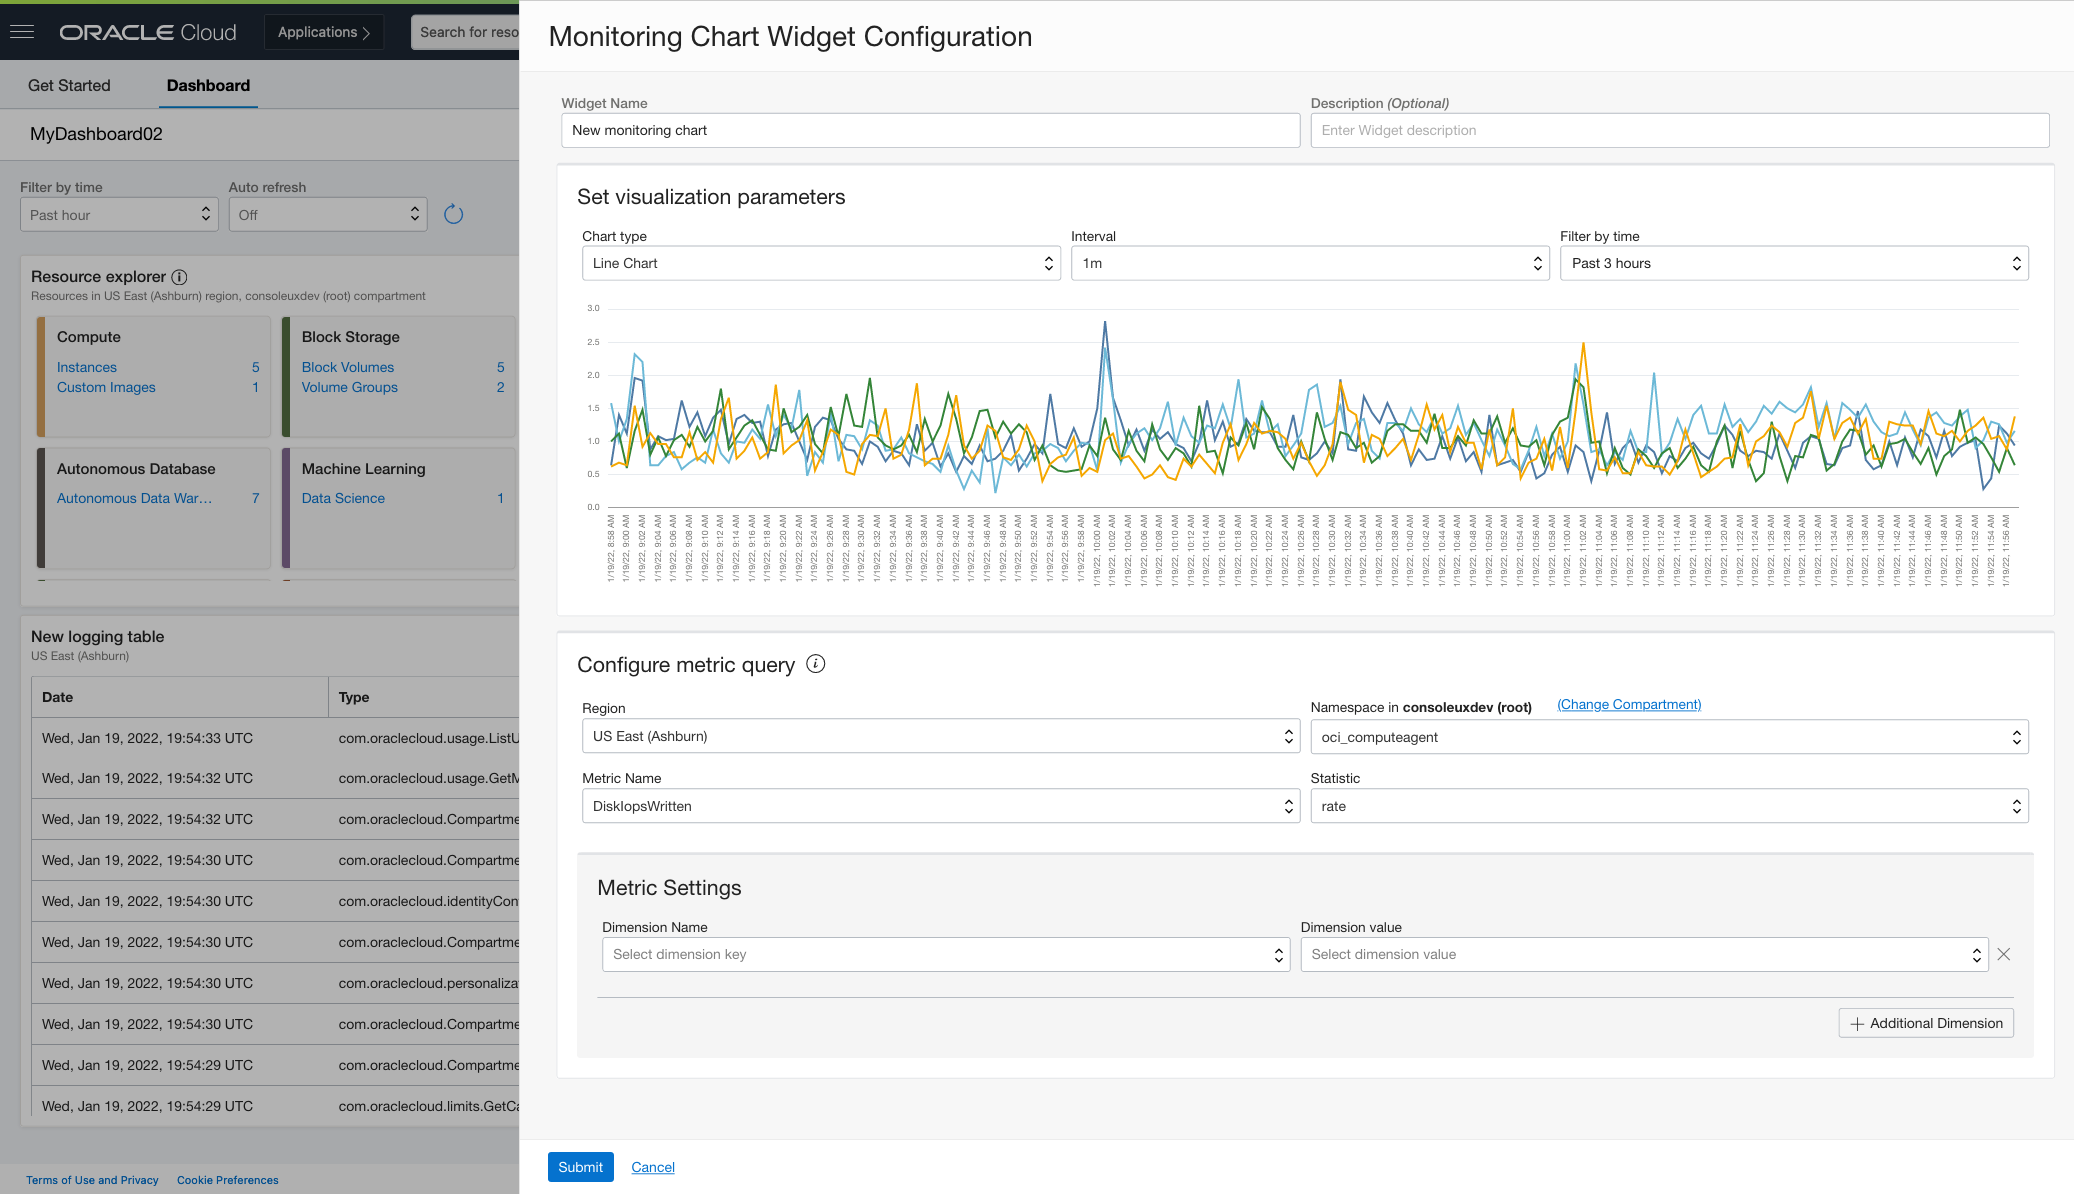
To create a visualization on your dashboard, you need a widget. Click +Add Widget, and select the Monitoring chart from the six available widgets. After selecting the position of the new widget on the dashboard canvas, you’re ready to configure your widget. In the configuration panel, filling in a few fields gives you a preview of a chart, and you can modify them until you’re happy with what you see. Click Submit, and your widget setup is complete. You can come back anytime and reconfigure any widget in a similar fashion.
Getting started is easy
OCI Dashboards is now available in all OCI commercial regions. OCI Dashboards is accessible through the Oracle Cloud Console, CLI, and REST API. Want to learn more? Check out our Dashboards documentation.
Today is just the beginning of Oracle Cloud Infrastructure Dashboards. We’re adding more data sources and widget types to give you even more powerful data visualization. Plus, we’re adding new capabilities to help you operate your cloud environment like never before. Stay tuned for updates. Sign up for the Oracle Cloud Free Trial or sign in to your account today to try Dashboards and build your own data visualization charts!