Hi Everyone, I’m Lee Gates and I am in the Oracle Cloud Infrastructure team researching performance and optimizing efficiency for applications. At Oracle OpenWorld, we announced a major enhancement to our Compute Service, introducing the new X7 compute platform. In this blog, we’ll provide a detailed report covering the performance of our newest compute shapes, Standard2.52 and DenseIO2.52. My colleague Karan Batta announced the service, High Performance X7 Platform Generally Available. We’ve been able to improve on our first generation across the board!
Let’s put our enhanced Compute Service through its paces. First we’ll cover the specifications of these two new bare metal instances.
| Shape | Instance | Cores | RAM (GB) | Networking | NVMe Storage (TB) |
|---|---|---|---|---|---|
| Standard | BM.Standard2.52 | 52 | 768 | 2×25 Gigabit Ethernet | N/A |
| Dense I/O | BM.DenseIO2.52 | 52 | 768 | 2×25 Gigabit Ethernet | 51.2 |
Oracle Cloud Infrastructure bare metal instances deliver over 5.5MM IOPS from NVMe storage devices improving on OCI’s best in class performance! The compute architecture is Intel Xeon Platinum 8167M CPU @ up to 2.4 GHZ, enabling high performance compute intensive workloads. A Broadcom 2x25GBE network adapter delivers network access to your block devices, other instances in your network, and your internet traffic. The NVMe flash storage is delivered by Intel NVMe P4500 SSDs.
At Oracle OpenWorld, we introduced our new X7 compute platform by comparing to AWS i3. We’ll compare performance and capability with AWS i3, and then go through our test plan and review the results. First here’s how I like to think about the top line of the direct comparison on capacities and counts.
| Oracle Cloud Infrastructure | 63% more vcores per compute instance than AWS i3 | 1% more write IOPS per compute instance than AWS i3 | 67% more read IOPS per compute instance than AWS i3 | 57% more memory per compute instance than AWS i3 | 237% more local NVMe SSD storage than AWS i3 | |||||
|---|---|---|---|---|---|---|---|---|---|---|
| Instance | OCI Dense2.52 | AWS i3 | OCI Dense2.52 | AWS i3 | OCI Dense2.52 | AWS i3 | OCI Dense2.52 | AWS i3 | OCI Dense2.52 | AWS i3 |
| Metric | 104 | 64 | 1,408,412 | 1,400,000 | 5,497,776 | 3,300,000 | 768 | 488 | 51.2 | 15.2 |
Bare Metal Test Plan
This table covers the tests I use to measure and benchmark performance, and summarize how other services measure.
| Component | Measurement | Observation |
|---|---|---|
| NVMe devices | 51.2 TB – latency and throughput | < 1 millisecond latency for all R/W mixes |
| Network | 25 Gbe bandwidth – host to host | < 100 microseconds |
| Memory | Memory bandwidth | up to 186 GB/second |
| Compute | CPU2017 | SPECrate2017_int estimate up to 197 |
| Block storage | Single Volume and 32 Volume Performance | < 1 millisecond latency @ 25 Gbe for all R/W mixes |
Compute
We’ll start with the CPU and then work through the components.
Standard Performance Evaluation Corporation (SPEC) CPU®2017 v1 is an industry standard CPU intensive benchmark suite stressing a system’s processor, memory subsystem and compiler. It consists of 10 integer benchmarks, and 14 floating point benchmarks. The SPEC CPU2017 suite can be run to provide a speed metric or a throughput metric, each using the same base optimizations, or per-benchmark peak optimizations.
SPEC CPU2017 is SPEC’s latest update to the CPU series of benchmarks. The focus of CPU2017 is on compute intensive performance and the benchmarks emphasize the performance of the processor, memory hierarchy, and compilers.
The benchmark is also divided into four suites:
- SPECspeed 2017 Integer – 10 integer benchmarks
- SPECspeed 2017 Floating Point – 10 floating point benchmarks
- SPECrate 2017 Integer – 10 integer benchmarks
- SPECrate 2017 Floating Point – 13 floating point benchmarks
Each of the suites contain two metrics, base and peak, which reflect the amount of optimization allowed. The overall metrics for the benchmark suites which are commonly used are:
- SPECspeed2017_int_base, SPECspeed2017_int_peak: integer speed
- SPECspeed2017_fp_base, SPECspeed2017_fp_peak: floating point speed
- SPECrate2017_int_base, SPECrate2017_int_peak: integer rate
- SPECrate2017_fp_base, SPECrate2017_fp_peak: floating point rate
When I ran the test using default values for a DenseIO2 bare metal instance the test estimates were:
| Shape | O/S | Compiler | SPECspeed2017_int | SPECspeed2017_fp | SPECrate2017_int | SPECrate2017_fp | ||||
|---|---|---|---|---|---|---|---|---|---|---|
| Base | Peak | Base | Peak | Base | Peak | Base | Peak | |||
| BM.DenseIO2.52 (stock) 2x Xeon Platinum 8167M (2.0/2.4* GHz, 2s/52c/104t, 768 GB DDR4/2400 MHz, 25GbE) | OL 7.3 | Intel 17.0.4.196 | 5.28 | 5.58 | 101 | 101 | 184 | 197 | 188 | 191 |
“Stock” means BMCS BIOS settings as of Aug 2017.
* First CPU speed is nominal rating. Second CPU speed is the peak Intel® Turbo Boost speed.
The test log files are attached.
Memory
Memory bandwidth and latency are important for data intensive workloads. We’re running the memory stream-scaling test harness automated by Cloud Harmony. STREAM measures sustainable memory bandwidth and the corresponding computation rate for four simple vector kernels. While it can be run serially, it is typically run in parallel (using either OpenMP, pthreads, or MPI). The benchmark benefits from the amount of compiler optimization applied up to a point; for parallel runs performance is ultimately constrained by thread or process synchronization (e.g. the efficiency of barrier() calls in underlying system libraries). Additionally, some parallel library implementations will use only (and bind only) to physical cores, so some care is required when interpreting results if vcpus (e.g. Intel Hyper-threading) is enabled.
| Shape | O/S | Compiler | Threads | Memory Bandwidth GB/s (1GB = 109 bytes) | |||
|---|---|---|---|---|---|---|---|
| Copy | Scale | Add | Triad | ||||
| BM.DenseIO2.52 (stock) 2x Xeon Platinum 8167M (2.0/2.4* GHz, 2s/52c/104t, 768 GB DDR4/2400 MHz, 25GbE | OL 7.3 | gcc 4.8.5 | 521 | 123.43 | 122.58 | 145.05 | 145.15 |
| 104 | 127.92 | 127.63 | 143.62 | 143.81 | |||
| BM.DenseIO2.52 (stock) 2x Xeon Platinum 8167M (2.0/2.4* GHz, 2s/52c/104t, 768 GB DDR4/2400 MHz, 25GbE | OL 7.3 | Intel 17.0.4 | 521 | 170.33 | 175.31 | 185.85 | 186.37 |
| 104 | 160.93 | 162.68 | 177.15 | 177.33 | |||
Average of 5 runs.
“Stock” means bare metal instance BIOS settings as of Aug 2017.
1. System with Hyperthreading enabled, but benchmark run/bound only on physical cores.
The test log files are attached.
Network
Oracle Cloud Infrastructure employs state of the art networking architecture to ensure consistent, predictable performance. I’m using the Cloud Harmony networking tests to measure latency, bandwidth, and DNS response time. We’ll cover these here, and attach the logfiles to this post for the summarized results. The test log files are attached for the measurements.
Latency Measurements within single AD
- Ping count is 100.
- Ping interval is .001 seconds.
- Measurements are microseconds.
- DenseIO1.36 measurements were taken in Phoenix.
- DenseIO2.52 measurements were take in Ashburn.
- Latency tests are not shape dependent
| Average Latency (µs) | Min | Max | Std Dev | |
|---|---|---|---|---|
| BM.DenseIO1.36 | 60 | 56 | 156 | 10 |
| BM.DenseIO2.52 | 42 | 38 | 95 | 5.5 |
| VM.DenseIO2.24 | 42 | 41 | 75 | 3.4 |
Bandwidth Measurements within single AD
- Download file size is 100 MB.
- The test file is downloaded 100 times
- Measurements are Megabits per second.
- DenseIO1.36 measurements were taken in Phoenix DC, zone 3.
- DenseIO2.52 measurements were take in Ashburn DC, zone 1.
| Shape | Average Bandwidth | Min | Max | Std Dev |
|---|---|---|---|---|
| BM.Standard1.36 | 9,409 | 7,926 | 10,097 | 285 |
| BM.DenseIO2.52 | 2,3372 | 21,167 | 24,296 | 338 |
| VM.Standard 2.1 | 952 | 716 | 1,017 | 37.8 |
| VM.Standard 2.2 | 1,904 | 1,355 | 1,916 | 93.9 |
| VM.Standard 2.4 | 3,806 | 2,649 | 3,826 | 142 |
| VM.Standard 2.8 | 7,601 | 7,565 | 7,664 | 17 |
| VM.Standard 2.16 | 15,155 | 14,980 | 16,000 | 285 |
| VM.Standard 2.24 | 23,734 | 19,187 | 25,774 | 2,071 |
| VM.DenseIO 2.8 | 7,602 | 7,559 | 7,737 | 32 |
| VM.DenseIO 2.16 | 15,141 | 12,311 | 16,739 | 493 |
| VM.DenseIO 2.24 | 23,765 | 19,622 | 25,284 | 1,835 |
DNS Query Response Time
- The DNS query test measures elapsed time for DNS lookups using test URL (default is google.com).
- The test file is run 10 times
- Measurements are Milliseconds.
- DenseIO1.36 measurements were taken in Phoenix.
- DenseIO2.52 measurements were taken in Ashburn.
- DNS query test response times are not shape dependent.
| Shape | Average Query Time (ms) | Min | Max | Std Dev |
|---|---|---|---|---|
| BM.DenseIO1.36 | 64 | 47 | 114 | 26 |
| BM.DenseIO2.52 | 21 | 18 | 33 | 5.9 |
| BM.DenseIO2.24 | 21 | 16 | 32 | 6.1 |
NVMe Storage
The performance for the NVMe devices is great. Intel has delivered improved density and read performance with clear results. 51.2TB of NVMe with 5.5MM IOPS at < 1ms latency flash bests our first generation and we’re working to improve even further.
Before running any tests, protect your data by making a backup of your data and operating system environment to prevent any data loss. WARNING: Do not run FIO tests directly against a device that is already in use, such as /dev/sdX. If it is in use as a formatted disk and there is data on it, running FIO with a write workload (readwrite, randrw, write, trimwrite) will overwrite the data on the disk, and cause data corruption. Run FIO only on unformatted raw devices that are not in use.
| Test Details NVMe Block Volume Capacity: 6.4TB x 8 Direct I/O |
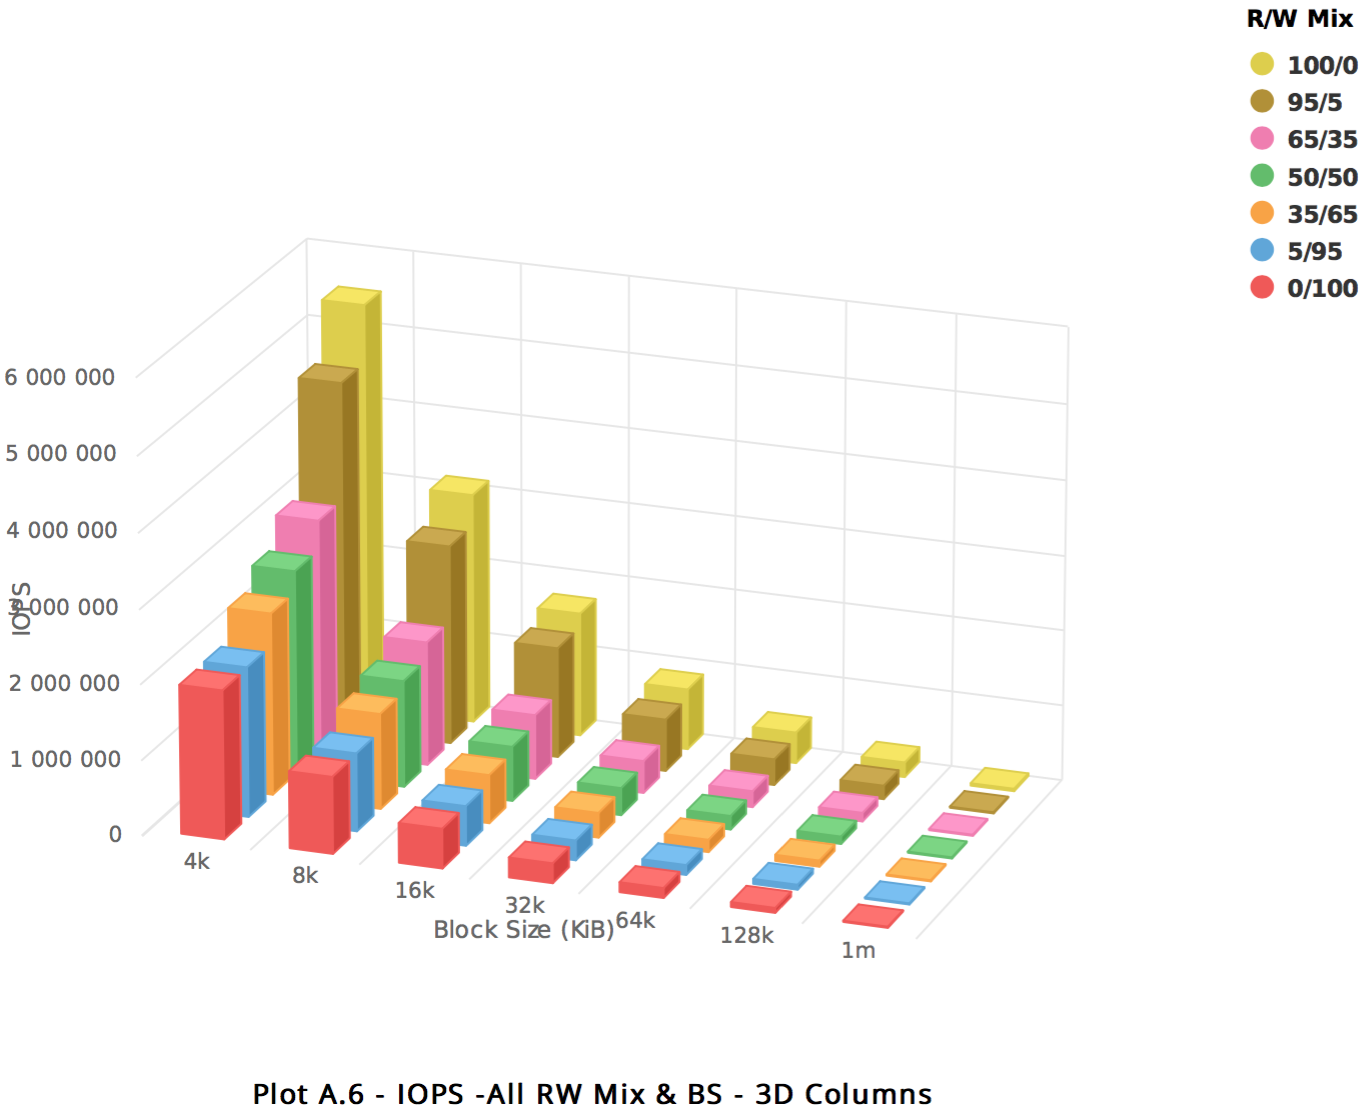 |
| Observed Performance: 52 Core DenseIO2.52 Bare Metal Machine up to 5.5MM IOPS |
| Reproduction Steps
|
Block Storage
For this test, our newest instances are available in our newest regions – Ashburn and Frankfurt. Here’s how 32 volumes perform when concurrently attached to the same second generation dense instance but each volume with independent FIO tests. We see an incredible average of 400,000 IOPS to the host.
BM.DenseIO2.52 – Block Storage Summary devices for all Blocksizes and R/W Mix:
| Test Details Block Volume Capacity: 1TB x 32 |
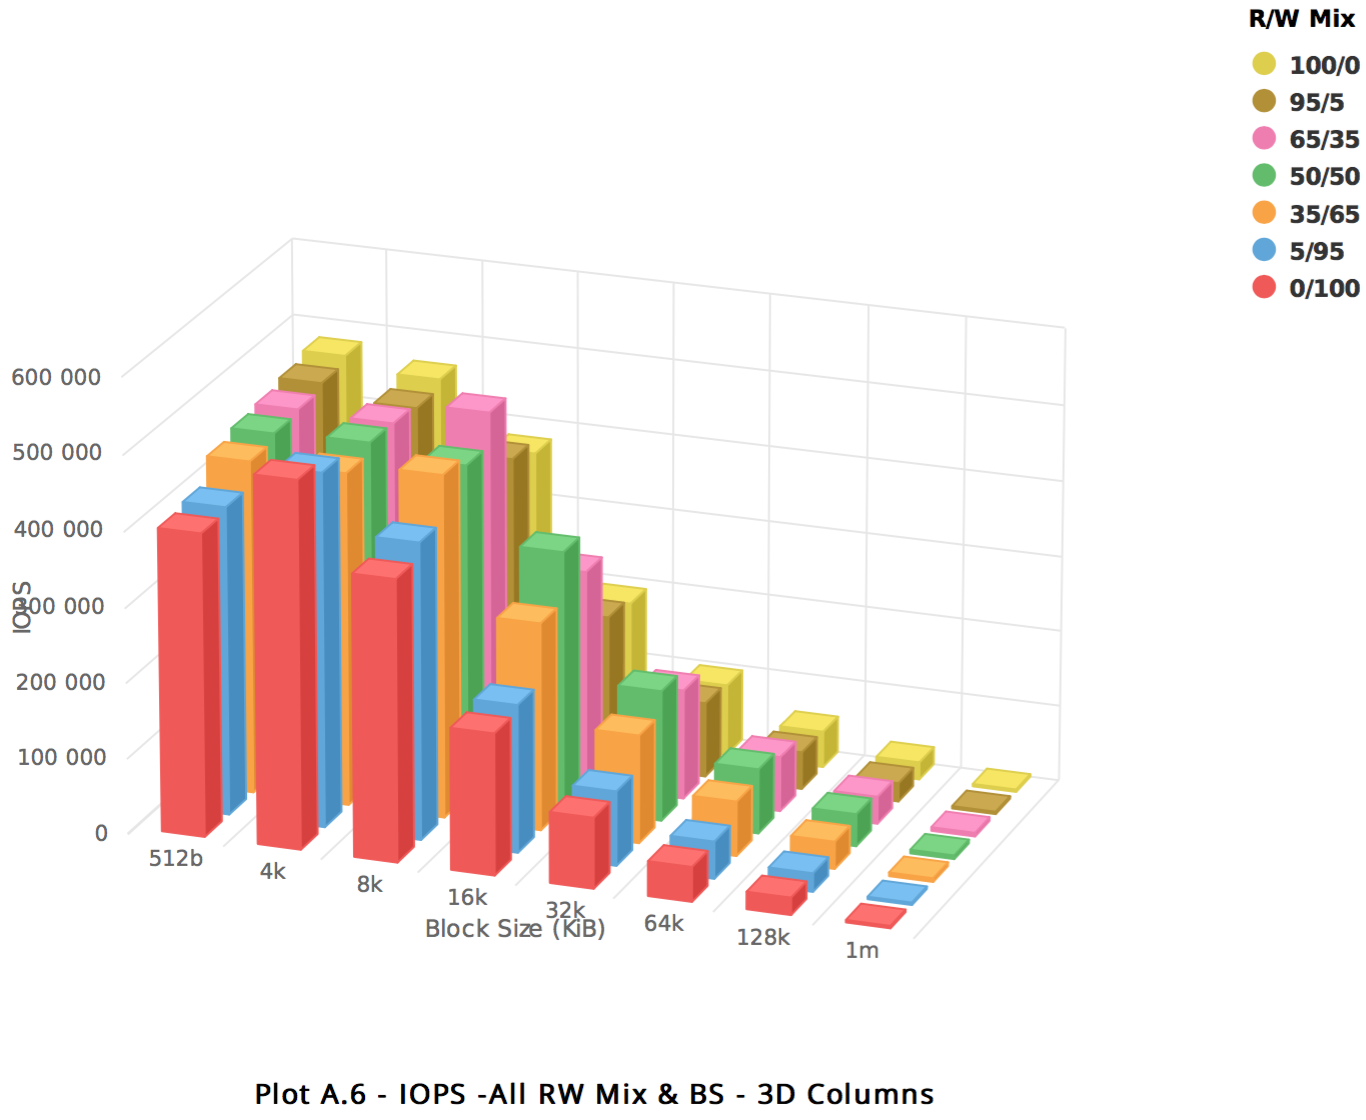 |
| Observed Performance: 52 Core DenseIO Bare Metal Machine > 400K IOPS |
| Reproduction Steps
|
The test log files are attached for the measurements. Updated February 16, 2018.
Delivering on the Oracle Cloud Infrastructure Promise of High Performance and Value
Our compute team is delighted with the value, performance, and and overall feedback during testing. Multiple dimensions of performance improvement confirm our updated second generation compute service is capable of meeting the most difficult data-intensive enterprise application requirements. We hope this straightforward analysis can help open discussion in your organization about using Oracle Cloud Infrastructure for use cases ranging from high performance computing in research and development to databases, to everyday internet-facing applications, all with very low cost of entry and transparent pricing. Explore the bottom line advantages of converting your IT capital expense to operational expenses with OCI services, and accelerate your innovation with quick-to-deploy, low cost testing environments.
Please share your most challenging high availability and performance sensitive workloads. Or, if you want more information on our performance methodology, have questions on specific workloads or need help achieving similar results, please reach out to me at lee.gates@oracle.com.