A lightning strike in Sydney. Protests in the streets of Bangladesh. A third-party vendor snipping the wrong span of fiber-optic cable (oops!). What do all these events have in common? Before we get to the answer, you may want to brush up on what you learned in the previous blog post, which outlined the Oracle Cloud Infrastructure (OCI) DevOps Portal Experience tool – a web user interface (UI) to help OCI employees build and operate Oracle’s global cloud. Since the DevOps Portal Experience only works when it’s connected to multiple regions and services around the world, the team has worked to help reassure our customers that our monitoring solution is robust and sensitive.
Now, to answer the question posed at the top of the article: the network disruption caused by all three of those events was detected by the canary system (“canary” here refers to a monitoring system that tries to emulate customer behavior, thereby acting as the “canary in the coal mine”) that the DevOps Portal Experience team built. Why should a UI team, nominally responsible for showing fancy widgets on a webpage, know about these disruptions before anyone else? The answer has to do with Oracle’s dedication to its customer’s experience, and we will learn about it in this post. We will also learn a little about monitoring in general: how it can sometimes be difficult to monitor only the thing you’re interested in, and how different monitoring granularity and sensitivity can have outsized impacts on the incident response flow.
A quick recap
You may remember from the previous post about the DevOps Portal Experience that we at OCI have built a single web interface, reachable from the Oracle corporate network, that allows OCI employees to connect to, monitor, and administer services in multiple regions around the globe. One thing we alluded to but didn’t really dive into last time was the question of how to monitor such a system. The DevOps Portal Experience UI must not become unavailable, even if a fundamental OCI system (like OCI Monitoring or OCI Identity) is unavailable, because the UI is a crucial part of recovering those systems. This makes the DevOps Portal Experience a unique OCI service: its engineers are constantly trying to minimize dependencies on other services, but if any service in any region is misbehaving, the customers of the UI (in other words, all internal OCI employees) see the impact. As such, the DevOps Portal Experience engineers need to know what the customer experience is like on the site, in real-time. Our customers may be operating on any service in any region. How do we keep tabs on all that?
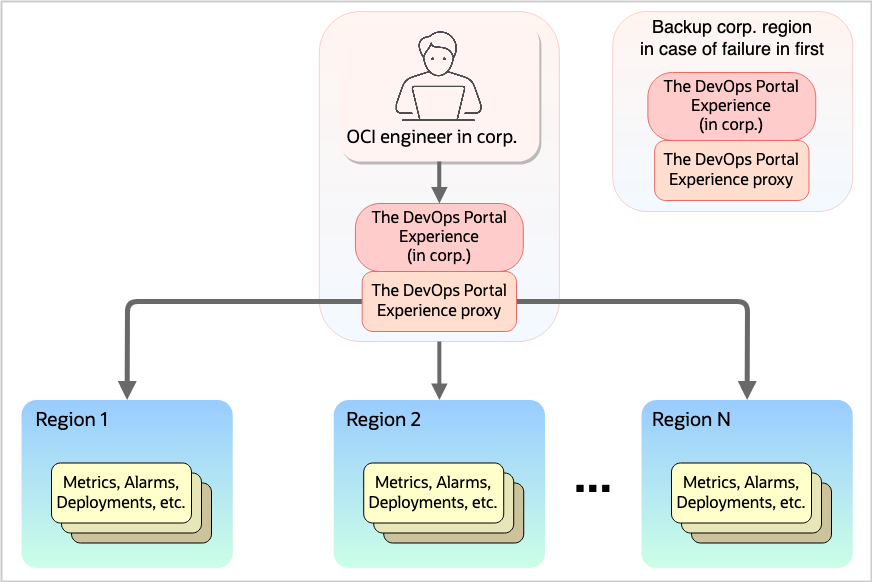
Figure 1: The DevOps Portal experience architecture across multiple regions.
So how do we monitor it?
From the very early days, the team needed to come up with a way to monitor the DevOps Portal Experience across many regions. However, due to the sensitive nature of the operations that can be performed with the UI, all operators who use the DevOps Portal Experience must prove they are OCI employees through two-factor authentication; a password (something they know) and a hardware device plugged into their machine (something they have). This kind of authentication is especially important for the DevOps Portal Experience, since it acts as a gateway to all OCI services in all OCI regions and realms. Any entity that can authenticate against the DevOps Portal Experience can then interact with all services everywhere. Of course, we have robust authorization policies in place to help ensure that the owners of infrastructure can make changes, but even getting through the Portal’s front door implies that you have some sort of ability to interact with internal OCI services. This same principle carries over to automated monitoring of the Portal, and we need to be especially careful around any programmatic access. Simply giving a “special certificate” or “headless password” to an automated UI canary (which is standard industry practice) opens up all kinds of security and compliance problems that Oracle will not compromise on. As such, OCI ultimately decided that to use the Portal UI you must be a human in possession of a hardware device, with no exceptions for canaries. Before coming to this conclusion, we went back and forth quite a bit with the security and compliance teams, discussing many options. Ultimately, OCI was unwilling to budge on security for the purposes of our canary.
As a result of this security choice – which is the right one – it becomes exceedingly difficult to write a proper UI canary with the likes of Playwright, Cypress, Selenium, or other end-to-end testing frameworks. The documentation for these tools always includes a way to get past your app’s login screen (just store a username/password combo somewhere!) but it never includes a way to make the automated tests pass a two-factor challenge, which is exactly what we would need.
We needed another approach. So, we set up a canary that shares infrastructure with the proxy I mentioned in the previous blog about this UI. With a small amount of effort, we could send requests (with synthesized authentication materials asserting “I’m the canary!”) through this proxy, to a subset of services in every region. These requests would be simple, read-only requests like “give me a list of metric names,” but they would be enough to determine that (in this example) the telemetry service is responding in every one of the OCI regions. And that would mean that we would expect all telemetry-based calls originating from the DevOps Portal Experience to succeed, which serves as a proxy for the question “Are all of the DevOps Portal Experience’s monitoring pages working?”
If we multiply this sample monitoring API call across all the critical OCI services in all the available OCI regions, we get a huge cross-product of checks that, when taken together, can start to give a holistic picture of the health of the DevOps Portal Experience. We can look at our alarms and see that everything is okay except for a single degraded service in one region, or we can see that a region is completely isolated due to a problem with a transit provider or some other kind of “internet weather” phenomenon.
In fact, it’s probably worth it to take a moment here to zoom out and examine what’s actually being monitored here. One of my perennially favorite technical interview questions is: “describe in as much detail as you can what happens between the time you type cloud.oracle.com into your browser’s address bar, and the moment you see the nice login page on your screen.” We don’t have the time or the space to go into all the nitty-gritty details here, but there is a great deal of internet infrastructure that needs to be in place and working properly just for this seemingly simple task to succeed: your local wired or wireless networks, authoritative and recursive DNS servers, networking equipment and protocols, load balancers and firewalls, SSL/TLS encryption protocols, application servers, et cetera. Sometimes it seems like a miracle that a “simple” request like opening a web page can ever work at all. The interview question above, and the answer it provokes, are meant to serve as a reminder of how many different pieces of infrastructure must work together in order to perform things we think of as trivially simple. So, in a sense it’s no surprise that the alarms set off by the Devops Portal Experience canary are sometimes the early warning signs of something going wrong, either inside or outside of OCI’s control.
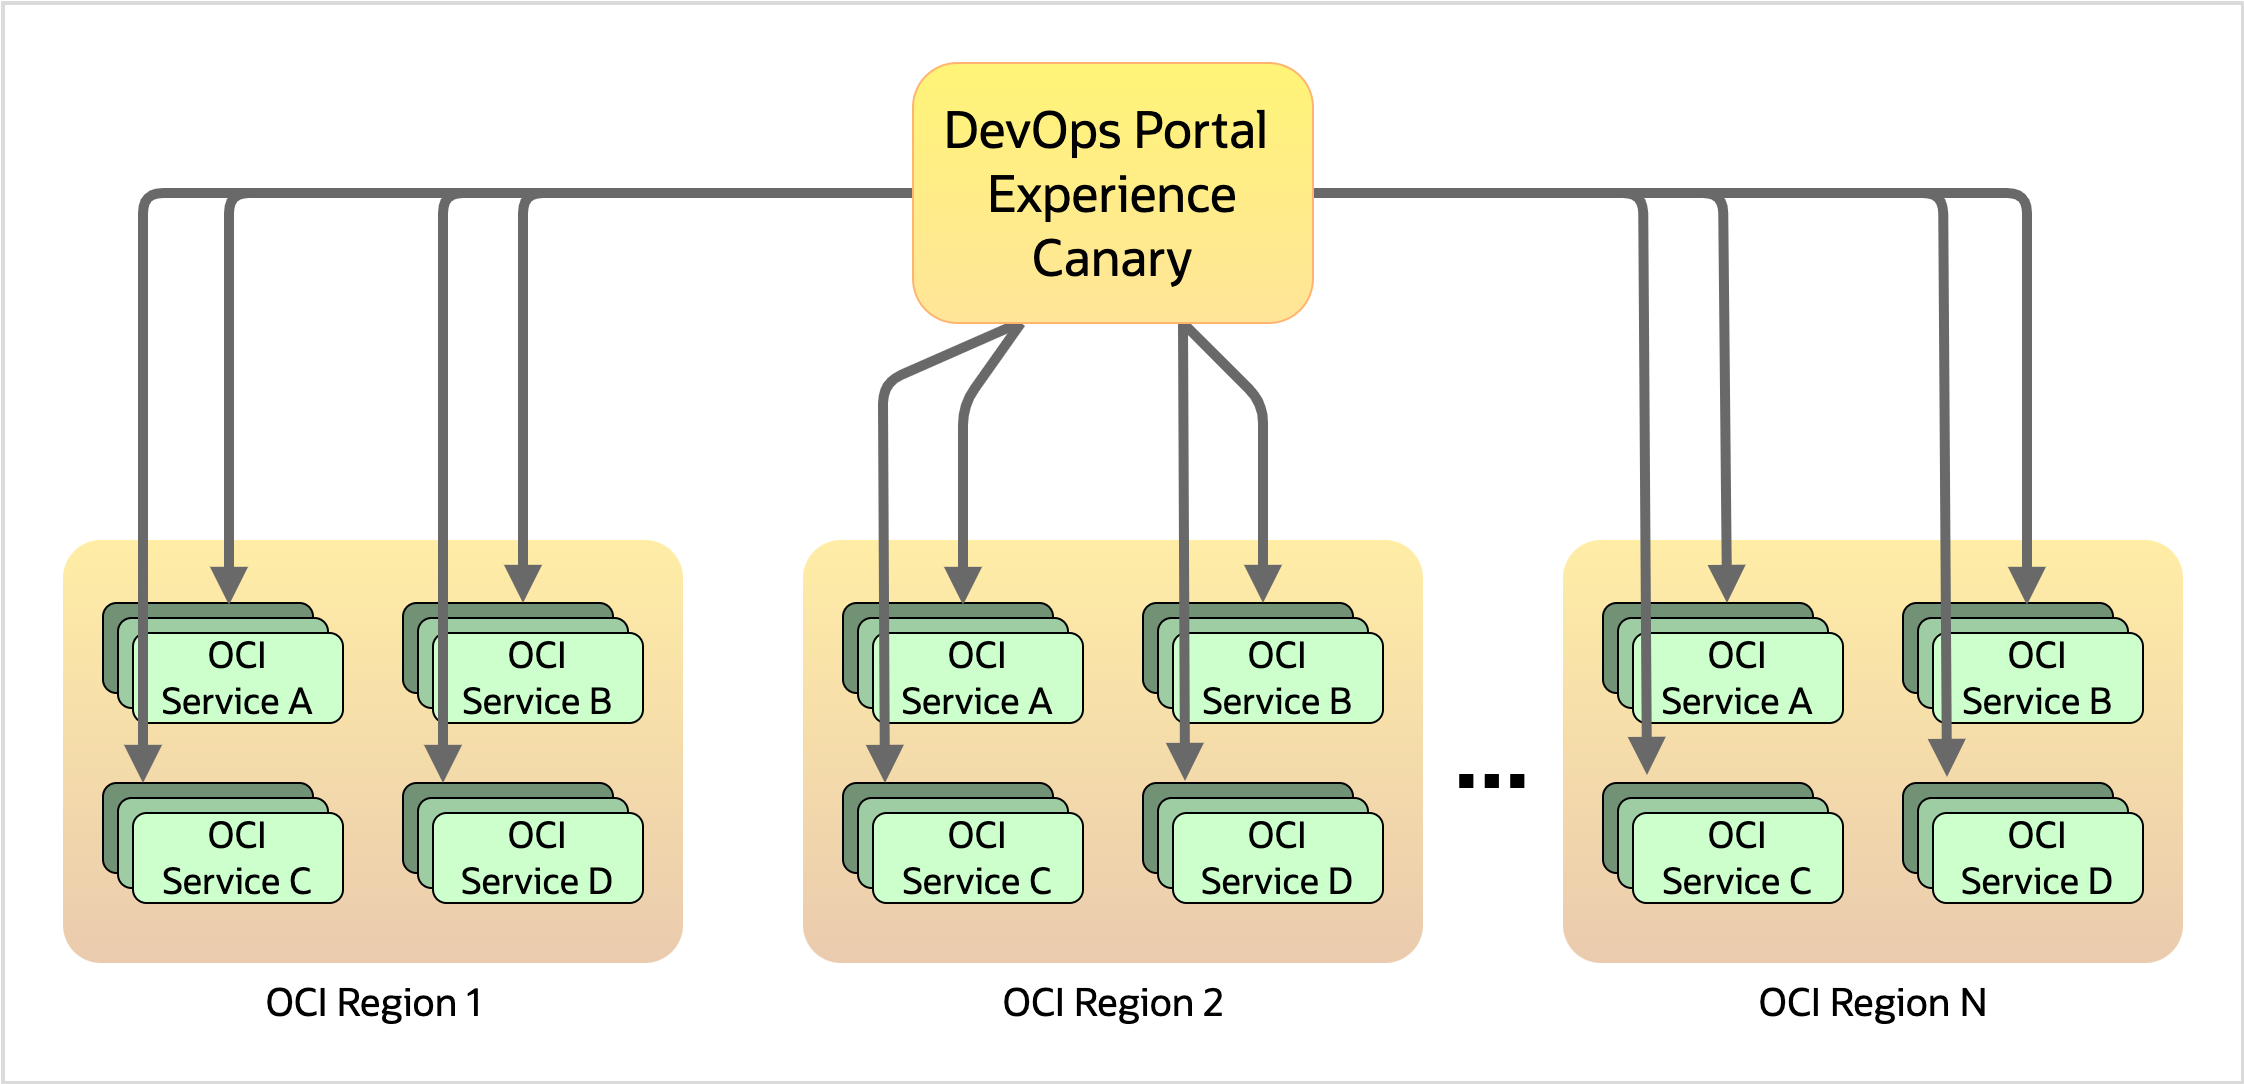
Figure 2: The DevOps Portal Experience canary architecture, illustrating the large number of checks required
So, in a sense, the canary we designed and built for monitoring the experience of UI users is acting as a “Thousandeyes”-like global network monitor. Sometimes our alarms are the first to go off and alert us of a large-scale networking event, often out of our control. We are indirectly measuring every hop of the trip that a packet takes during its journey. Our canary sees blips in networking, DNS, load balancer and firewall configurations – even a CRC error on a single port of a global transit provider’s networking equipment (which I mentioned in the previous blog post) was detected with this canary. This brings us to an important lesson about monitoring things at scales like OCI’s: when a team chooses how to monitor a piece of their service, they are implicitly making decisions about how much of the rest of the system – the part they don’t control – they are monitoring as well. Should a service team write a canary that monitors its service’s “hello world” page? Or should their canary read and write some rows in the database? There are tradeoffs to both: on one hand they might not be getting enough information about the health of their service, but on the other hand they may be paged and woken up when the network or the database’s storage layer are acting flaky. These are just toy examples of decisions to be made when designing monitoring solutions.
OCI puts customers first. So, we intentionally put pretty tight thresholds on the alarms associated with the DevOps Portal Experience canary. The team is often early to notice something is going sideways, and the on-call will hop on an incident call and help engage the teams that will help troubleshoot or fix the problem. The DevOps Portal Engineers can often – but not always – use signals from these alarms to determine what the nature of the problem might be, which we will explore next.
What do we do when we get an alarm?
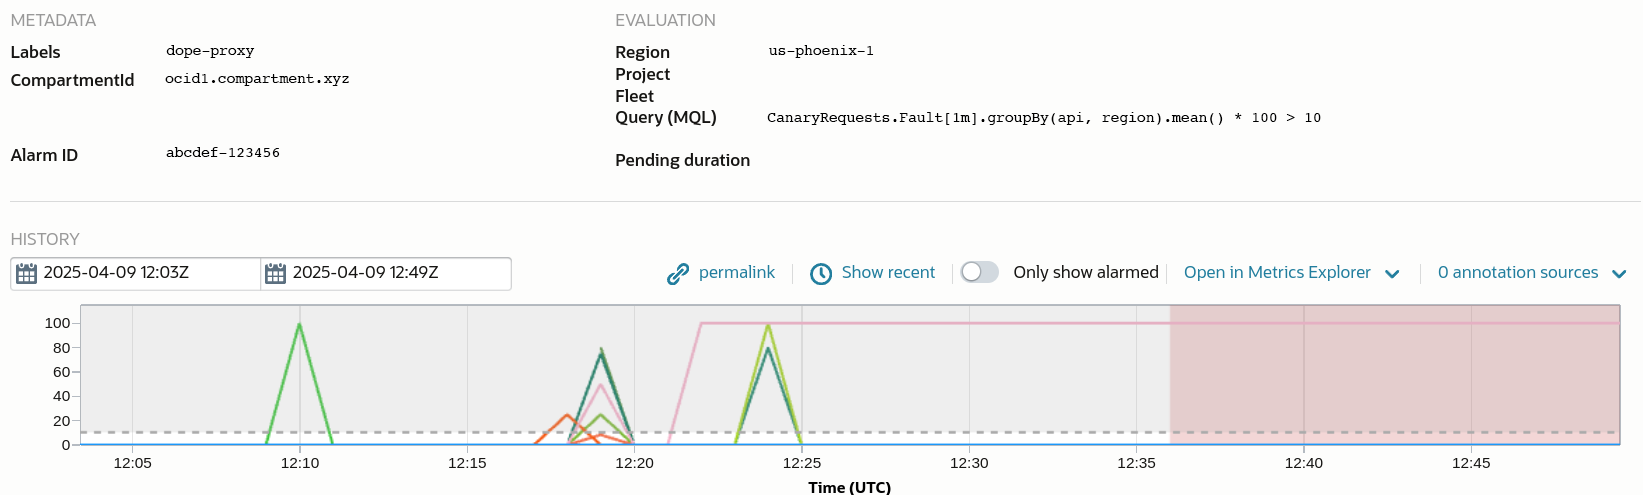
Figure 3: An example of a “false positive alarm” – some network traffic was flapping for about 12 minutes.
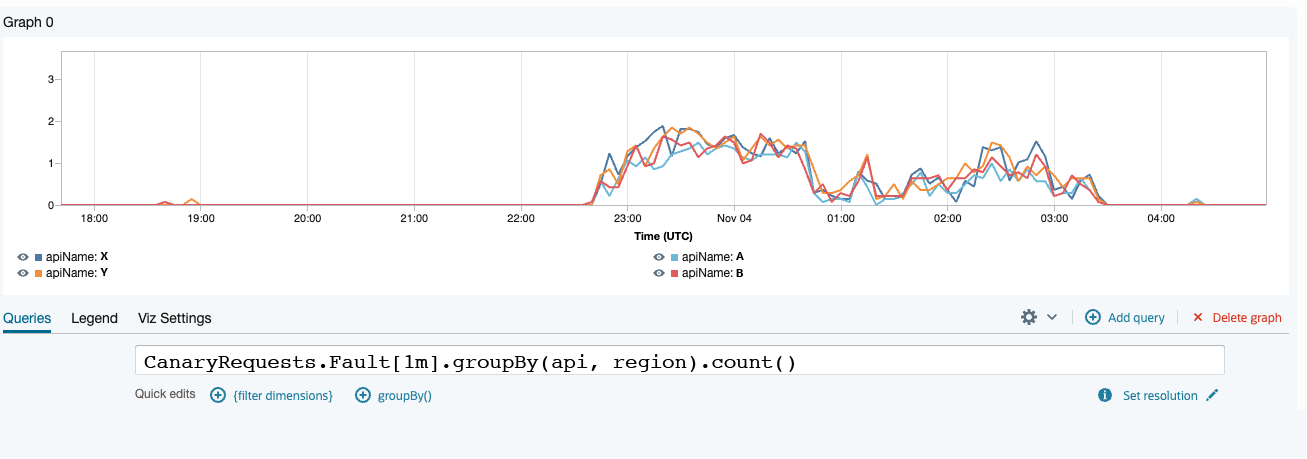
Figure 4: An example of what a real outage looks like; many probes fail for a long time.
Next, let’s have a look at the information these canary alarms contain, and what the DevOps Portal Experience engineers do when they see one. If a single service in a single region is showing degraded health, we get on a call with the Network Operations Center (NOC) and page that service team, asking them to have a look at their infrastructure, as well as the pieces on the edge of the network like internet gateways and load balancers. If an entire region goes red at once, it’s a good indicator of a networking change that may be beyond OCI’s control, but we still know to engage the core networking teams to help us take a look. In this way, the monitoring we have, as well as the response to that monitoring, is helping OCI become more operationally mature.
In theory, each class of alarm would be easily tied to an operational playbook. If an entire data center is out, simply engage the edge networking team and data center ops. But it’s not quite that simple. Even the exact same class of failure (the power went out!) might warrant a different response. Was it lightning striking a data center in Sydney, disabling part of the cooling power supply and causing the data center to get warm? Was it a power spike from the backup UPS (uninterruptible power supply) during maintenance of the primary one? Even these two scenarios require different approaches, and so, at least for now, we rely on the signal of the monitoring plus the expertise of the engineers engaged on the call to drive towards identifying and mitigating the problem as quickly as possible.
If you’ve ever navigated to a favorite site on the internet and thought to yourself: “why is this so slow today?” you can at least be thankful that you haven’t been woken up out of bed to investigate the slowness. An analysis of prior alarms shows that nearly 80% of the time, the DevOps Portal Experience canary alarms send an alert and then clear within a few minutes. OCI engineers need to know if a link in the chain is not performing as it typically does, and we’re willing to pay this false positive “tax” to the root of the problem quickly for the remaining 20% of alerts. Of the remaining actionable alarms, the majority are not a problem with the DevOps Portal Experience per se, but our canary helps give us the tools necessary to drive these incidents to completion.
How do we fix it when it breaks?
Because the DevOps Portal Experience canary can go off for so many different reasons, the engineers on the team need to have deep knowledge not only of their own tech stack, but also how packets actually get from our service to other services around the world. The team in charge of the DevOps Portal Experience is nominally a team that builds UIs, but we need to be able to run packet traces for networking teams and debug SSL handshakes or examine PKI certificate data for service teams. Not only do the DevOps Portal Experience engineers have the expertise to deal with these situations, they also have currently (and are continuing to build) diagnostic tools that help narrow the problem space as quickly as possible.
Because, as I have already mentioned, after the on-call engineer has determined that an alert is not due to a problem with the UI or its infrastructure, our next job is to engage the NOC and the relevant team(s), and then stay on the call and help troubleshoot. Ultimately, we rely on the fact that all other OCI service teams have similar cultures of expertise and similar tooling to help mitigate and resolve any large-scale events we see, whether it was our lowly canary that detected it or not.
What are the plans for the future?
This canary testing is only a small part of the total monitoring and alarming suite around the DevOps Portal Experience. The engineers also monitor specific pieces of our stack, request rates, node health, etc. We have discussed implementing a proper end-to-end canary, only putting it in the same logical network location as the current canary – that is to say, behind the front door that asks OCI engineers to present two-factor auth. This would not be a true end-to-end canary, since it’s not testing the login flow, but it would offer all the same advantages (and drawbacks!) of any headless browser testing. With the proper kind of retry logic and resilience, this kind of monitoring would give us an even clearer picture of the behavior of how the DevOps Portal Experience pages react to any instability in internet “weather” conditions.
You may also have noticed, dear gentle reader, that the signal that is output from the DevOps Portal Canary is a little too coarse-grained to make informed decisions about what to do when an alarm is triggered. The long-term goal of OCI is to automate as much of the incident response as possible, but we’re not quite there yet. For now, our plan is to integrate the signal from our canary with other signals coming out of other cross-cutting monitoring initiatives that have come online in the past year. Naturally, all OCI service owners are keen to answer the questions: “is my service performing nominally?” and “can customers interact with my service the way they expect to?” We want to use as much information as we can from disparate monitoring systems to make these questions simple to answer.
Conclusion
In this post, we’ve traced the challenges the team faced from addressing security concerns and building a canary system to monitoring OCI’s complex, multi-region DevOps Portal Experience service. We’ve seen how critical it is for engineers to monitor both the service they control and the network elements they don’t. It’s not just about detecting when something breaks; it’s about being proactive, understanding the interdependencies across OCI’s global infrastructure, and taking immediate action when things go wrong. We’ve seen how important canaries are for early detection of potentially large-scale incidents, and we’ve also seen how a coarse-grained canary ends up monitoring much more than just the individual service it’s looking at, which is both a blessing (more visibility!) and a curse (more pages waking us up at night!). As OCI’s operational culture and monitoring savvy continue to evolve together, we hope to continue to use the monitoring tools available to us, and to invent new ones, so we can approach a more perfect picture of the state of our global network at any given moment.
When it comes time for your organization to look more closely at its monitoring solution, you should check out the existing resources we already provide:
- Monitoring webpage
- Oracle Cloud Infrastructure Documentation: Overview of Monitoring
- Blog article, “Deep Dive into OCI Observability and Management Monitoring Query Language in OCI Alarms”
In addition, you may be able to take some lessons from this post to design a system using OCI’s observability tools that is appropriately sensitive for your cloud applications. Now get out there and start monitoring!
This blog series highlights the new projects, challenges, and problem-solving OCI engineers are facing in the journey to deliver superior cloud products. You can find similar OCI engineering deep dives as part of Behind the Scenes with OCI Engineering series, featuring talented engineers working across Oracle Cloud Infrastructure.