Introduction
Altair nanoFluidX is an advanced software product designed to allow engineers to quickly simulate and analyze single and multi-phase flows of complex systems. Based on the meshless Smooth Particle Hydrodynamics (SPH) method, nanoFluidX can help simplify use of CFD for virtual product development, particularly when element meshing is difficult. While SPH is computationally intensive compared to conventional methods, it is very suited for GPU computing, enabling engineers to harness the immense power of today’s GPU- accelerated systems. Oracle Cloud Infrastructure (OCI) offers engineers quick and simple access to a variety of HPC systems to explore new methods and software typically not readily available with bespoke on-premises systems. In this paper we will explore the performance of nanoFluidX with various GPU based OCI compute systems.
Benchmarks
For our benchmarks, we created various compute clusters using a High Performance Computing (HPC) Terraform template, available on the Oracle Cloud Marketplace. Table 1 gives an overview of the shapes we tested. For a more comprehensive description, see the OCI documentation.
| Table 1: OCI CPU Shapes Tested |
||||
| Compute Shape |
GPUs/node |
GPU Mem./GPU |
Network |
Cluster size |
| VM.GPU.A10.2 |
Two NVIDIA A10 GPUs |
24 GB |
TCP |
1-4 |
| BM.GPU.A10.4 |
Four NVIDIA A10 GPUs |
24 GB |
TCP |
1-4 |
| BM.GPU.L40s.4 |
Four NVIDIA L40 S GPUs |
48 GB |
TCP |
1 |
| BM.GPU4.8 |
Eight NVIDIA A100 GPUs |
48 GB |
ROCE |
1-4 |
| BM.GPU.A100-v2.8 |
Eight NVIDIA A100 GPUs |
80 GB |
ROCE |
1 |
| BM.GPU.H100.8 |
Eight NVIDIA H100 GPUs |
80 GB |
ROCE |
1 |
| BM.GPU.H200.8 |
Eight NVIDIA H100 GPUs |
141GB |
ROCE |
1 |
We carried out both single-node and multi-node benchmarks with dedicated systems configured with Ubuntu 24.04.02 and the NVIDIA CUDA ® Toolkit 12.6, using all of the available GPUs for the benchmarking. We carried out the multi-node tests based on system availability during the benchmarking period. The first two multi-node systems were networked with a 50 Gbps TCP based Ethernet. The BM.GPU4.8 cluster was networked with an ultralow latency 200-Gbps RDMA over converged Ethernet (RoCE) v2 network. While the network latency for the shapes equipped with the ROCE networking is uniform in the 1.6-2.0 usec range, the network latency for the TCP networked nodes can vary based on the shape location within the cloud region where performance can vary, and results obtained for these systems should be considered as more advisory. For our benchmarks, we place the compute shapes in the same availability-domain and fault-domain to minimize performance scatter and observed an inter-node latency of typically 20-80 usec. We used a pre-release version of nanoFluidX 2025.0 for all benchmarks. We obtained the benchmark datasets used in this study from Altair including:
| Table 2: Benchmark Cases |
|
| Case |
Fluid particles |
| E-Gearbox |
6.5m |
| AeroGearbox |
21m |
| Dambreak-S |
7m |
| Dambreak-L |
54m |
| Vehicle Wading |
11m |
Analysis
Single Node testing
Chart 1 shows the single node results we obtained for the various datasets.
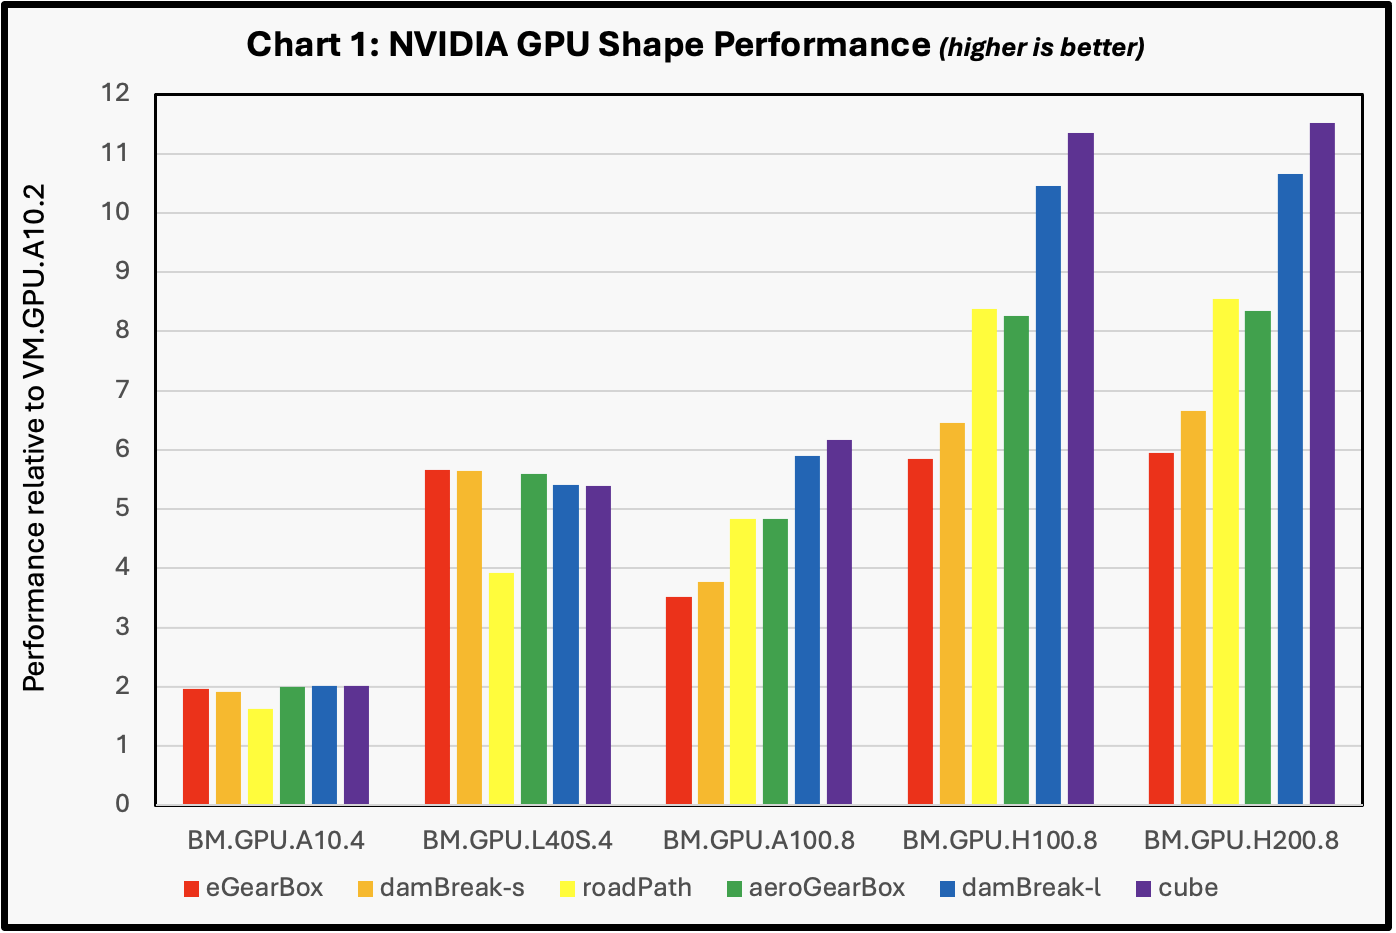
The performance values were extracted from the job wall clock time, as specified in the output listing. The performance reference for Chart 1 was taken from the results obtained with the VM.GPU.A10.2. The results for both the BM.GPU.4.8 and the BM.GPU.A100-v2.8 system based on 40GB and 80GB GPU memory NVIDIA A100 GPUs were equivalent and listed as “BM.GPU.A100.8”. While the datasets ranged in size, all cases demonstrated a near linear speedup when run on the 4-GPU BM.GPU.A10.4 shapes, as compared to the baseline 2-GPU VM.GPU.A10.2. The BM.GPU.L40 S .4 shape demonstrated very good performance over the range of cases. They easily surpassed the performance of the 4-GPU BM.GPU.A10.4 by a factor of about 2.5X and even outperformed the performance of the 8-GPU BM.GPU.A100-v2.8 shapes in all but the largest test cases. The BM.GPU.H100.8 and BM.GPU.H200.8 shapes showed nearly identical performance, and close to twice the performance of the BM.GPU.A100-v2.8 shape.
Multi Node testing
The results obtained from the multi-node testing were mixed. In general, multi-node parallel speedup is related to the relative performance of the individual nodes and the network connecting them: the faster the network the better the parallel speedup and the faster the compute node, the worse the parallel speedup. As a result, the elapsed time to carry out the job is of more use than the rate of multi-node parallel speedup. For the cases we tested, the best performance was obtained by focusing on running on the most powerful shapes, and this tends to be the best option for production workloads. However, cost is often a critical component in engineering analysis, and engineers are typically challenged to balance system performance with cost. We explore this tradeoff for the various shapes in Chart 2.
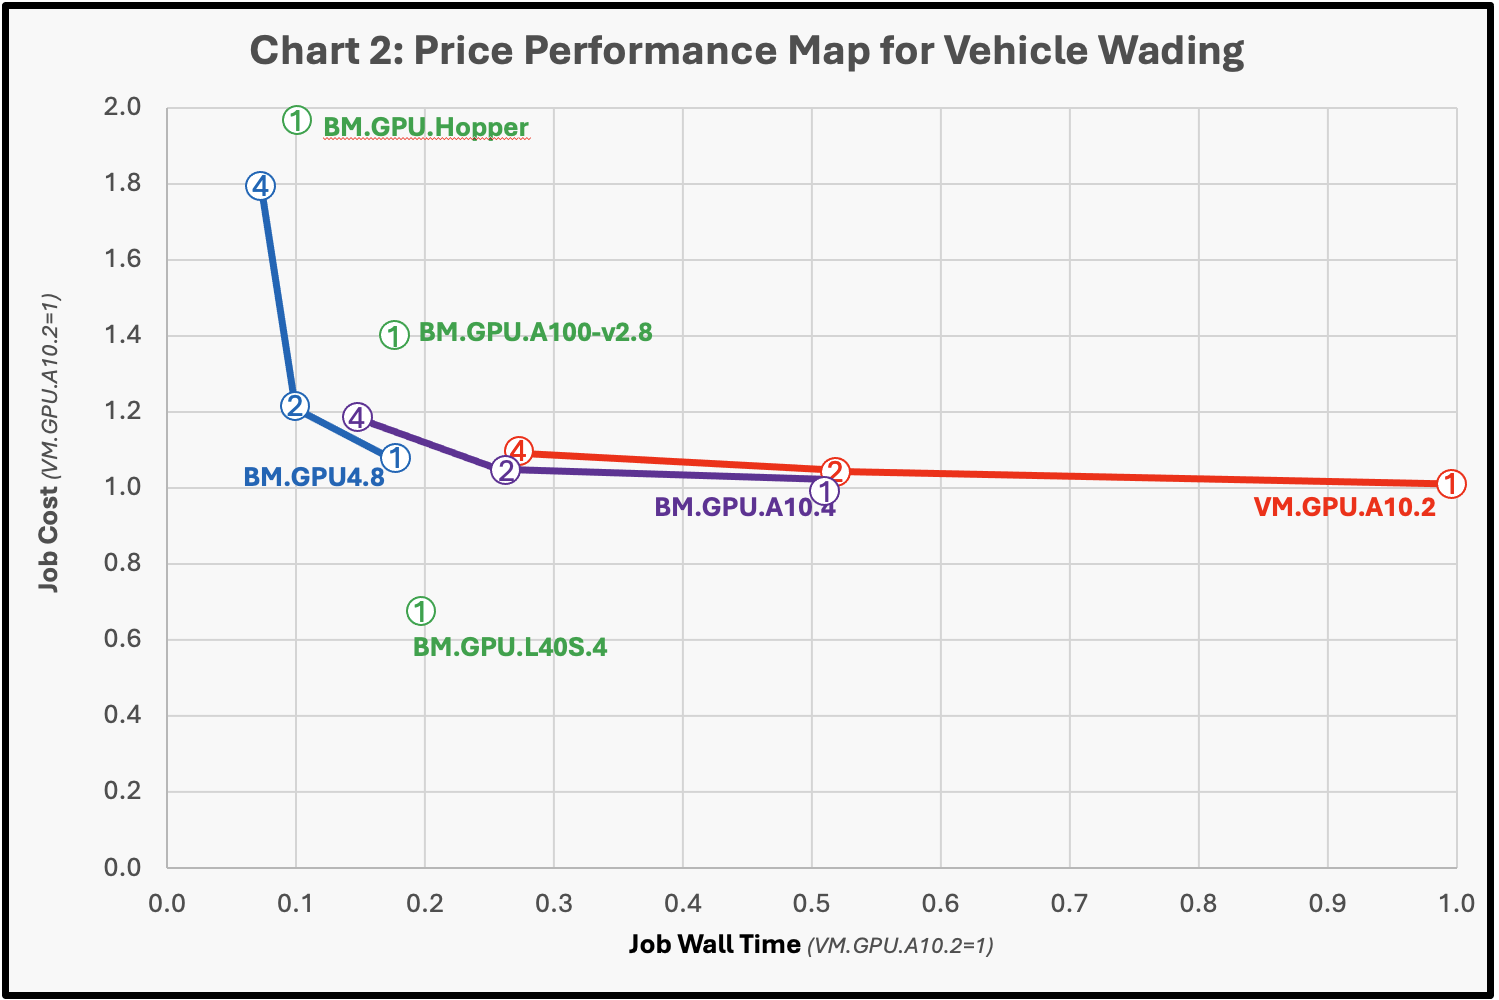
Here, the map represents both the job cost and the wall time to carry out the Vehicle Wading test case, where the wall time is on the horizontal axis (VM.GPU.A10.2=1.0). The cost per job is displayed on the vertical axis, which is based on the product of the shape cost as given on the OCI web site and the time to carry out the job using the VM.GPU.A10.2 as the reference. The number of compute shapes used for the test are noted in the circles with lines connecting the different number of nodes used within the cluster for the test. With perfect speedup the lines should be horizontal . The performance and cost for the BM.GPU.H100.8 was indistinguishable from the of the BM.GPU.H200.8 and both are listed as BM.GU.Hopper.
Even with its 50gbps TCP network, the VM.GPU.A10.2 4-node cluster displayed near linear speedup for this test case and the BM.GPU.A10.4 cluster showed near linear speedup as well through two nodes, with a modest performance drop-off at 4 nodes. Indeed, the results for the systems with 8 total NVIDIA A10 GPUs (4-node VM.GPU.A10.2 and 2-node BM.GPU.A10.4) displayed almost identical performance. The much more powerful BM.GPU4.8 cluster displayed only a modest speedup from one to two nodes and minimal speedup from two to four nodes even with its much faster 200 Gbps ROCE network but a single node offered nearly comparable job cost and performance compared to the 4-node BM.GPU.A10.4 cluster. More powerful nodes require much bigger models to take advantage of the compute capacity and the tested models are of typical industrial size. We expect to see the industrial cases increase in size and resolution as multi-node GPU systems becomes more accessible.
While the BM.GPU.L40 S shape is not as fast as the shapes with 8 GPUs, its overall job cost is significantly better than all the other shapes making it the likely preferred choice for use for all but the most demanding jobs where job turnaround time is most critical. For those jobs, either the BM.GPU.H100.8 or the BM.GPU.H200.8 would likely be favored. Both shapes offered similar performance and cost for the jobs we tested, but for larger jobs, the BM.GPU.H200.8 may be preferred over the BM.GPU.H100.8 due to its larger memory size (141GB vs. 80GB).
Conclusion
While nanoFluidX performs well on all the GPU based shapes we tested at OCI, our results indicate that currently the BM.GPU.L40 S shape probably offers the best balance on performance and cost for the cases we tested. For larger models, the 8-GPU based shapes may be a more practical solution and for very large cases, multi-node systems may be helpful to reduce total run time. We encourage nanoFluidX users to test their workloads at Oracle Cloud Infrastructure with a 30-day free trial.
For more information, see the following resources: