A split‑second decision can make or break user experience.
Every millisecond counts when your SaaS platform serves real‑time dashboards, personalized feeds, or checkout flows. In‑memory stores such as Redis—and its community fork, Valkey—deliver the sub‑millisecond latency these experiences demand. But what happens when success forces you to run hundreds of microservices, each insisting on its own cache? Spinning up thousands of tiny Valkey or Redis nodes is expensive and difficult to monitor.
What you’ll learn in this article
In this behind‑the‑scenes look at Oracle Cloud Infrastructure (OCI), we explain how our engineers consolidated many small Valkey instances into larger shared nodes while minimizing impact to isolation, performance, or visibility. You’ll discover:
The trade‑offs between one‑cache‑per‑app and shared‑cache models
How custom Valkey modules written in Rust expose per‑application metrics—keys, memory, connections, and commands—in near real time
The business impact of improved observability: lower costs, faster troubleshooting, and predictable SLOs
Key takeaway: With the right telemetry, you can run fewer, bigger Valkey servers and still know exactly who is using what.
Why Valkey at scale needs fresh thinking
Valkey (created in 2024 after Redis license changes) inherits Redis’s blazing speed and flexible data structures, but it keeps the same operational model: vertical scaling for memory and horizontal scaling through clustering. Most teams start by assigning each service its own cache—great for isolation, but painful when you grow from ten services to ten thousand.
Operational drag: Maintaining many small caches strains deployment pipelines and backup strategies.
Inefficient spend: Under‑utilized instances waste memory and CPU.
Limited insight: Traditional monitoring shows node‑level metrics, not per‑tenant behavior.
A large SaaS customer running a cell‑based architecture on OCI hit all three pain points. Each customer cell contained multiple microservices, multiplying caches per cell would have meant spinning up tens of thousands of Valkey servers. Both the customer and the OCI operations team needed a better approach.
Sharing Valkey safely: design principles
Key‑prefix isolation – Each microservice prefixes its keys (app1:*, orders:*, and so on). Valkey Access Control Lists (ACLs) ensure a service can operate only on its own prefix.
Built‑in telemetry – Metrics must be collected inside the Valkey.
Minimal overhead – Observability code runs in lightweight background threads and uses sampling when key counts grow large.
Open-source alignment – Implementations rely on the Valkey Modules API so they remain compatible with community releases.
Extending Valkey with Rust modules
Modules were first introduced in Redis in 2017 and are fully supported in Valkey. Modules allow developers to add new functionality and/or override default Valkey features without forking the code base. A module is a dynamic linked library (DLL on Windows, .SO on Linux, dylib on MacOs).
Collects per‑prefix key and memory statistics directly inside the Valkey process.
Tracks active connections and command counts for each ACL user.
Publishes these metrics through an extra section in the INFO command—which makes it consumable by OCI Monitoring and Grafana.
Bringing observability to life
Metric
How it’s captured
Business Value
Keys per prefix
Background scan (+ sampling)
Forecast capacity, detect rogue growth
Memory per prefix
MEMORY USAGE during scan
Prevents noisy-neighbor out-of-memory events
Connections per ACL user
Parsed from CLIENT LIST
Spot connection leaks early
Commands per user
Real-time command filter
Understand traffic mix
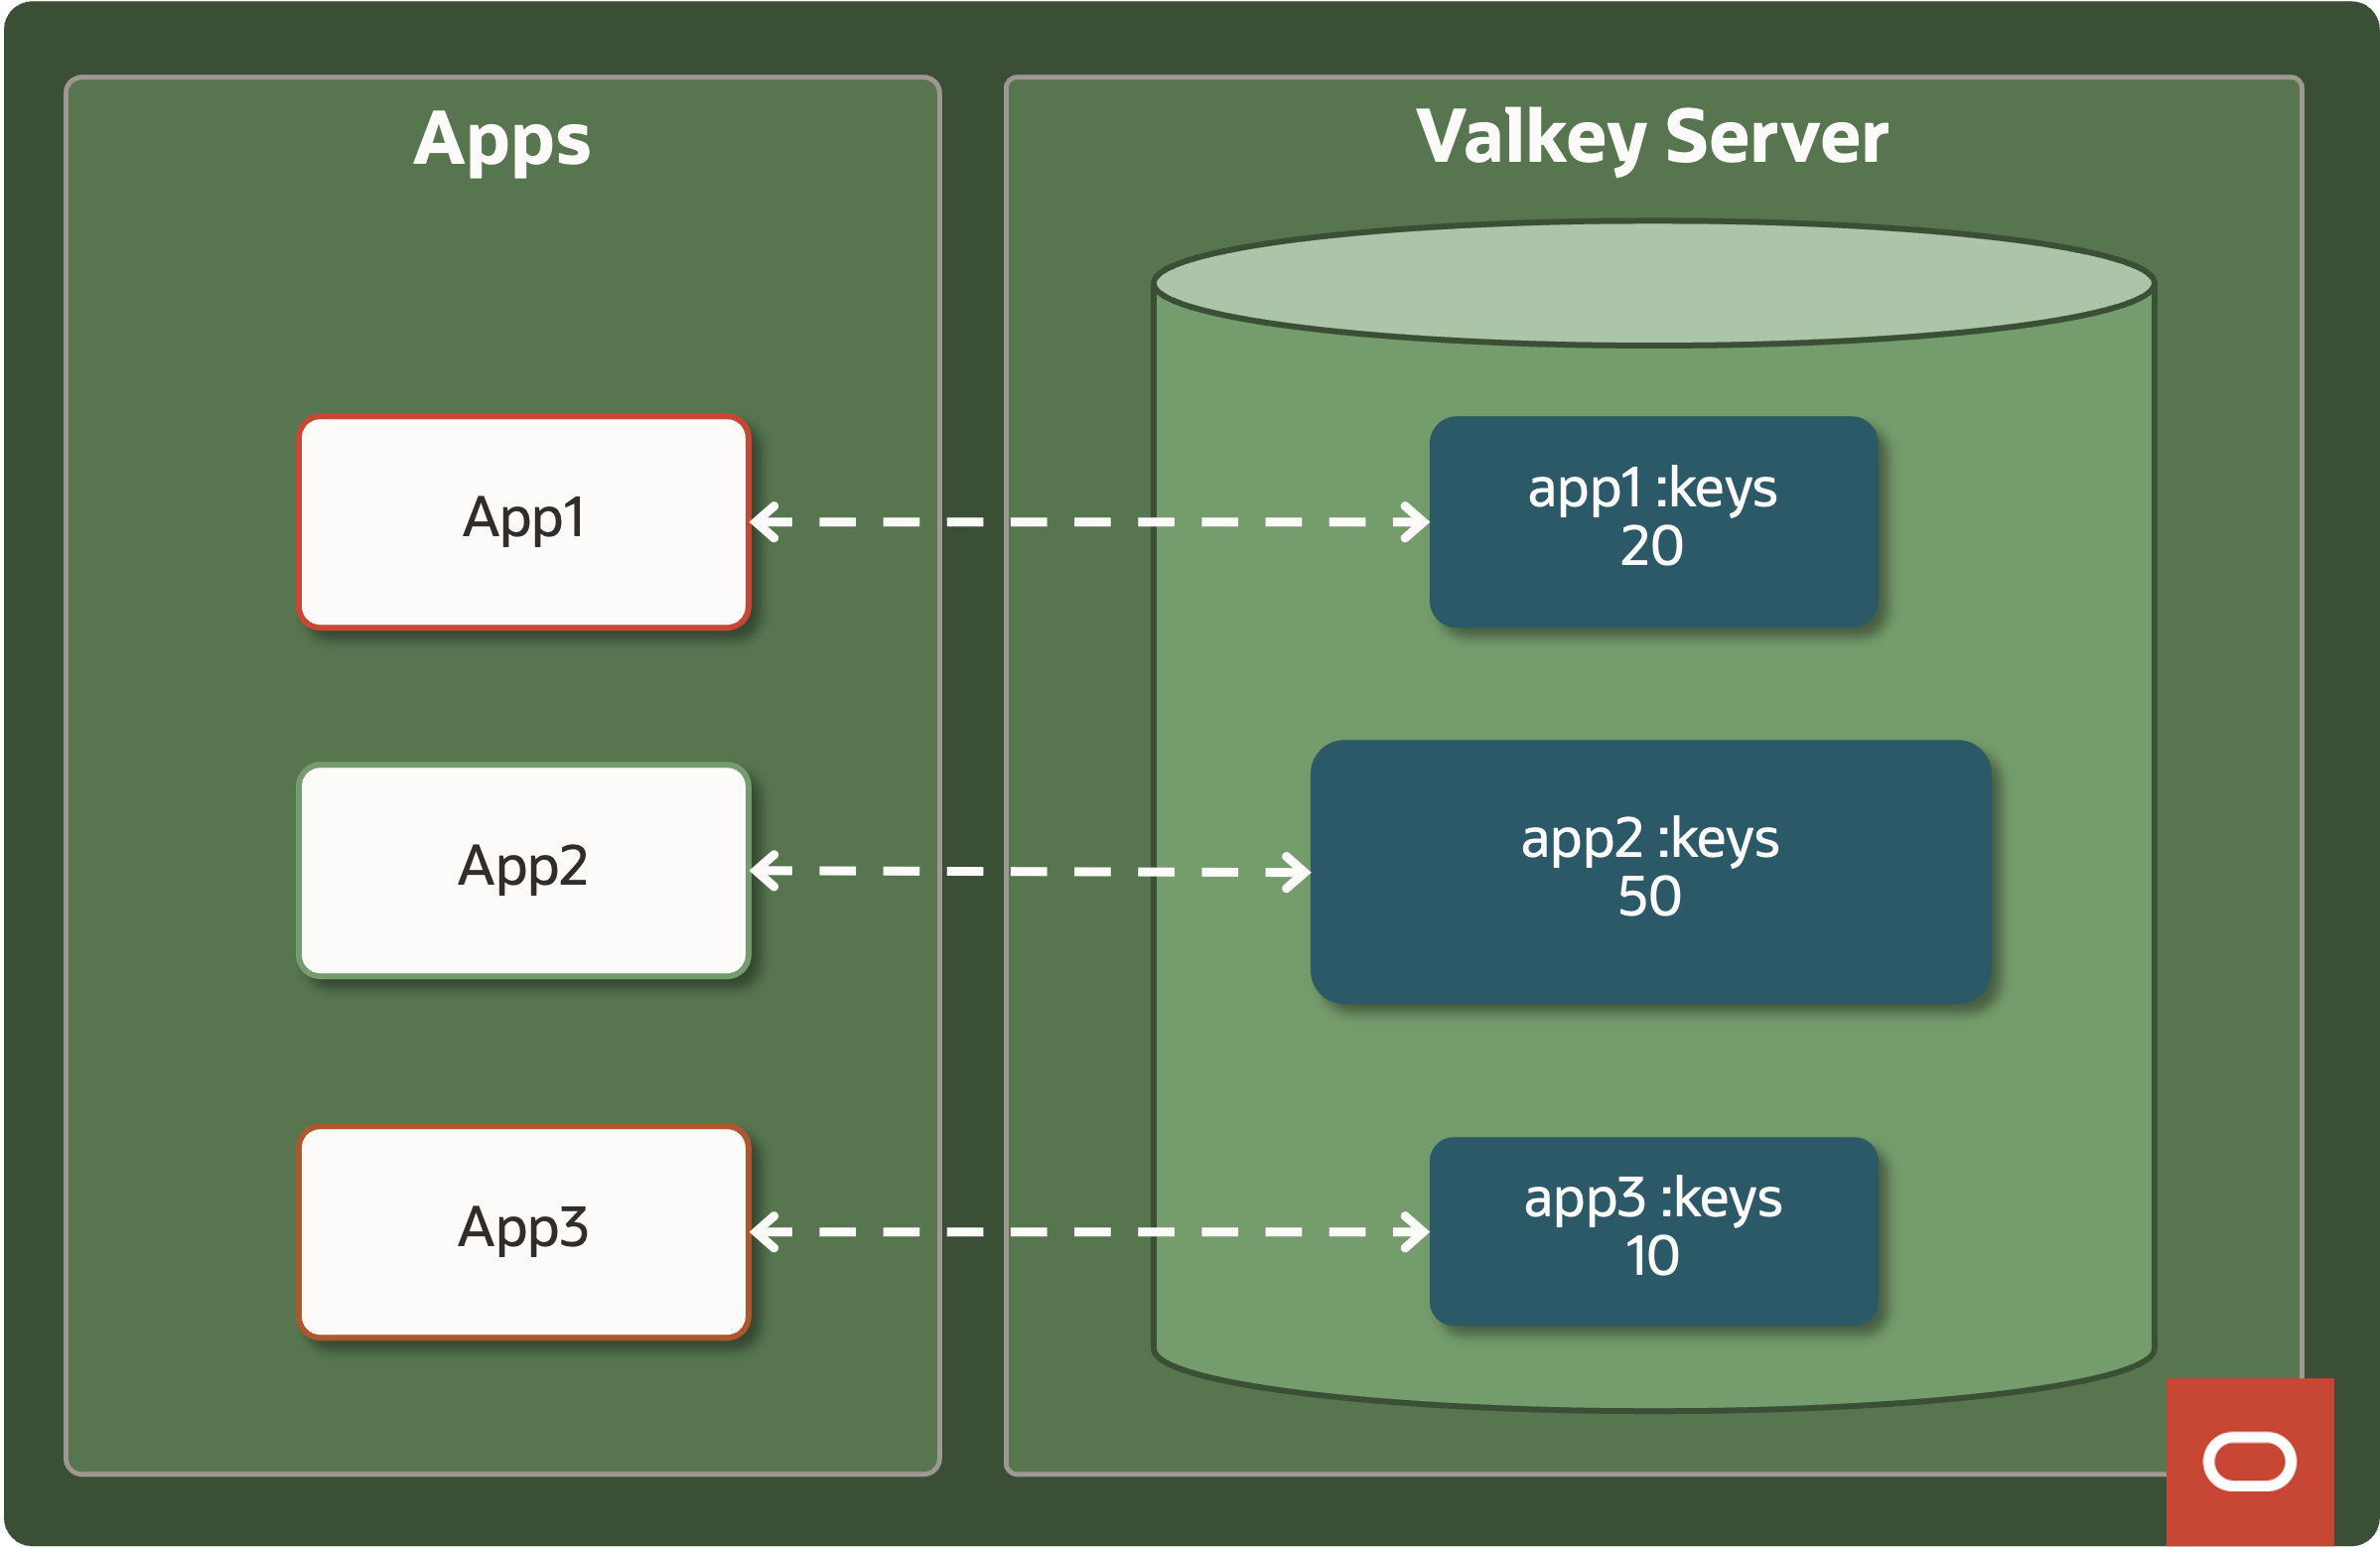
Tracking number of keys and memory used per keyspace
Each micro-service was using a dedicated username (APP1, APP2, …) leveraging Valkey Access Control Lists with granular permissions. A common pattern with ACLs is to restrict usernames to only perform operations on keys in specific keyspace. That can be accomplished by structuring keys to begin with a certain prefix followed by a separator (“:” or “-“). APP1 would only be allowed to access “app1:*” keys, APP2 would access “app2:*” and so on.
We can use this pattern to calculate how many keys are present in each keyspace and how much memory they are consuming.
Execute MEMORY USAGE command to determine memory used by each key and increment KEYSPACE_MEMORY_USAGE_BYTES {app1: 10000, app2: 20000, …}
This solution works but it does not scale plus it’s rather cumbersome to implement in a monitoring system.
We can address these problems by building a Valkey module to do the work inside Valkey server process and take advantage of Valkey serverCron process to periodically regenerate these numbers. The tradeoff is that there will be slight latency in the metrics but usually a short delay is acceptable.
Valkey Module Rust SDK provides a nice abstraction using Rust macros to run our custom code. We use cron_event_handler to update custom data structures KEYSPACE_COUNT_KEYS and KEYSPACE_MEMORY_USAGE_BYTES which are stored inside Valkey process.
Data sampling
One of the challenges of this approach is that running these calculations can put too much load on the server and impact the performance. Even if we run it via background thread it still needs to read the keys to get the proper count and memory usage. We decided to make a trade off. When there were only a few thousand keys we looped through all of them to get precise metrics. But with large numbers of keys, we would sample specific % of the total keys (decreasing the % as the number of keys increased) and estimating the total stats based on that. Given large number of keys and making our samples random it gave us good overall average numbers.
Tracking connections per user
Another useful metric is how many current connections each username has. At smaller scale this can also be done client side:
Loop the output parsing the string looking for user
Increment USERNAME_CLIENTS_COUNT
This solution also works until you have tens of thousands of clients at which point running this frequently can impact other operations. And it also requires each monitoring system to implement logic separately.
We can extend the cron_event_handler approach above to do these calculations at regular intervals looping through CLIENT LIST and updating USERNAME_CLIENTS_COUNT.
Tracking operations per username
This is the most crucial metric as simply having connections or storing data is not as important as actively executing commands to read/write data. And unlike previous metrics this is simply not possible to do client side and must be done via a module. We will be leveraging several new concepts.
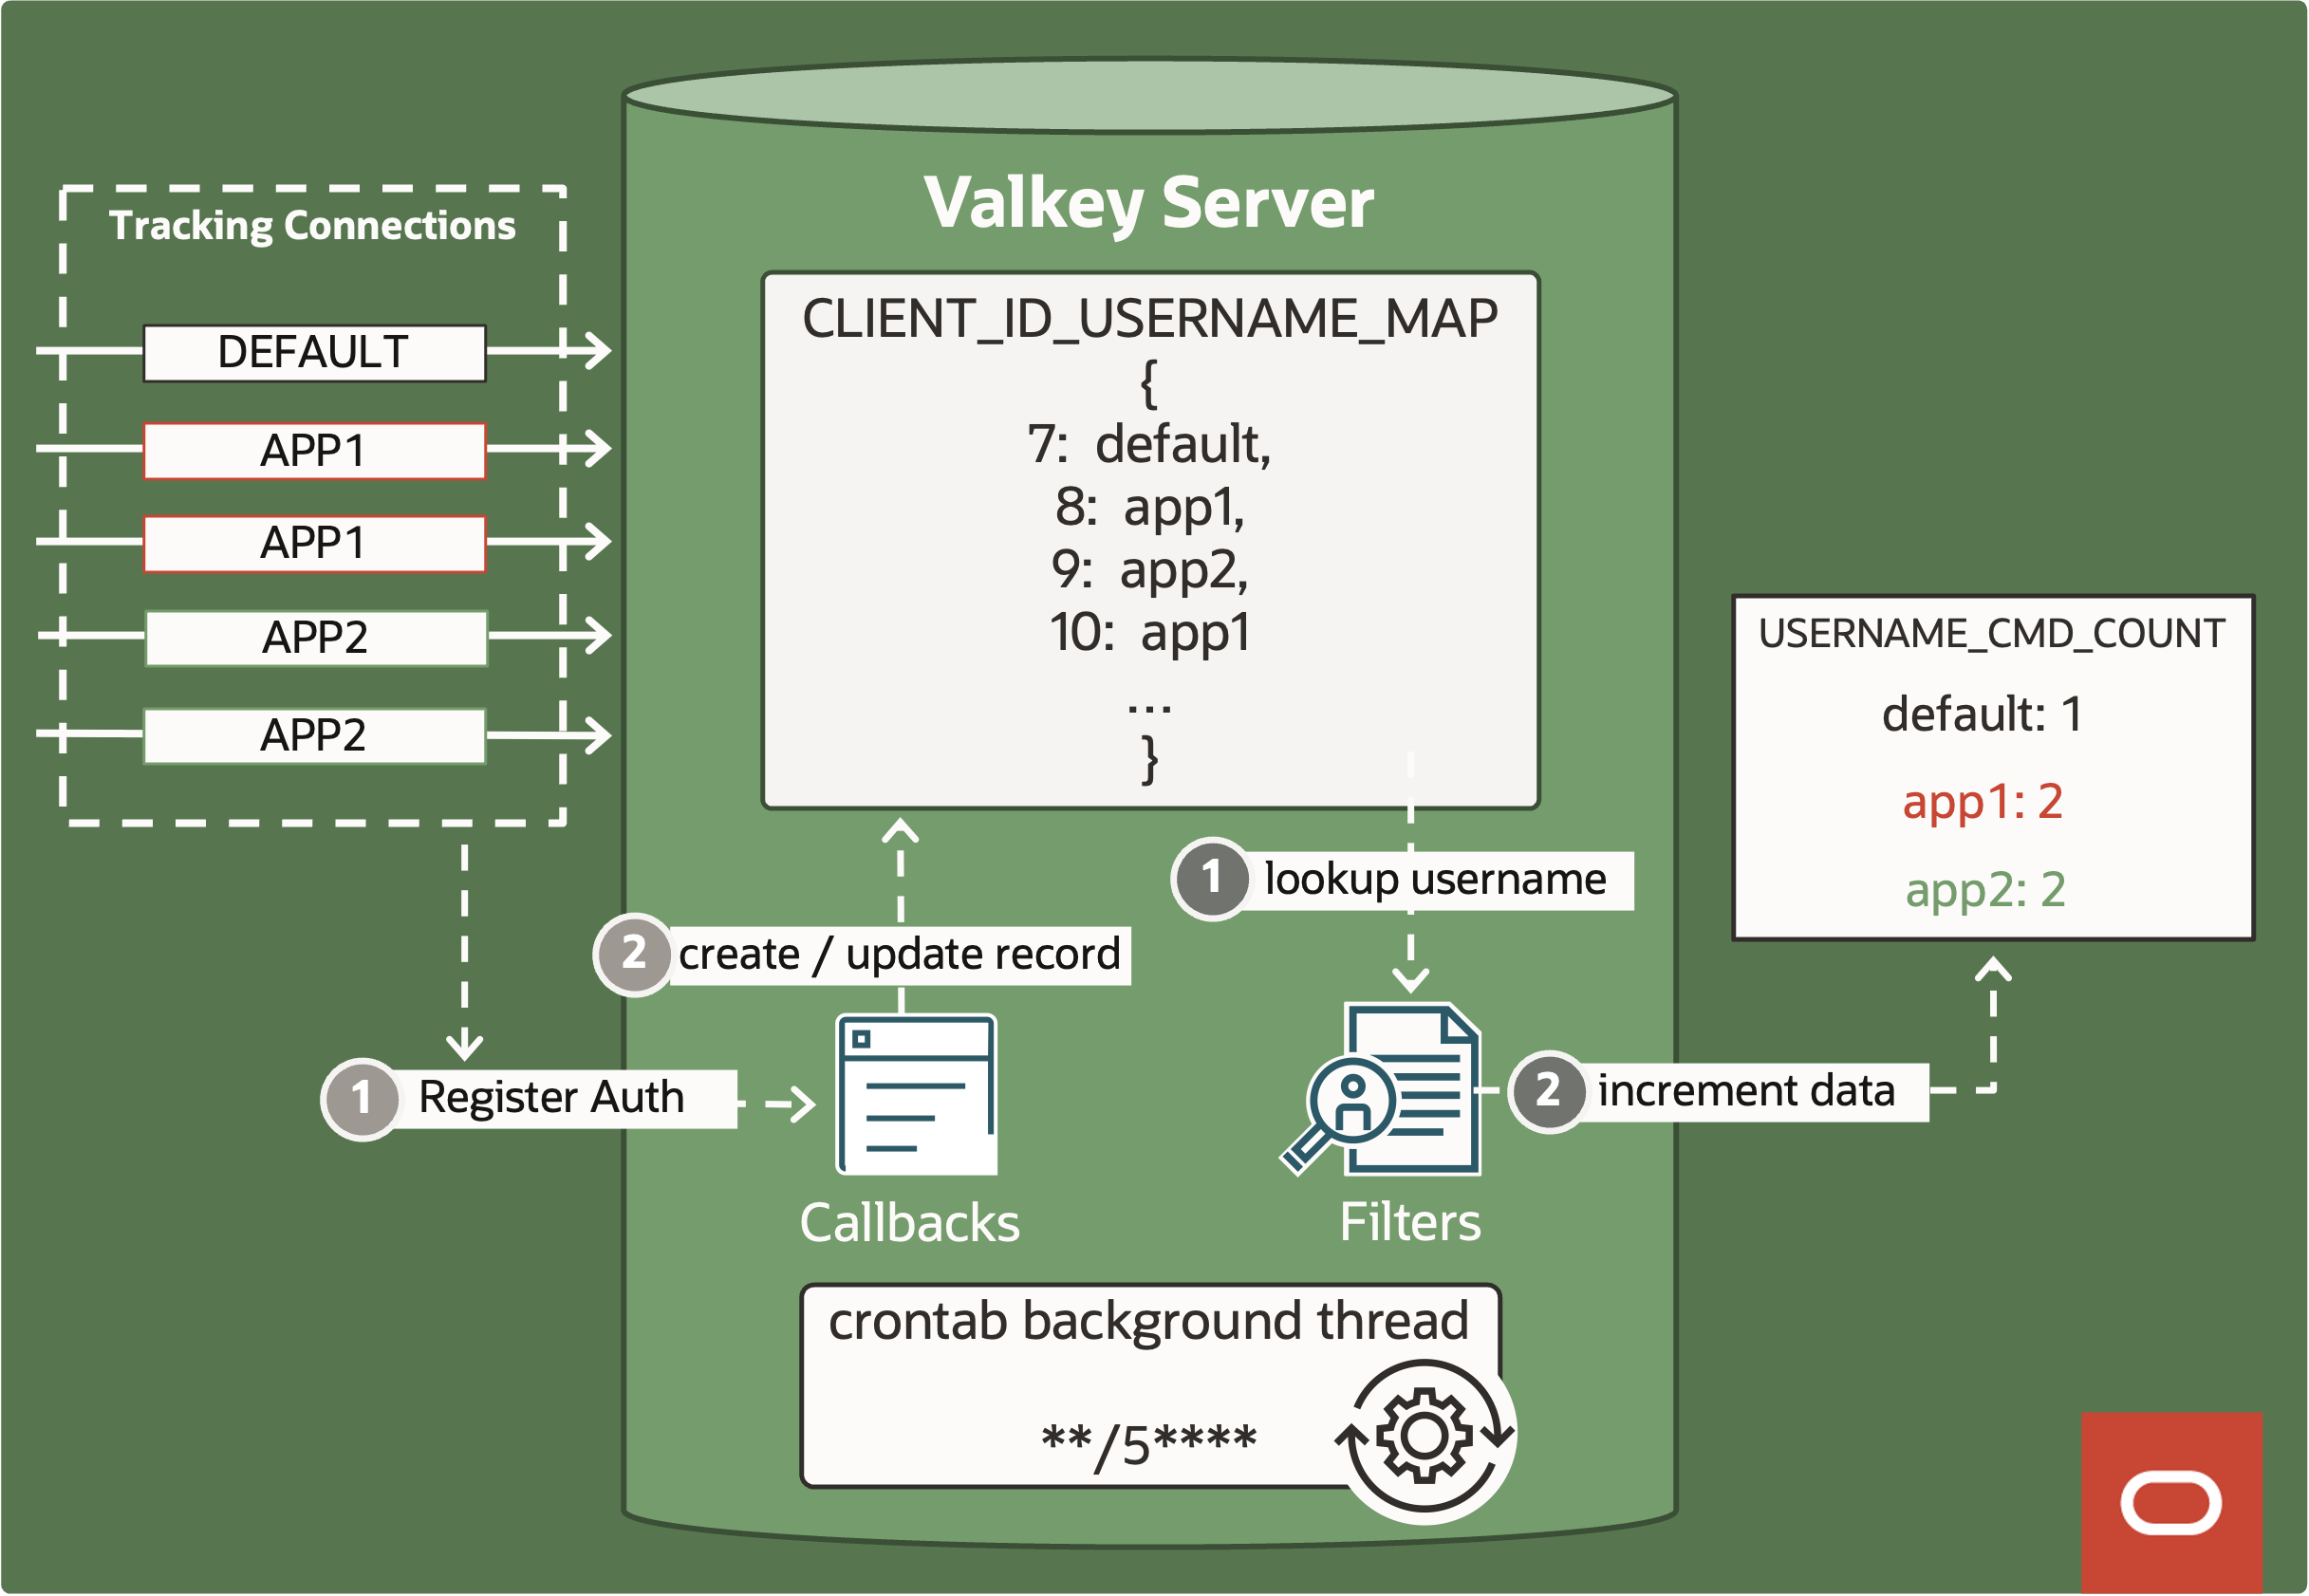
Callbacks
ValkeyModuleAuthCallback gives access to two important attributes: client_id and username. We look up the current username using ValkeyModule_GetClientUserNameById. We also know the new username the client is trying to authenticate as. If auth is successful we create / update record in global CLIENT_ID_USERNAME_MAP {3: app1, 4: app2, 5: app1, …}.
We can also convert code for CLIENT LIST approach above to update USERNAME_CLIENTS_COUNT, so this data becomes real time.
Filters
Valkey module command filters are executed before every command so they need to be used carefully to not slow down the server. But we can use them to increment USERNAME_CMD_COUNT to keep track of the number of commands executed by each username.
The limitation is that Valkey filters cannot access current username. However filters can access the current unique client_id. We can use client_id to look up corresponding username in CLIENT_ID_USERNAME_MAP created via auth callback.
Server events
Some applications use both authenticated users (APP1, APP2, …) and DEFAULT Valkey user. DEFAULT user never authenticates so we cannot rely on ValkeyModuleAuthCallback to update CLIENT_ID_USERNAME_MAP. But we can leverage ValkeyModuleEvent_ClientChange which supports Connected and Disconnected subevents:
Connection connects – this is before authentication happens, so we know that user is DEFAULT.
Client disconnects – at this point we already know the authenticated user
Exposing custom metrics
Valkey has INFO that exposes default server metrics and is often used by monitoring systems. We can extend INFO in our module to include custom section to expose this data.
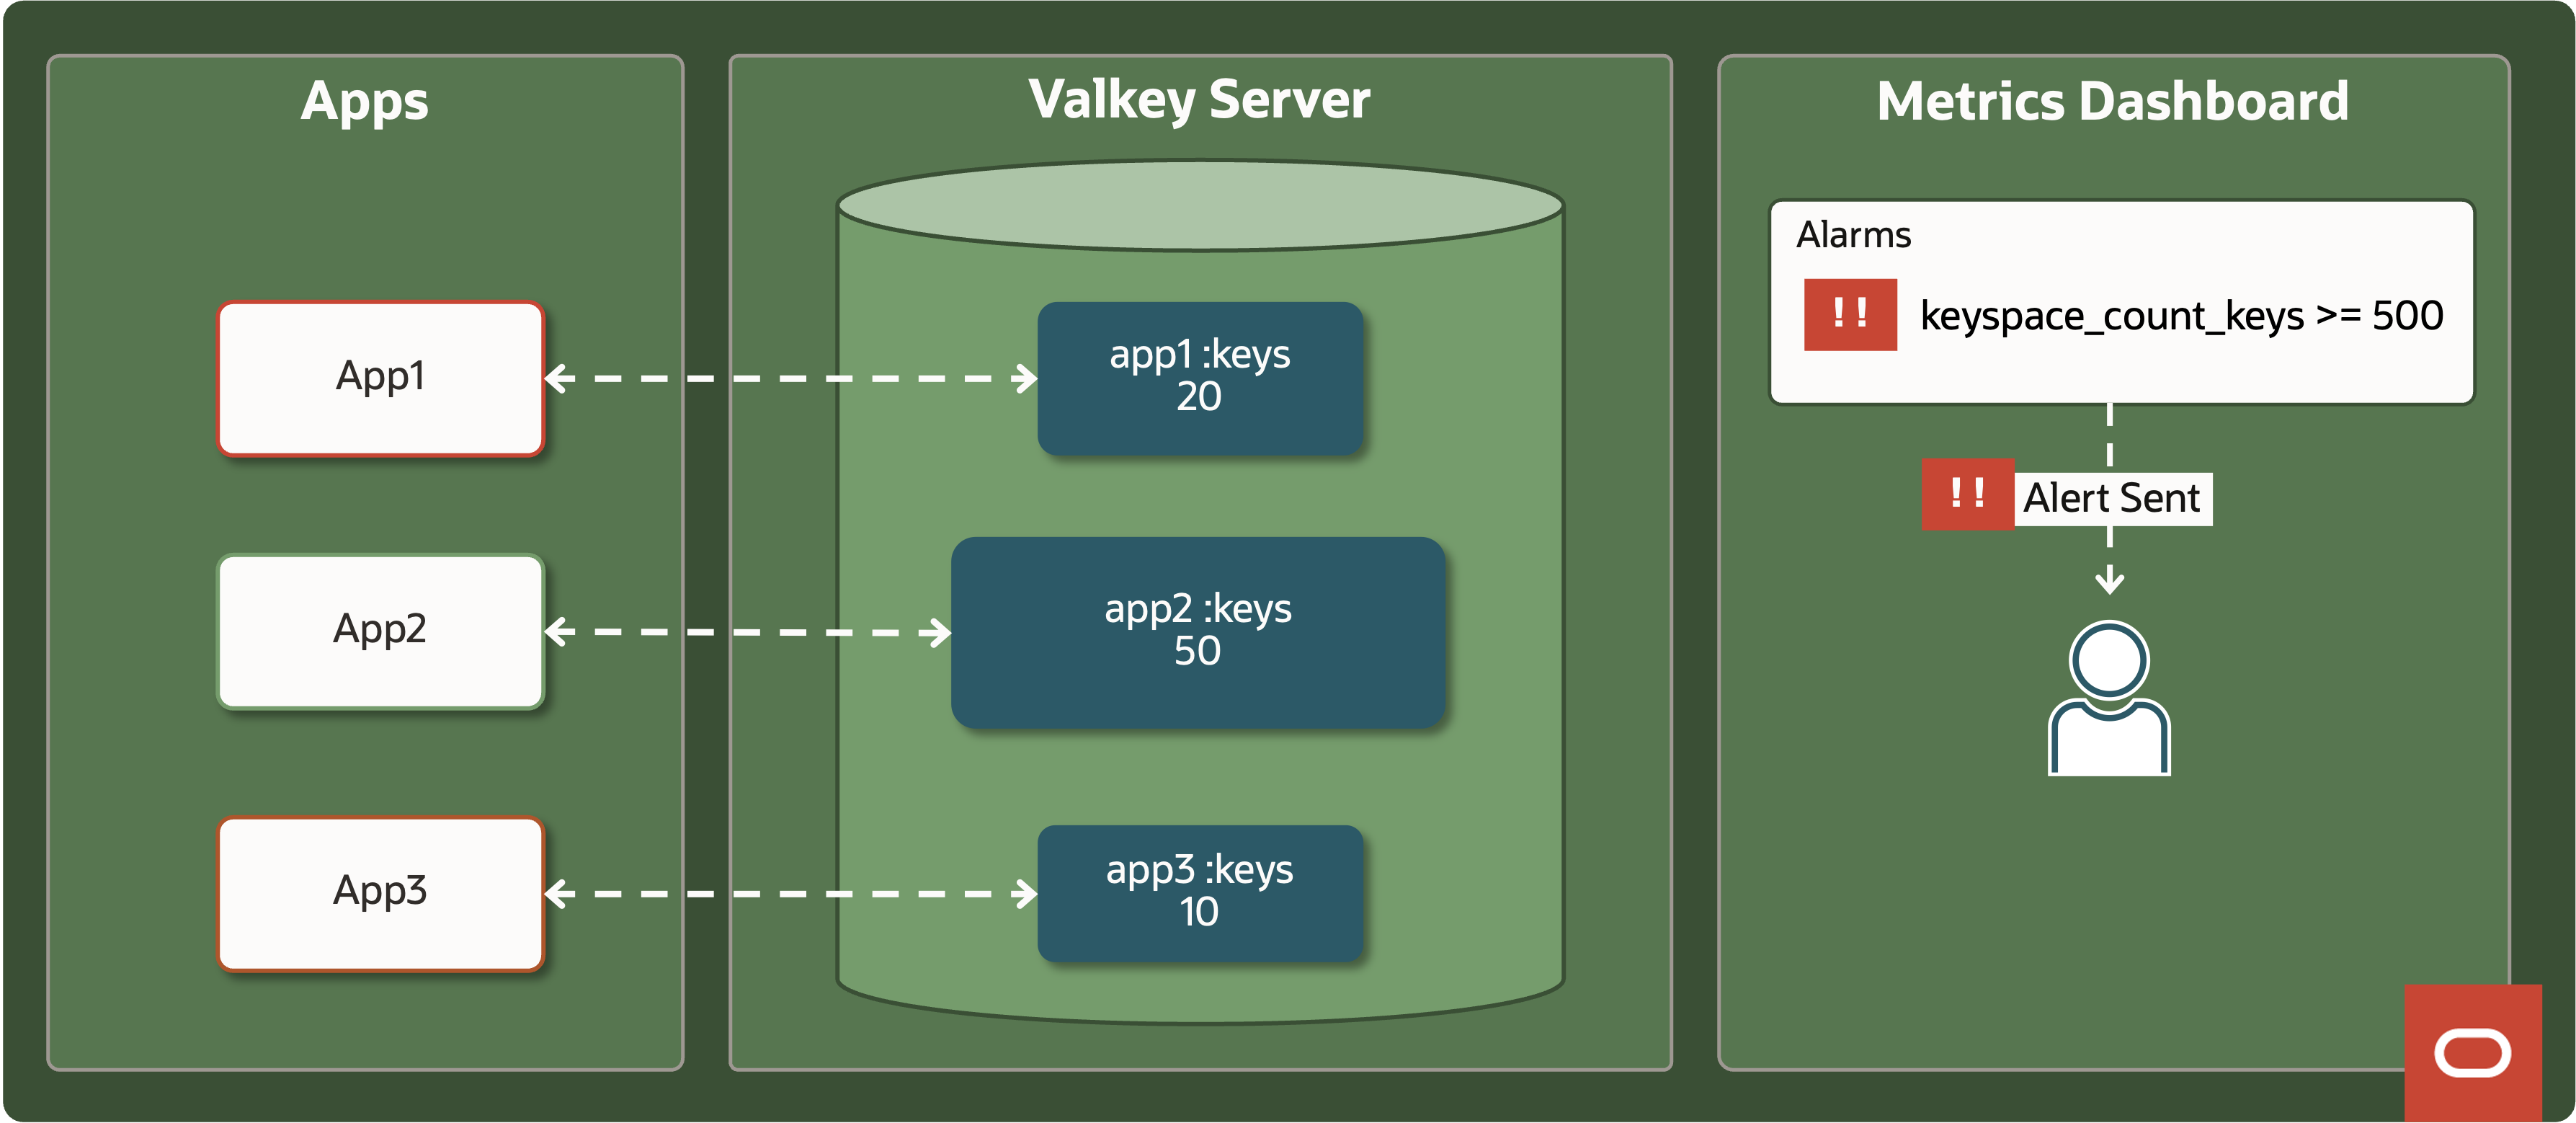
All metrics can be extracted by various tools so customer’s DevOps teams can:
Create alarms—“Alert if any keyspace exceeds 500 MB”
Feed dashboards that correlate cache usage with application releases
Results: fewer servers, happier customers
Consolidating many small caches into larger shared Valkey clusters delivers tangible benefits:
Lower infrastructure footprint – memory and CPU are pooled instead of over‑provisioned across numerous tiny nodes.
Straightforward scaling – add RAM as demand grows rather than maintaining an ever‑expanding fleet.
These advantages flow directly from the built‑in metrics and isolation techniques discussed above.
Next steps
Scaling Valkey for hundreds of applications no longer requires a sprawling cache fleet. If you operate multi‑tenant or microservice architectures, consider adopting this shared‑server model—and explore how Valkey modules can surface the metrics your business cares about.
For more information or to join a discussion, see the following resources:
Dmitry Polyakovsky is a seasoned software engineer with over 15 years of experience in building complex software systems across a diverse range of companies, from startups to large enterprises. He has extenstive expertise in designing and implementing scalable, high-performance solutions that drive business success. Dmitry currently serves as the Tech Lead for the OCI Cache service and is actively involved in Valkey.io project.