

By Muneer Mirza, Arnab Saha, and Calvin Weng
As enterprises run applications and databases across cloud environments, investigating performance changes requires visibility across those environments. An application slowdown may prompt teams to examine application behavior, infrastructure capacity, and database activity over the same period. For customers adopting Oracle AI Database across OCI, AWS, Azure, and Google Cloud, bringing those signals into familiar monitoring workflows helps application engineers and database administrators work from shared context.
Oracle AI Database Multicloud offerings give customers more choice in where they run their database workloads. Integrations with existing operational tools help make that choice practical. Customers can already monitor Oracle database workloads in OCI with Datadog. Dedicated integrations for Oracle AI Database@AWS, Oracle AI Database@Azure, and Oracle AI Database@Google Cloud extend that approach, bringing supported database metrics into the platform these customers use to monitor their applications and infrastructure.
Bring Oracle database activity into the investigation
Consider a retailer running its checkout application on AWS, with Oracle AI Database@AWS supporting its transactions. During a seasonal traffic peak, checkout response times begin to increase. Application engineers need to understand whether the slowdown coincides with changes in database demand, while database administrators need to see how the workload behaved during the affected period.
The retailer already monitors its application and AWS infrastructure in Datadog. With the Oracle Database at AWS integration configured, the teams can also review the database metrics available for their deployment. Depending on the database service and resource, these can include CPU utilization, transaction activity, SQL executions, sessions, and running or queued statements.
An Oracle-focused dashboard brings those signals together, giving both teams a shared view of database resource utilization and workload activity.
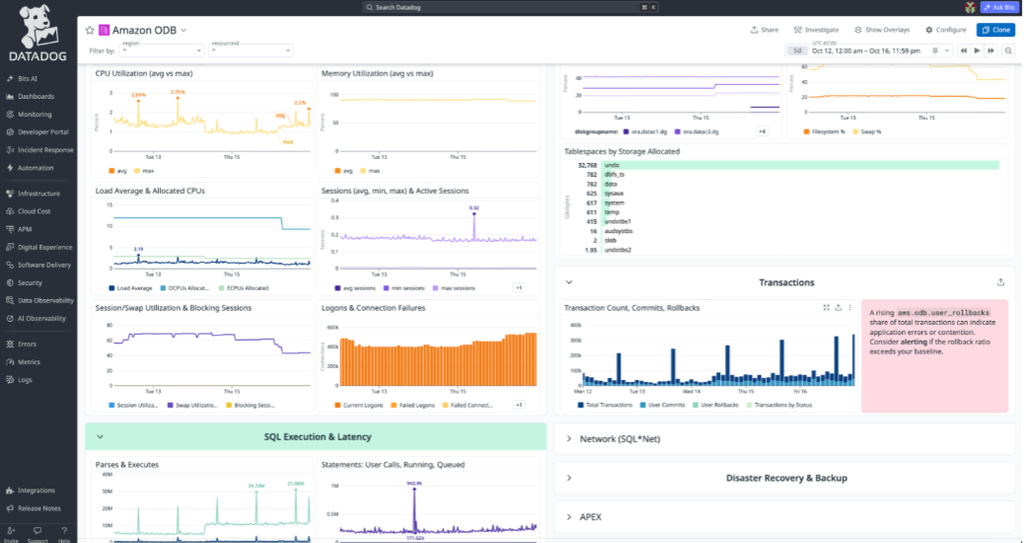
Figure 1. An Oracle Database at AWS dashboard in Datadog brings database resource utilization and workload activity into a shared monitoring view.
Teams can compare these database trends with the application performance data they already collect in Datadog. If database demand and statement queueing increase during the same interval as checkout latency, the teams have a reason to investigate those changes more closely. If the collected database metrics remain stable, that evidence can help guide their next checks across the application and infrastructure. By correlating metrics, logs, and traces, application engineers and database administrators can trace a stack flow end-to-end to identify the root cause of the slowdown.
Maintain visibility as your Oracle cloud footprint grows
The operational need extends beyond a single deployment. As customers adopt Oracle AI Database in additional cloud environments, teams need to identify the resources supporting each application and understand how those workloads change over time.
For customers using Datadog, the corresponding Oracle integrations bring supported metrics from those deployments into an established monitoring workflow. A custom Datadog dashboard can organize collected signals by cloud environment, database resource, or application workload. Clear labels help teams find the relevant deployment and review its activity in context.
Metric availability varies by integration, database service, and resource type. Teams should select the signals that answer their operational questions for each deployment. As their Oracle AI Database footprint expands, they can extend that monitoring approach to additional environments while retaining familiar practices for reviewing workload behavior.
Add query-level visibility when needed
Cloud service metrics provide context about database activity and resource utilization. When an investigation requires deeper query analysis, customers can also configure Datadog Database Monitoring for supported Oracle deployments.
Database Monitoring adds capabilities such as query-level metrics, query samples, wait event analysis, and execution plans. Datadog also documents connecting DBM with Application Performance Monitoring, subject to the applicable tracer and instrumentation requirements. These capabilities require additional configuration beyond the cloud service integrations.
“Our vision for Multicloud is to give customers choice in where they run Oracle AI Database and continuity in how they operate it. Integrations with tools such as Datadog help make that choice practical, giving application and database teams a shared place to understand their workloads as their cloud portfolio grows.”
– Muneer Mirza, Vice President of Product, Multicloud at Oracle Cloud Infrastructure (OCI)
Get started with your Oracle AI Database deployment
For customers already using Datadog, start with the integration for your Oracle AI Database deployment on AWS, Azure, or Google Cloud. Follow the corresponding setup guidance to collect supported database metrics, then add those signals to the dashboards your application and database teams use for day-to-day operations.
Begin with the questions your teams need to answer: how database demand changes during peak periods, whether resource utilization warrants attention, and what database activity coincides with application slowdowns. As you adopt Oracle AI Database in additional clouds, extend that visibility to support the workloads and environments your business depends on. To learn more, please read the Datadog blog.