Logging Analytics is a machine learning (ML)-based tool in Oracle Cloud Infrastructure (OCI) that analyzes all log data from on-premises and multicloud environments for complex analytics, troubleshooting, and visualization across various technology stacks. We can load out logs into Logging Analytics using the Oracle Management Agent, uploading logs on-demand, collecting them from OCI Object Storage, or using Service Connector.
Oracle Cloud Guard is a security tool for cloud posture management. Like any other OCI native service, you can integrate Oracle Cloud Guard with Logging Analytics seamlessly, making a single robust solution for having all the data from different sources for logging consolidation, analytics, alerting, and dashboarding.
Part 1 of this blog post showcases the integration of Oracle Cloud Guard with Logging Analytics using the OCI Streaming service. Coming soon in Part 2, we show the integration of Oracle Cloud Guard with Logging Analytics using the OCI Functions service.
Architecture
The following architecture design outlines the Part 1 approach, which sends Cloud Guard events to Logging Analytics using OCI Streaming. The events from Cloud Guard are available in Events service, which are pushed to Streaming. Service Connector picks up this data from Streaming and sends it to Logging Analytics.
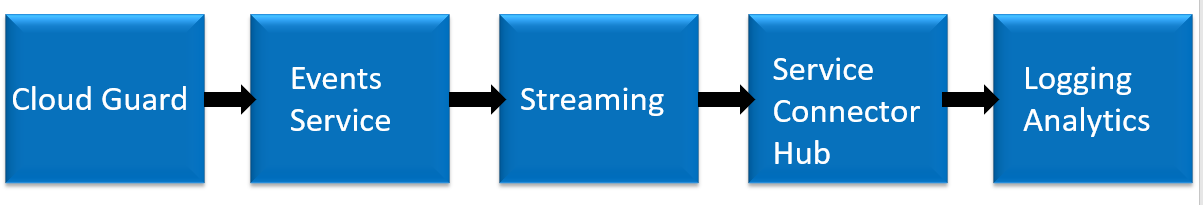
Figure 1: Architecture design to integrate Cloud Guard with Logging
Implementation steps
-
Enable the cloud event rule in the Cloud Guard responder recipe.
-
Create a stream in OCI Streaming.
-
Create a rule in OCI Events as the Cloud Guard event type and provide the stream created in previous step as the action type.
-
Create a log group in Logging Analytics (Optional).
-
Create a log parser and source in Logging Analytics.
-
Create a service connector to send Cloud Guard events from Streaming to Logging Analytics.
Step 1: Enable the cloud event rule in Cloud Guard responder recipe.
-
In the Oracle Cloud Console, under the menu, select Identity & Security, Cloud Guard, and then Targets.
-
Pick the target that we want to push the cloud events to.
-
Select the responder recipe. Enable and save the cloud event rule as shown in Figure 2.
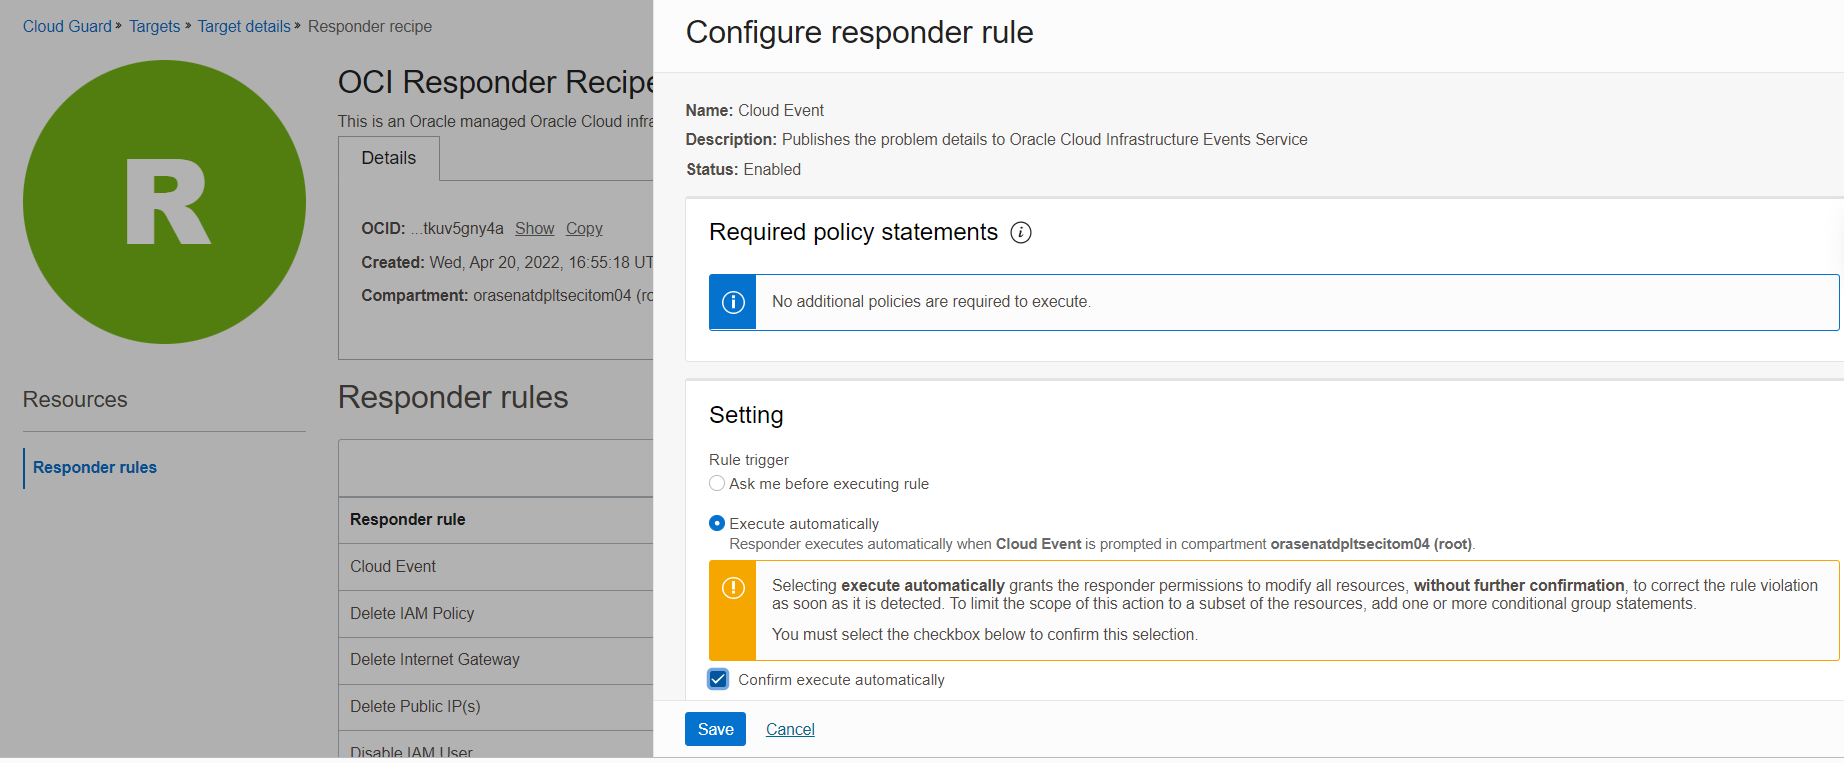
Figure 2: Enable and save cloud event rule in the responder recipe for the target
Step 2: Create a stream in OCI Streaming
-
In the Console, in the menu, select Analytics & AI, Messaging, and then Streaming.
-
Create a stream in the chosen compartment. Here we’re using the default stream pool as shown in Figure 3. You can also create and use a new or existing stream pool.
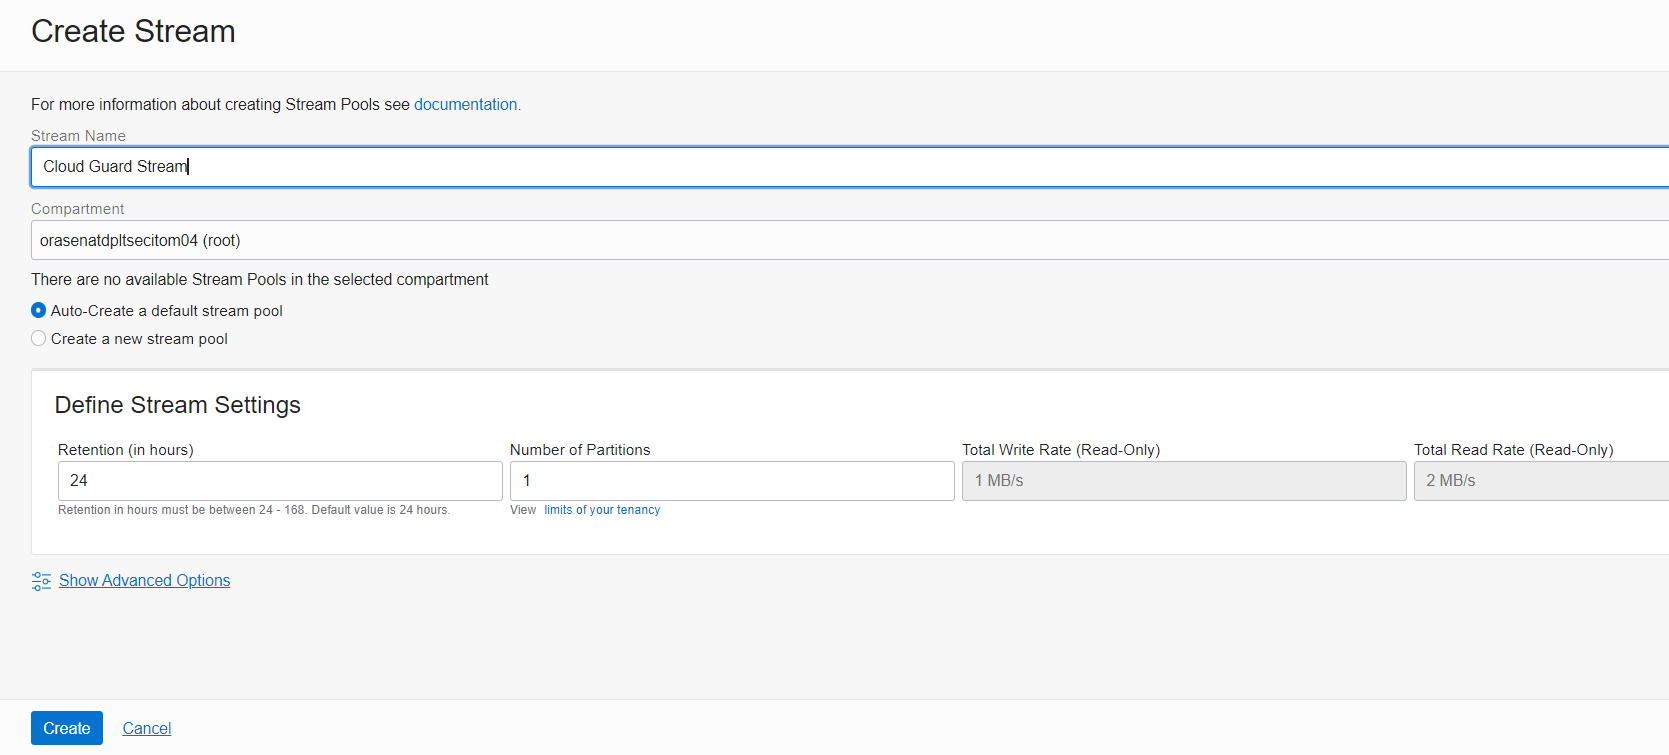
Figure 3: Create a stream with the default pool
Step 3: Create a rule in OCI Events
-
In the Console, under the menu, select Observability & Management and then Events.
-
Create a rule in the compartment and select Cloud Guard as the Service Name.
-
Choose the event types from the exclusive list for Cloud Guard. Here, we’re pushing the events for Status, Detected Problem, Dismissed Problem, and Remediated Problem to Streaming.
-
Choose Streaming the action type and the stream that we created in Step 2. Click Create Rule.
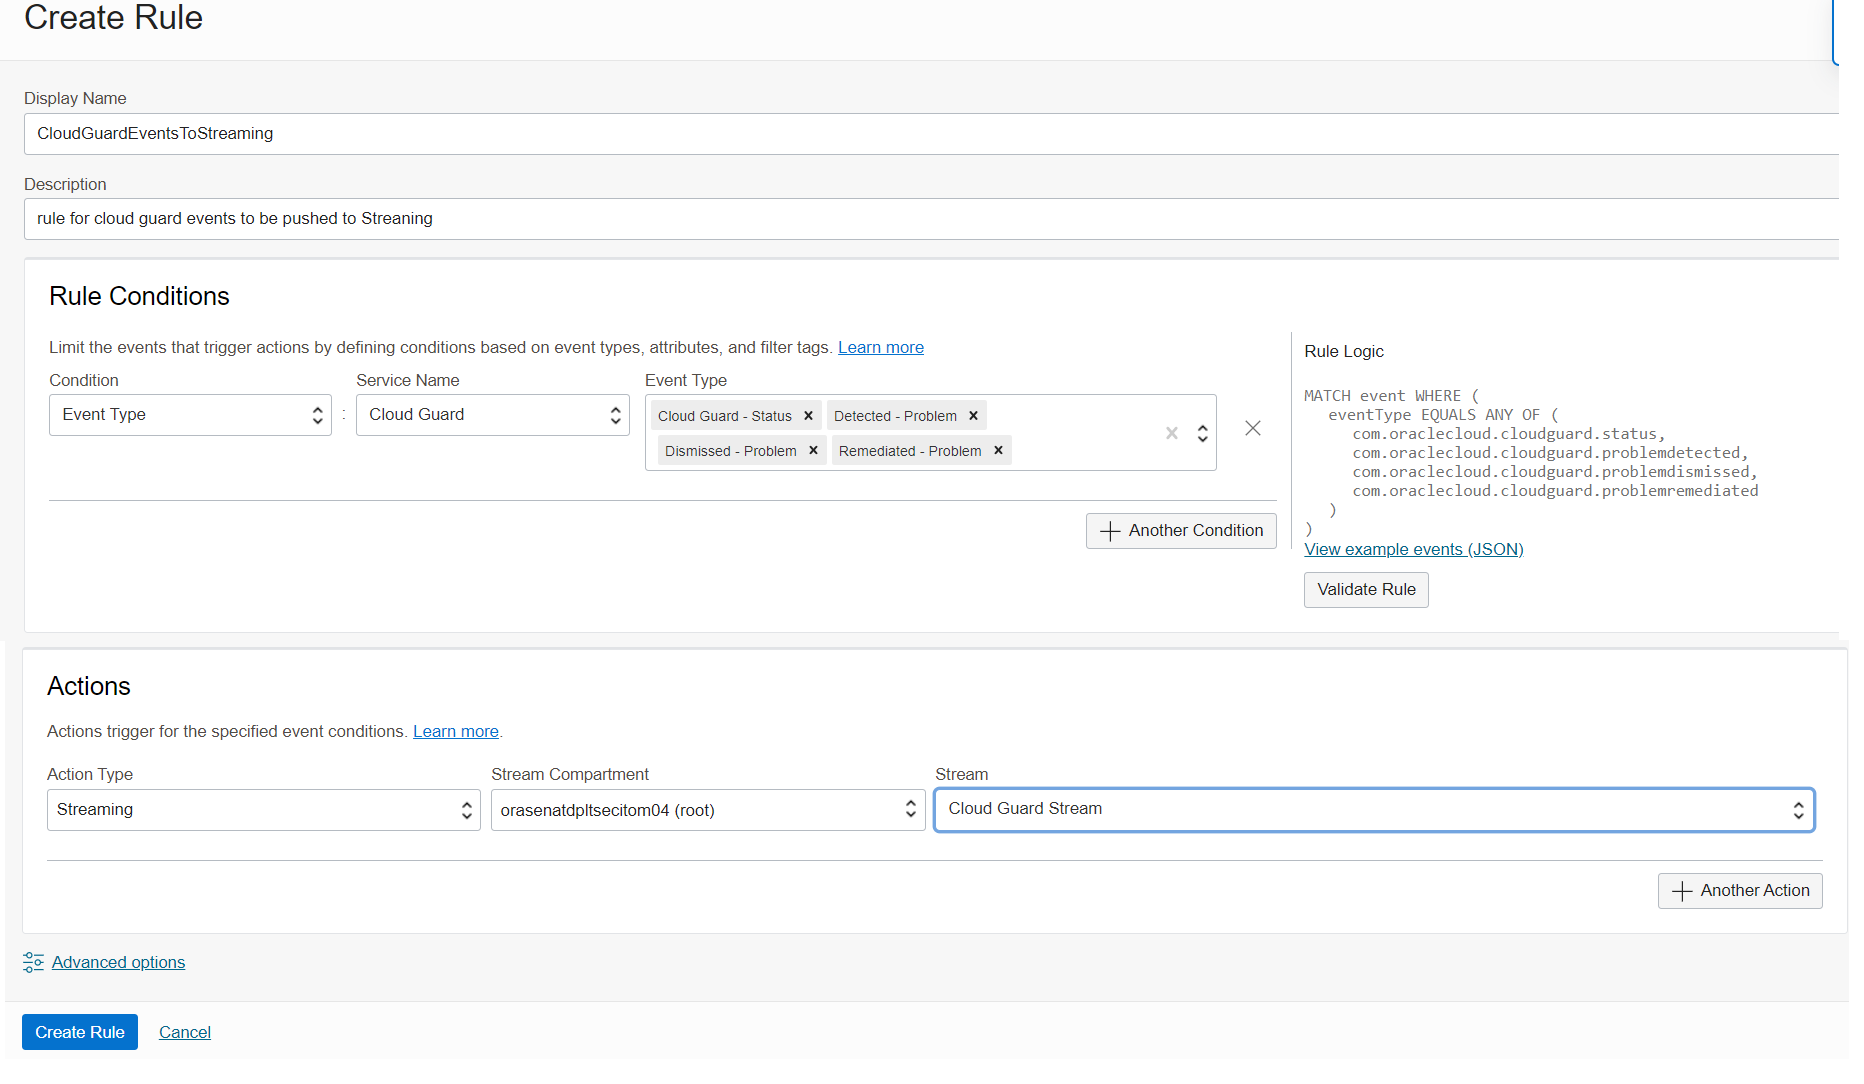
Figure 4: Create a rule for the Cloud Guard events to push to Streaming
Step 4: Create a log group in Logging Analytics (Optional)
-
In the Console, in the menu, select Observability & Management, and Logging Analytics, and then Administration.
-
Select the compartment where we want to create this log group.
-
Under Resources, select Log Group and Create a new Log Group. This step is optional if you already have an existing log group. Here, we’re creating a new Log Group for Cloud Guard logs as shown in Figure 5.
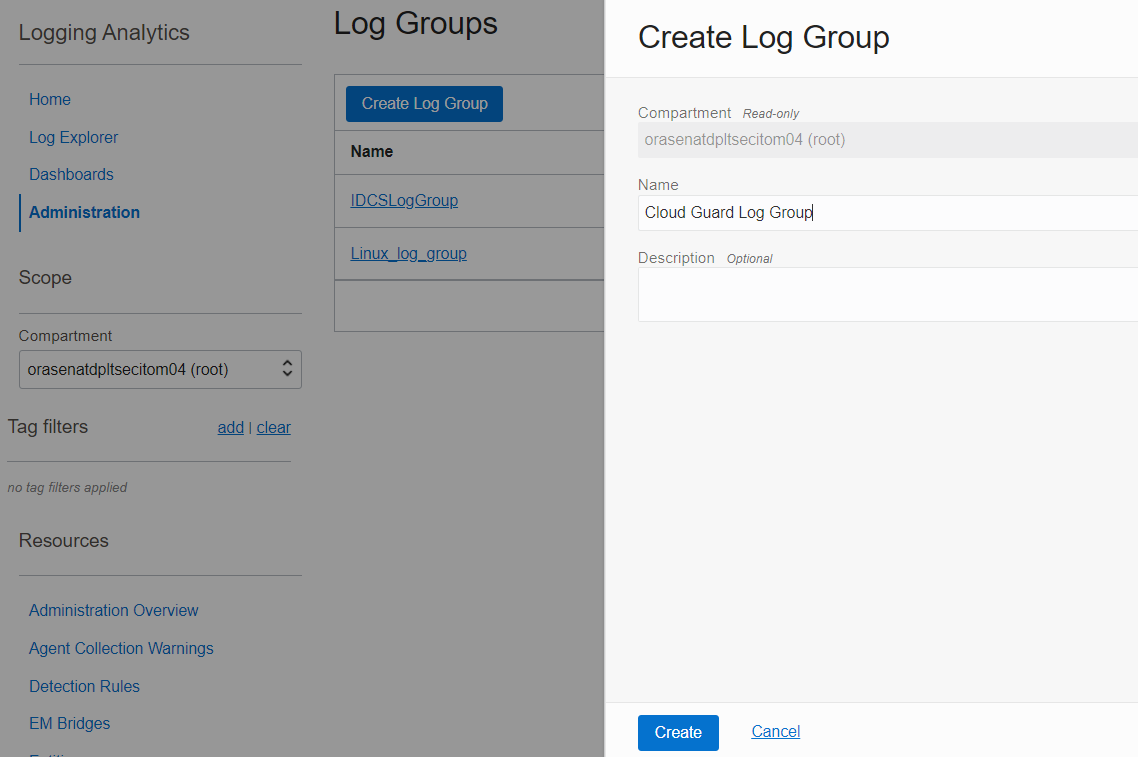
Figure 5: Create a log group in Logging Analytics (Optional)
Step 5: Create a log parser and source in Logging Analytics
-
In the Console, under the menu, select Observability & Management, Logging Analytics, and then Administration.
-
Select the compartment where we want to create the log parser. Click Parser.
-
Select JSON type and paste the following sample log in Example log content to create the log parser as shown in Figure 6.
{ "eventType": "com.oraclecloud.cloudguard.problemremediated", "cloudEventsVersion": "0.1", "eventTypeVersion": "2.0", "source": "CloudGuardResponderEngine", "eventTime": "2022-10-19T04:58:26Z", "contentType": "application/json", "data": { "compartmentId": "ocid1.compartment.oc1..aaaaaaaxxxxxxxxx43cfxpxoclqqje6ubnibuhiy4ujiji2muhmpsa", "compartmentName": "CloudGuardTest", "resourceName": "Scanned host has open ports", "resourceId": "ocid1.cloudguardproblem.oc1.iad.amaaxxxxaas4n35vkqc5hqubmfmzz45u2iqyh6jcire2dbza27bcxl6jqqpoma", "additionalDetails": { "tenantId": "ocid1.tenancy.oc1..aaaaaaaaxxxxxxxxxxqgklcloydwnror5b3fs4ag7dlrbsiwkjdea", "status": "RESOLVED", "reason": "Problem is auto resolved by CloudGuard", "problemName": "SCANNED_HOST_OPEN_PORTS", "riskLevel": "CRITICAL", "problemType": "CONFIG_CHANGE", "resourceName": "monitoringnode", "resourceId": "ocid1.instance.oc1.iad.axxxxx35xxxxxxwgqlepmjju2f3fvcwu7s5vbonfmmcpxqj5hyuaq", "resourceType": "HostPortScan", "targetId": "ocid1.cloudguardtarget.oc1.iad.amxxxxxaaas4n35vkqjdw4x2354clqmbz7tyzllmk6syb756y3e5ot7jdxfzyq", "labels": "VSS", "firstDetected": "2022-10-05T09:41:56.799Z", "lastDetected": "2022-10-19T04:58:05.630Z", "region": "us-ashburn-1", "problemAdditionalDetails": { "Open ports": "{\"TCP\":[22,111],\"UDP\":[68,111,1007]}", "Disallowed ports list": "{\"TCP\":[11,17,18,19,21,23,24,25,43,49,53,70,71,72,73,74,79,80,81,88,111,123,389,445,500,636,3306,3389,5901,5985,5986,7001,8000,8080,8443,8888],\"UDP\":[11,17,18,19,49,69,80,82,83,84,85,389,443,656,8080]}", "Scan Result Id": "ocid1.vssportscanresult.oc1..aaaaaaaaxxxxyxiaswkdfjoem2nkqofh4ma5skt6ts235hvud2qo7x6xedaa" }, "problemDescription": "Prerequisite: Create a Host Scan Recipe and a Host Scan Target in the Scanning service. The Scanning service scans compute hosts to identify open ports. This detector triggers a problem when the Scanning service has reported that an instance has one or more open ports. Certain ports are required for operation and delivery of services but any open port beyond the intended list can potentially be used to exploit the services. You can modify the default list of allowed ports or disallowed ports in Input Settings within the detector.", "problemRecommendation": "Review if identified ports should be open on this host and close them if they are not required to be open." } }, "eventID": "b6b30bd8-413d-4d4d-b5cb-e0392dcc4904", "extensions": { "compartmentId": "ocid1.compartment.oc1..aaaaaaaaxxxx7slcbrc43cfxpxoclqqje6ubnibuhiy4ujiji2muhmpsa" } -
Under Fields, we’re only mapping the required fields in Logging Analytics from Cloud Guard events as shown in Figure 6. Click Create.
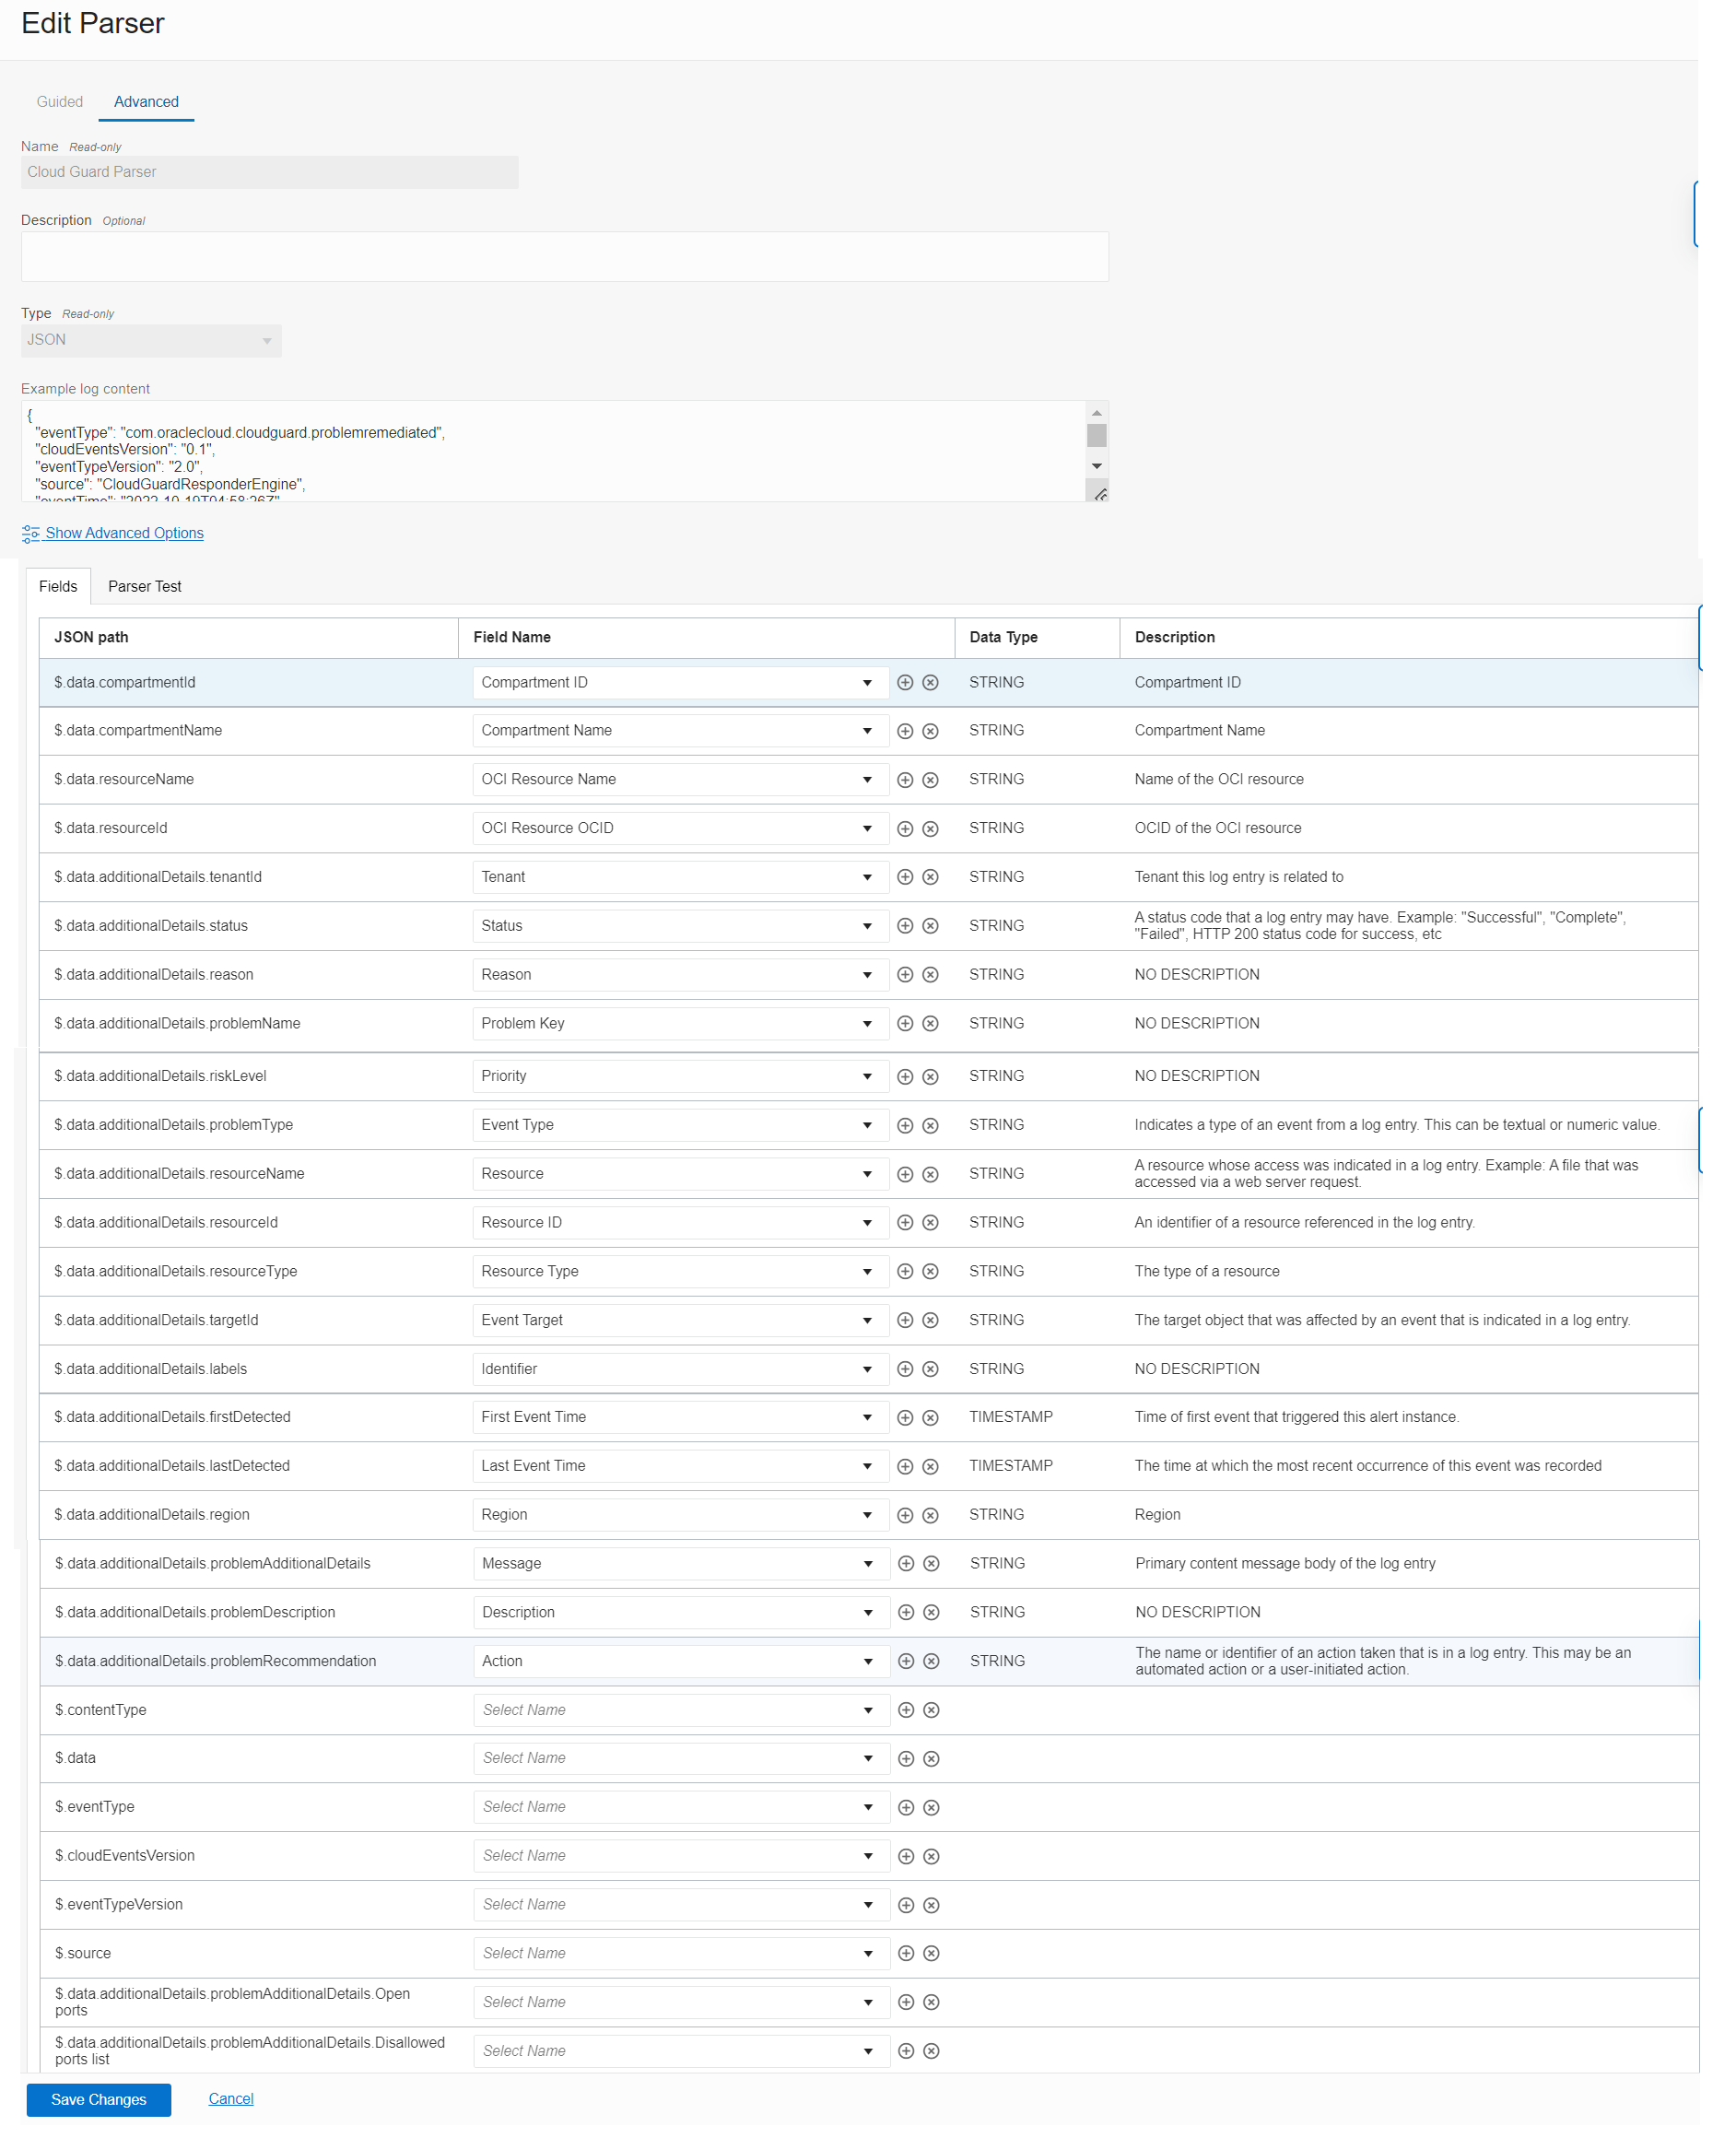
Figure 6: Create a parser in Logging Analytics -
On the previous page, click Sources from the administration in Logging Analytics.
-
Select the compartment where we want to create this log source.
-
Click Create Source and provide the required values. Select the parser that we created. Click Create Source.
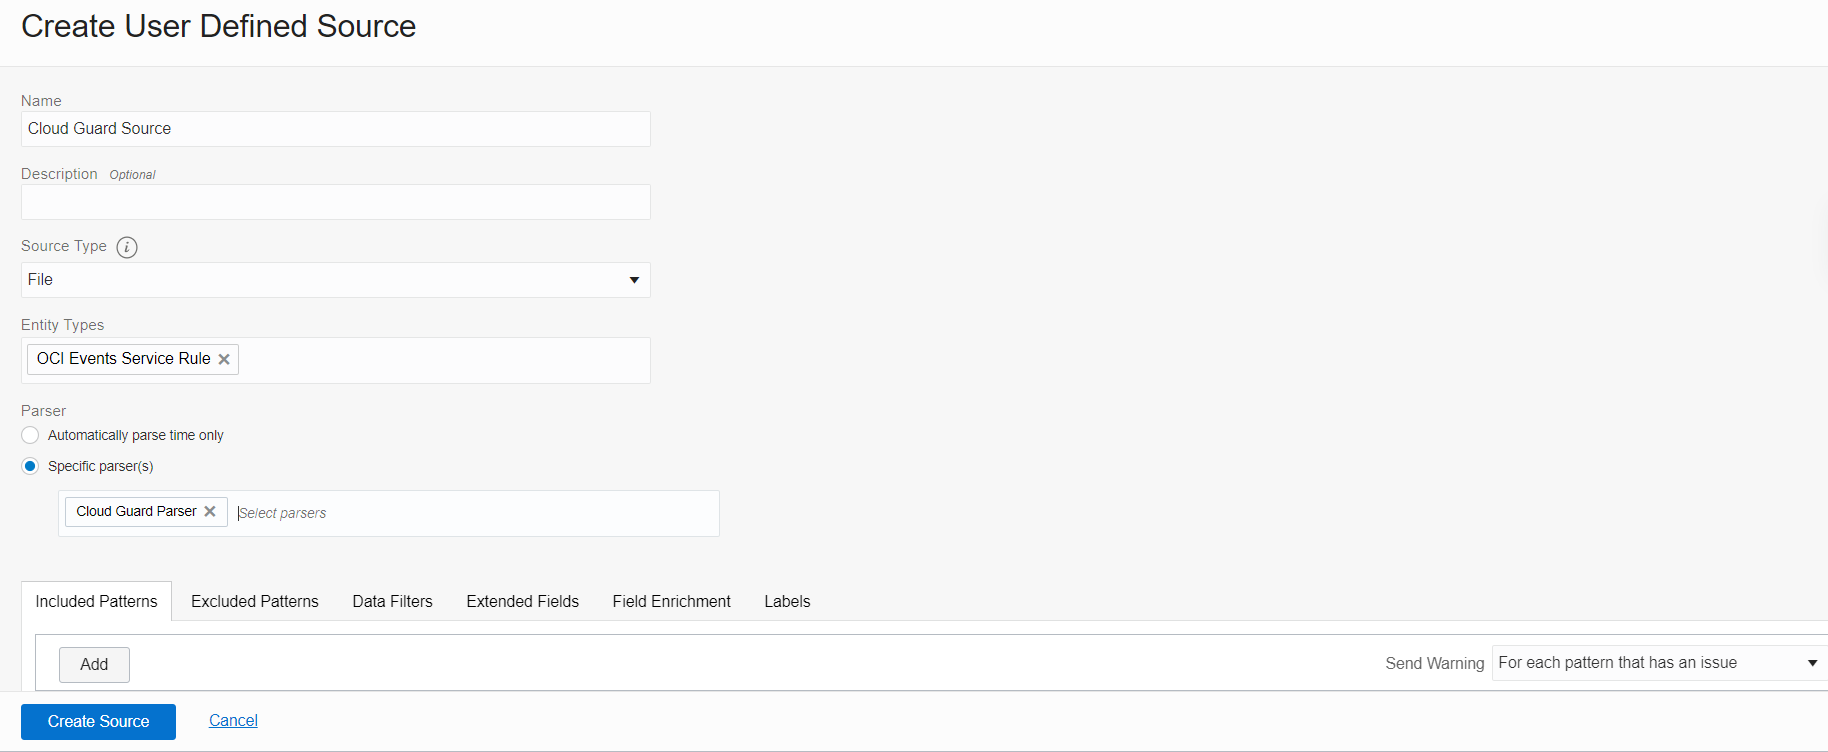
Figure 7: Create a source in Logging Analytics
Step 6: Create a service connector to send Cloud Guard events from Streaming to Logging Analytics
-
In the Console, in the menu, select Analytics & AI, Messaging, and then Service Connector Hub.
-
Select the compartment where we want to create the service connector.
-
Click Create Service Connector and provide the respective values. Under Configure Service Connector, select Streaming as the source and Logging Analytics as the target.
-
Under Configure Source, select the stream that we created in Step 2 and select Latest in the read position.
-
Under Configure Destination, select the log group that we created in Step 4 and the source that we created in Step 5.
-
Create the default policies that appear on the screen and click Create.
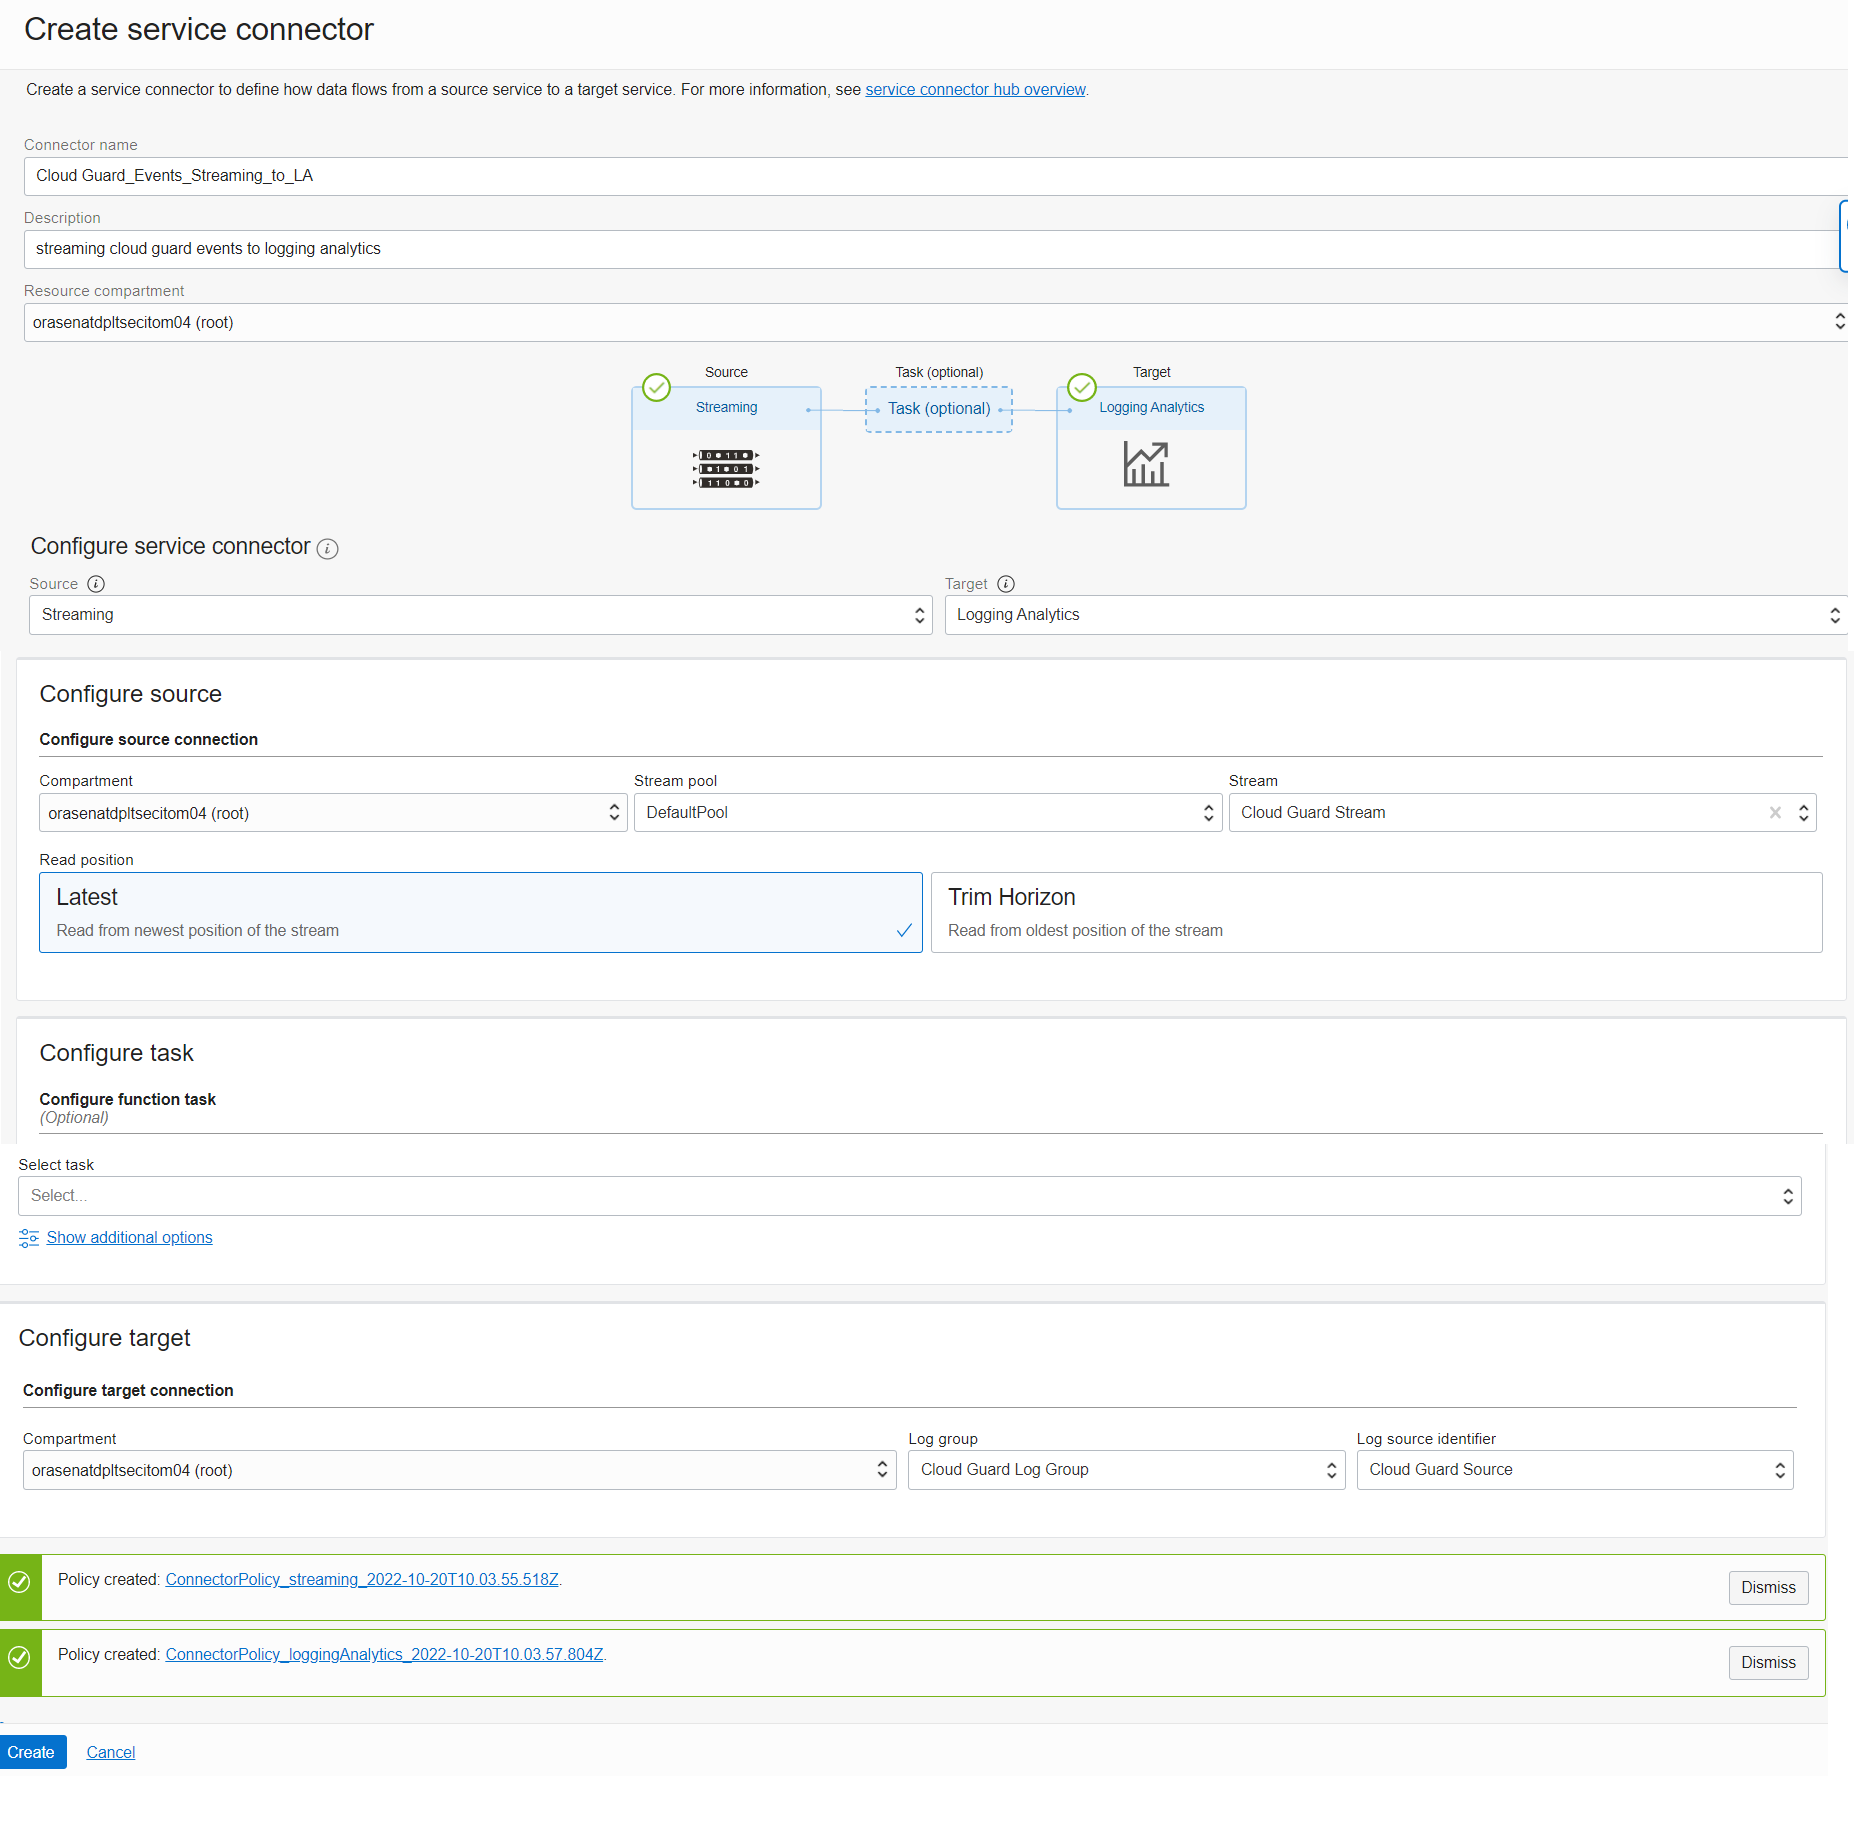
Figure 8: Create a service connector to send Cloud Guard events from Streaming to Logging Analytics
Step 7: Validate the Cloud Guard events in Logging Analytics
-
In the Console, in the menu, select Observability & Management, Log Analytics, and then Log Explorer.
-
Validate the Cloud Guard events as shown in Figures 9 and 10.
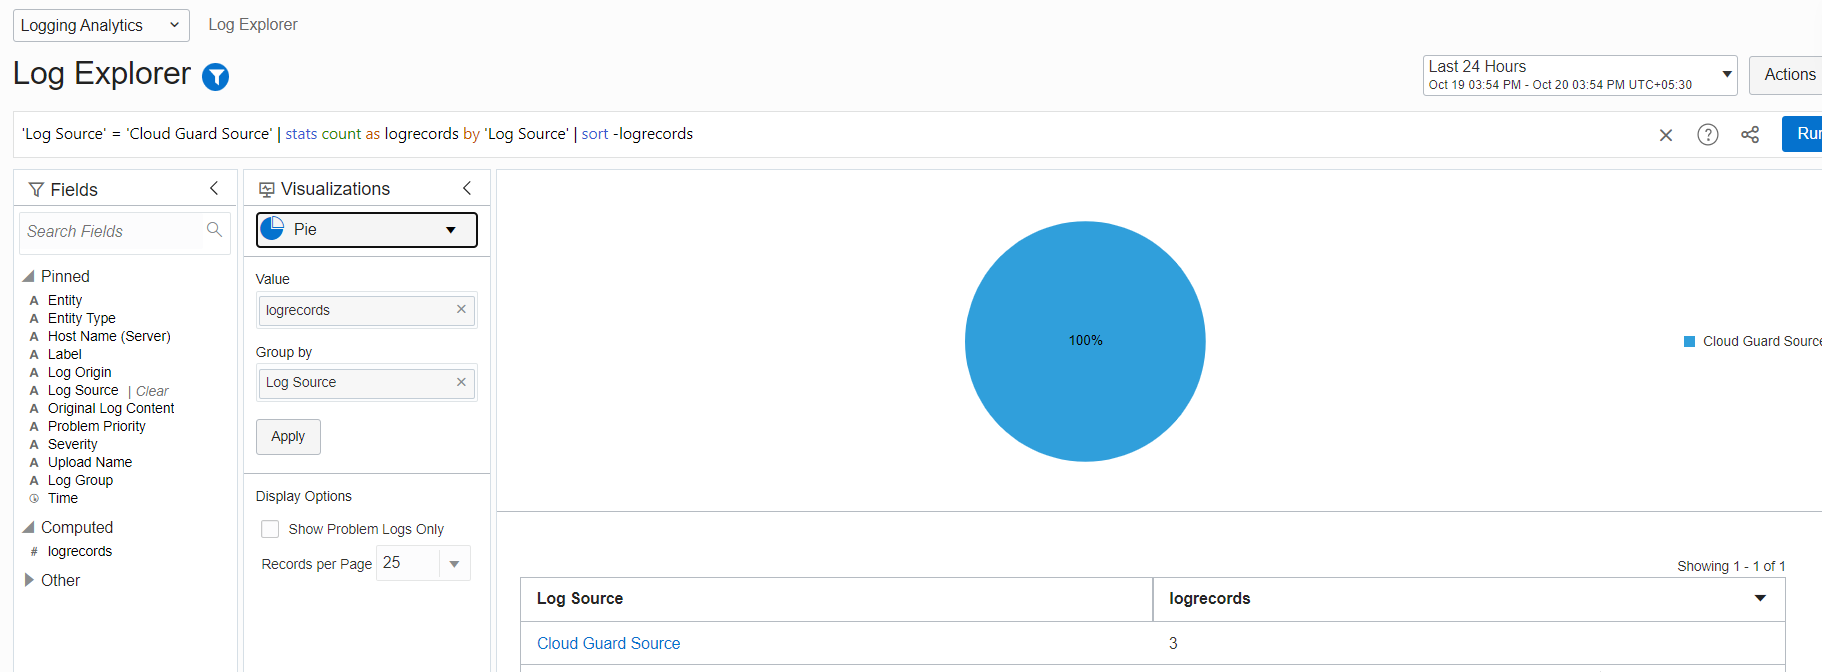
Figure 9: Validate the Cloud Guard events in Log Explorer
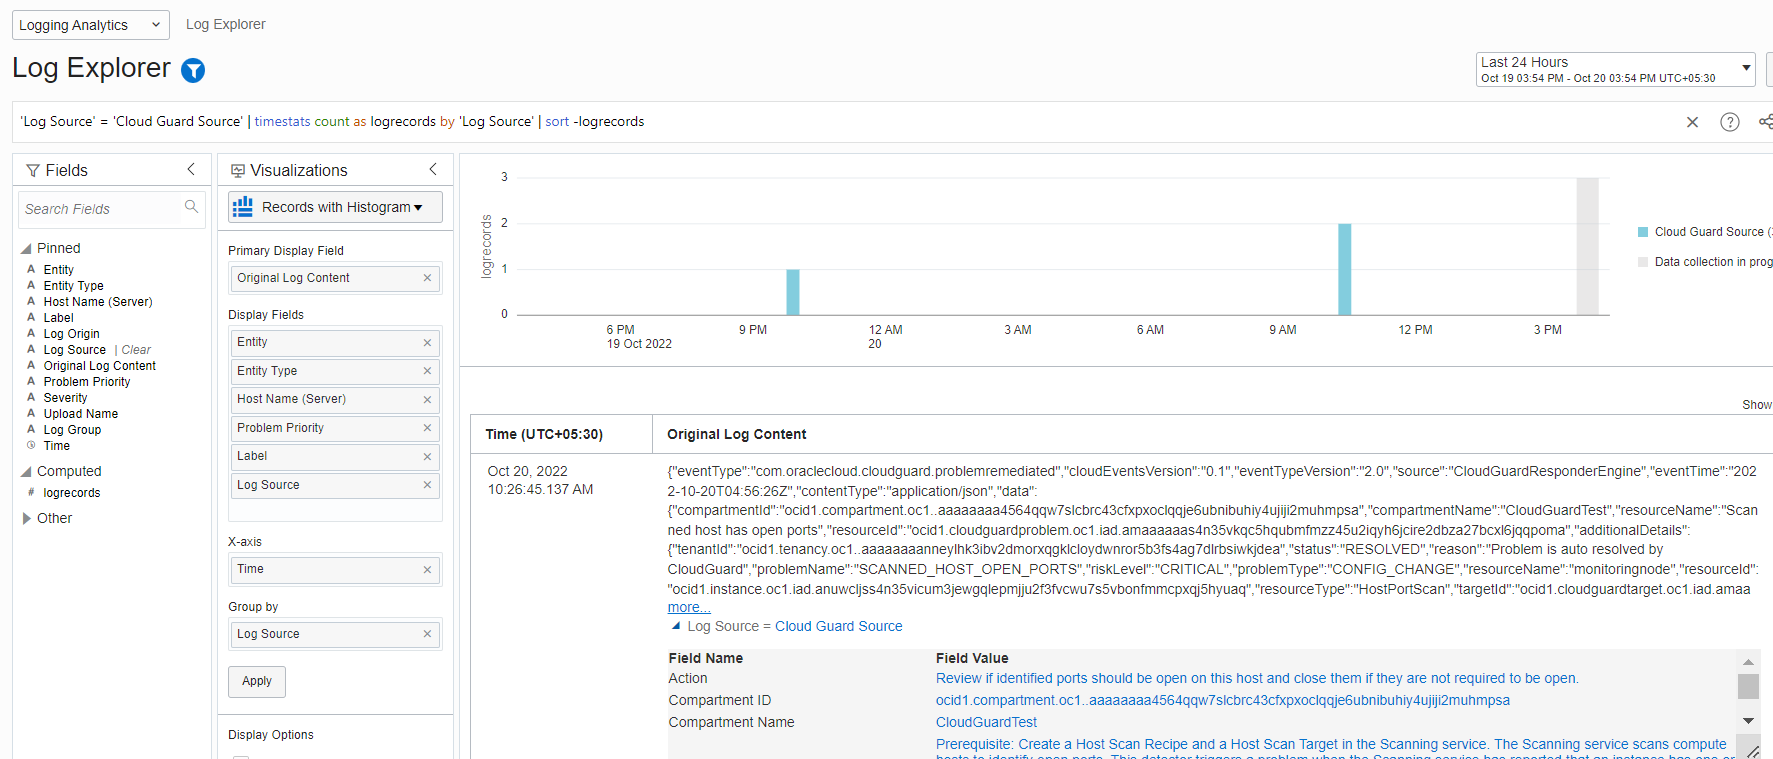
Figure 10: Validate the Cloud Guard events in Log Explorer
Conclusion
In this blog, we covered Oracle Cloud Infrastructure integration with Logging Analytics using Streaming. Look for Part 2, coming soon, where we cover the integration of Oracle Cloud Guard using Functions. You can choose either of these optimal deployments to integrate Cloud Guard Events with Logging Analytics. For more in-depth information on this topic, see Send Streaming Data to Logging Analytics.