Oracle Cloud Infrastructure (OCI) Logging Analytics helps create visual log charts for key elements of your application, infrastructure, and any cloud service logs. Creating an all-in dashboard is critical for organizations to perform Day 2 operations. In this blog, I showcase two OCI Logging Analytics features, which can help you begin to build a logging analytics dashboard for any of your workloads.
OCI Logging Analytics simplifies the log analysis with pre-defined logsources, parsers, and labels for most data sources. For the complete list, see Oracle-defined Sources. Taking Linux as an example, the following log sources are already defined, which means that Logging Analytics knows how to parse Linux Audit, Linux Cron, Linux Mail Delivery, Linux Secure, Linux Syslog, and Linux YUM logs.
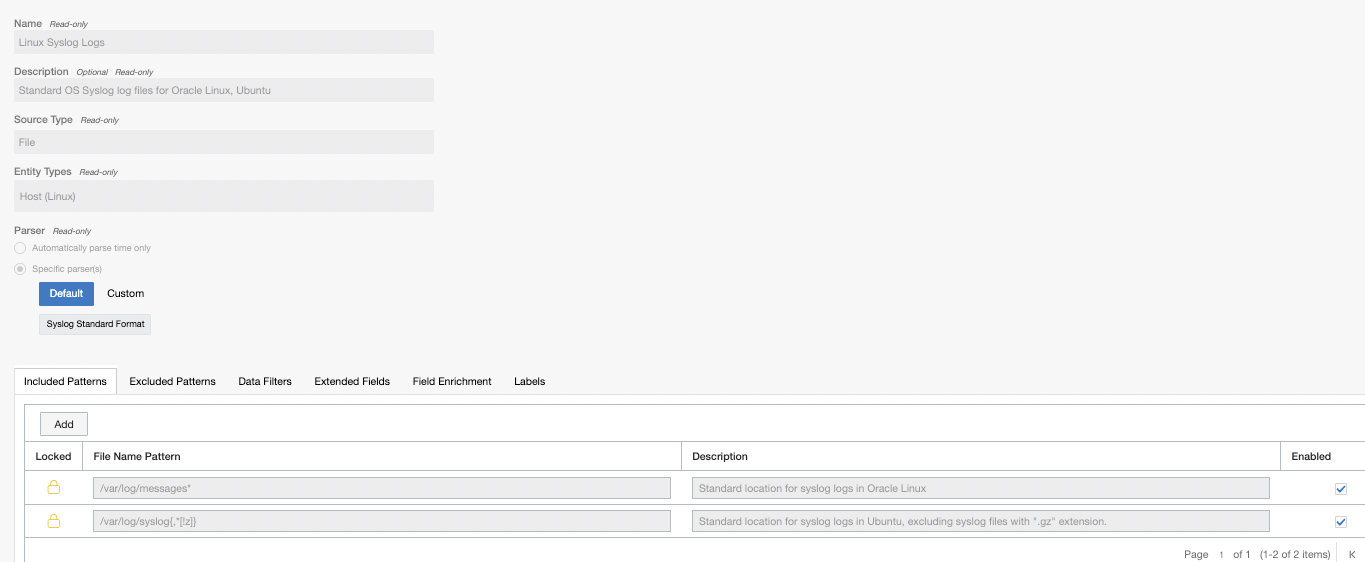
Looking further into Linux Syslog logs, the log source shows us which logs are being considered (/var/log/syslog and /var/log messages in this case) and which parser is being used (syslog standard format). You can see the details of the parser and the regex (regular expressions) used.
To start building dashboards, let’s use the following features that Logging Analytics provides:
-
OCI Logging Analytics labels
-
Cluster visualization
OCI Logging Analytics labels
OCI Logging Analytics automatically applies labels to your log entries as they’re ingested based on the various label definitions in your source.
For example, for Linux syslog, the string “failed password” found in the logs is labelled as an authorization error. Similarly, for NGINX Access logs “403,405” are labelled as authorization errors. Many other labels are defined in this fashion already.

Putting this feature to use, navigate to Log Explorer and then use a histogram visualisation and group by label:
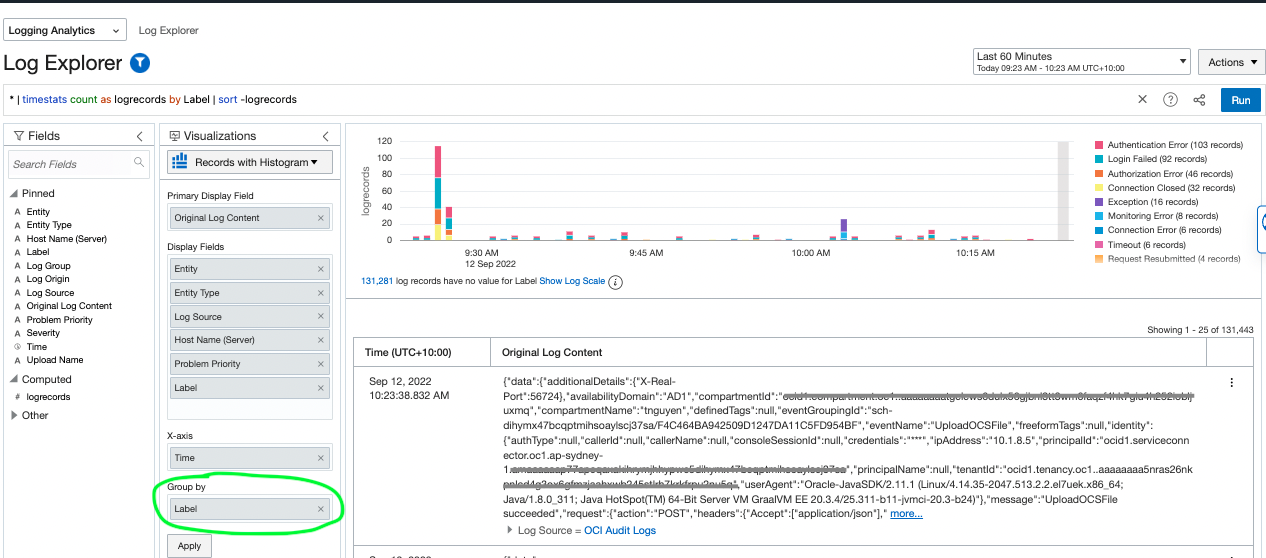
As you can see from the colour coding, Logging Analytics has already determined various errors from the logs based on the predefined labels. This feature powerful provides quick insights into your logs without doing any manual queries.
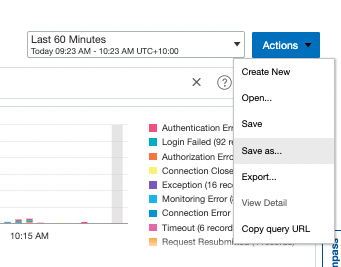
The next logical step is to add this visualization to a dashboard so that can help your daily operations.
In the Oracle Cloud Console, navigate to Logging Analytics and select Log Explorer. Under Actions, select Save as and provide a meaningful name, such as “Logs by label.” Then click Add to dashboard.
The create dashboard looks like the following example:
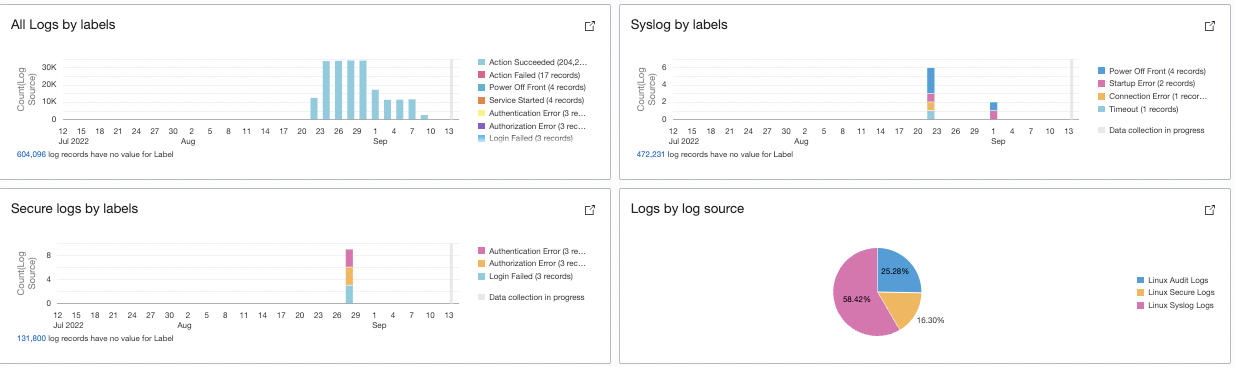
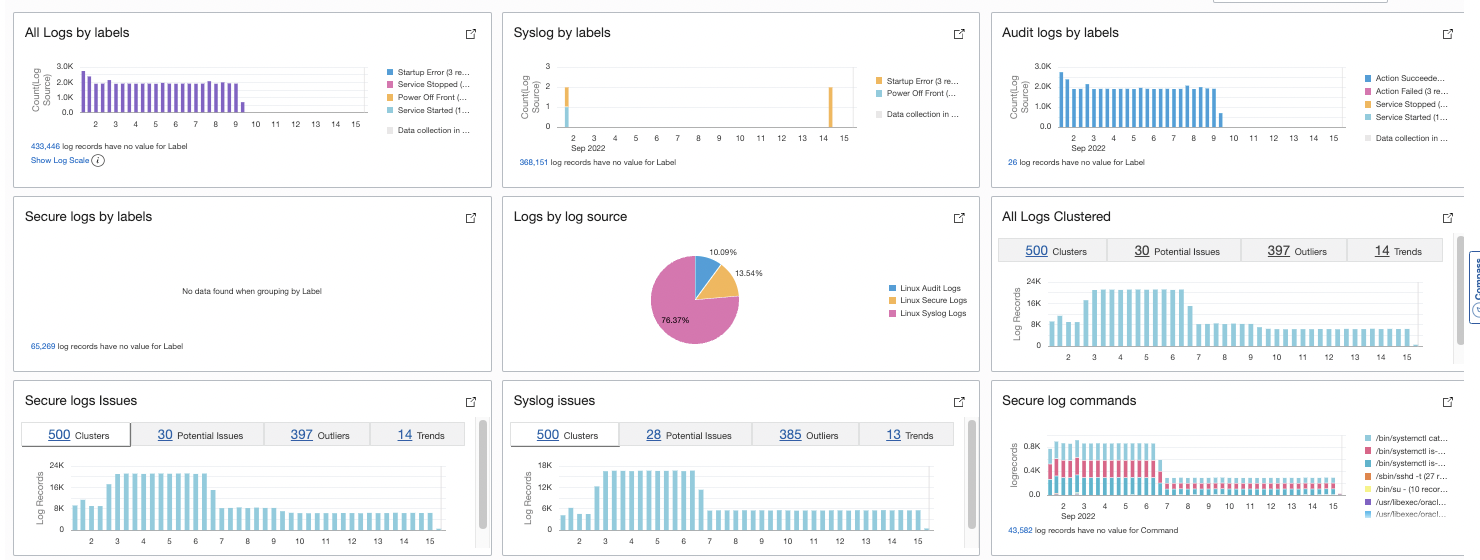
As you can see, I have built similar widgets like “Syslog by labels” and “Secure log by labels” by selecting the log sources individually from the log explorer fields tab:
Now let’s look at another feature of logging analytics.
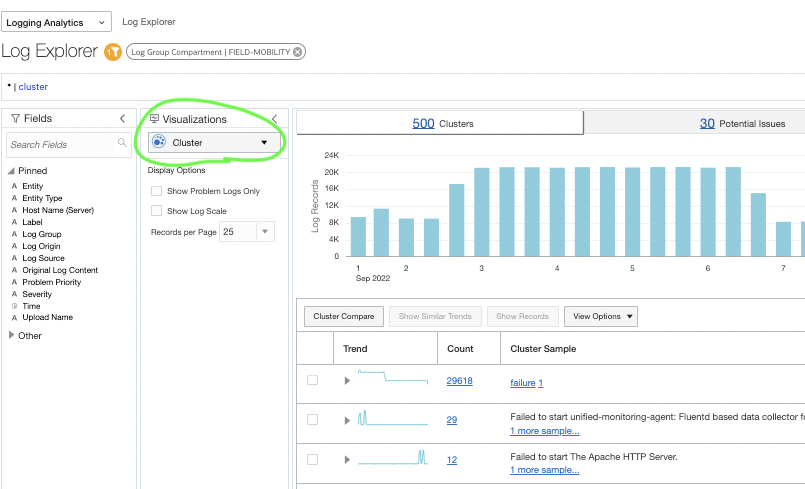
Cluster visualization
Clustering uses machine learning to identify the pattern of log records and then group the logs that have a similar pattern. In this widget, we can see the total clusters found: Potential issues based on log records containing words, such as error, fatal, exception, and so on. Other tabs include outliers (events that have occurred only once) and some unique trends.
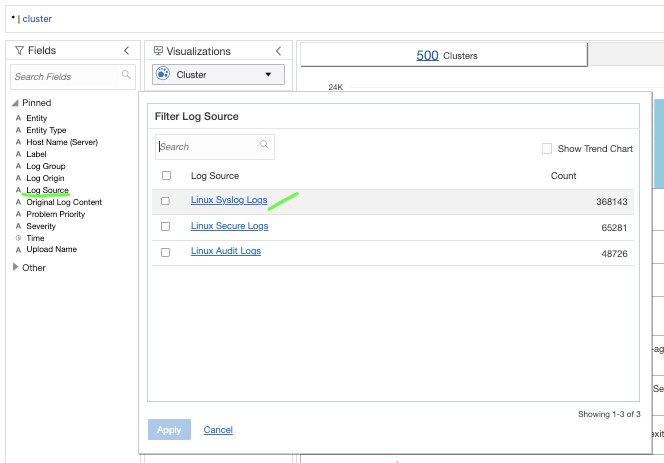
Navigate to Logging Analytics. Under Log Explorer, click Select visualizations and then Cluster.
You can also choose a specific log source to filter the logs of interest.
After adding the labels and clustering, the dashboard looks like the following example:
Conclusion
We saw how these two Logging Analytics features—labels and clustering—cover most aspects of your logs needed while root causing issues. But as we learn more fields, such as username, log source, and server name, and depending on our requirements, we can continue to group them (Group By function) and create more visualization charts. We can add our own custom labels, such as “man in the middle attacks” or payment failures. We can build our own simple queries to show on the dashboard, such as the top commands running on the system or the user performing most of the activities on the system. It comes down to asking questions about your system and finding answers using OCI Logging Analytics.
For more information, refer the Oracle Cloud Infrastructure Log Logging Analytics documentation, which provides details into what we discussed and more.