In association with Bogdan Darie, Cristian Cozma, and Ionut Sturzu
In our previous blog post, we explored the Sisense application and walked through the installation process on Oracle Cloud Infrastructure (OCI). In this post, we show you how to access the Sisense dashboard and related resources.
Access the Sisense dashboard
To access the Sisense application in the browser, perform the following steps:
-
Using SSH, access the node that’s hosting the Sisense endpoint (for example, 10.0.1.5).
-
From there, run the following command to forward the local port 8456 so it can be reached from outside the cluster:
$ kubectl port-forward svc/api-gateway-external 8456:8456 -n sisense
-
Open another terminal, and on your local machine, create a two-hop SSH port forwarding tunnel like the following example (port numbers might vary), where:
-
ubuntu is the default user (ubuntu for Ubuntu 18.04-based instances and opc for CentOS 7.x and Oracle Linux 7.x).
-
140.238.220.112 represents the bastion’s IP address.
$ ssh -i path_to_id_rsa -L 8001:localhost:8001 ubuntu@140.238.220.112 ssh -L 8001:localhost:8456 ubuntu@10.0.1.5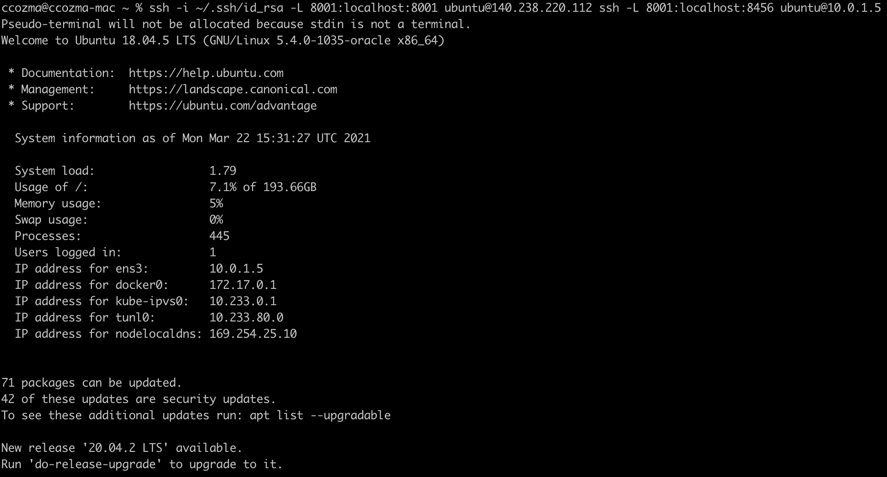
-
-
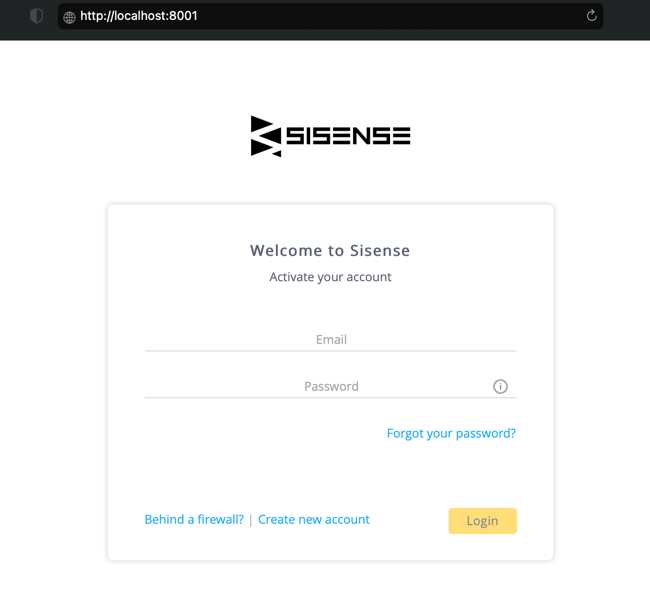
After the tunnel is open, enter http://localhost:8001 in your browser to access the Sisense application.
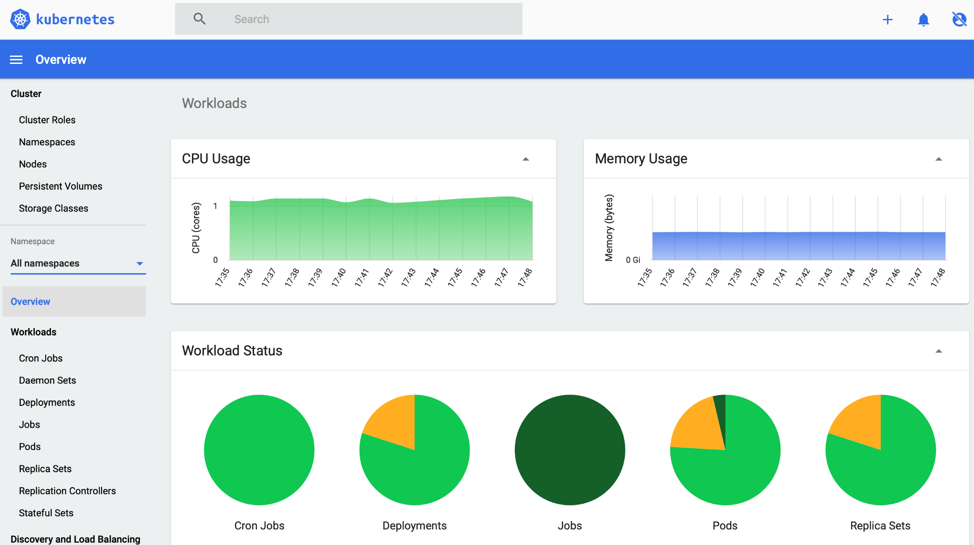
Access the Kubernetes dashboard
To access the Kubernetes dashboard, perform the following steps:
-
Using SSH, access the node that’s hosting the Sisense endpoint (for example, 10.0.1.5).
-
From there, run the following command:
$ kubectl proxy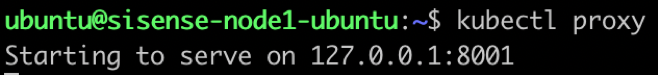
-
Open another terminal, and on your local machine, create a two-hop SSH port forwarding tunnel like the following example (port numbers might vary), where:
$ ssh -i path_to_id_rsa -L 8001:localhost:8001 ubuntu@140.238.220.112 ssh -L 8001:localhost:8001 ubuntu@10.0.1.5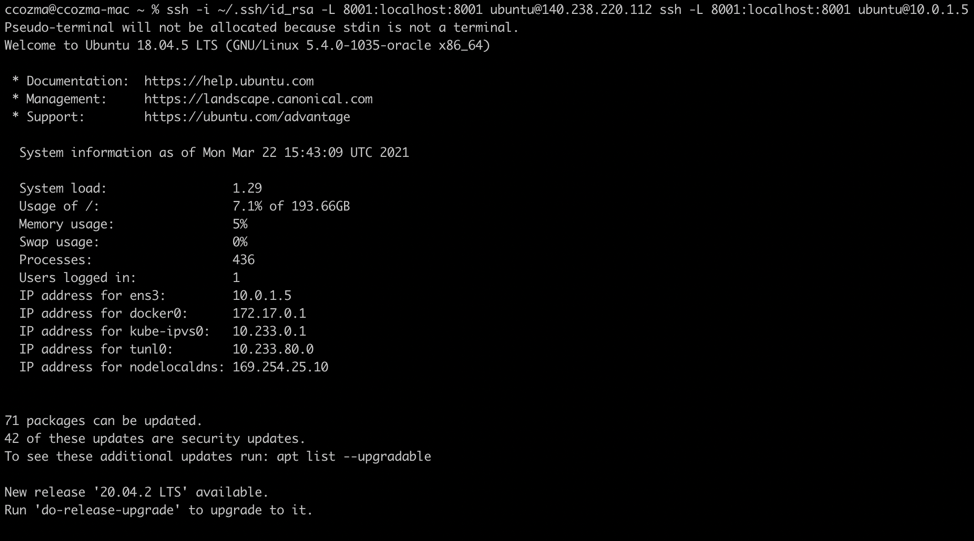
-
ubuntu is the default user (ubuntu for Ubuntu 18.04-based instances and opc for CentOS 7.x and Oracle Linux 7.x).
-
140.238.220.112 represents the bastion’s IP address.
-
-
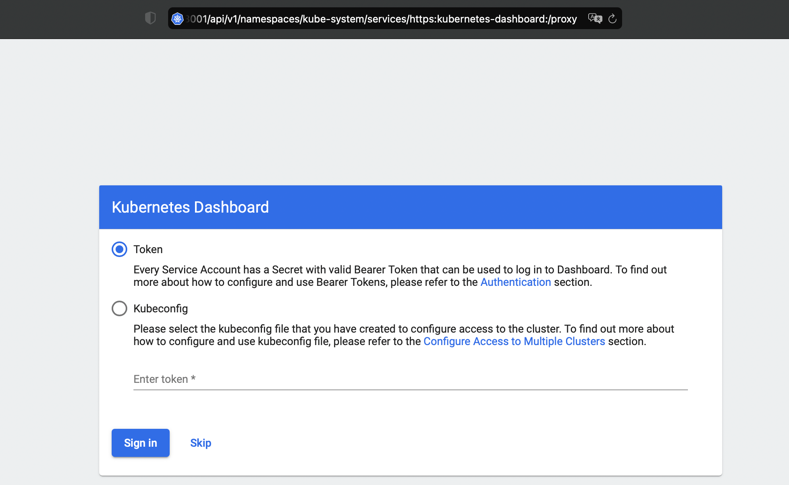
After the tunnel is open, enter http://localhost:8001/api/v1/namespaces/kube-system/services/https:kubernetes-dashboard:/proxy
in your browser to access the Kubernetes dashboard. -
Access the Grafana dashboard
To access the Grafana dashboard in the browser, perform the following steps:
-
Using SSH, access the node that’s hosting the Sisense endpoint (for example, 10.0.1.5).
-
From there, run the following command to forward the local port 3000 so it can be reached from outside the cluster:
$ kubectl port-forward svc/sisense-prom-operator-grafana 3000:80 -n monitoring
-
Open another terminal, and on your local machine, create a two-hop SSH port forwarding tunnel like the following example (port numbers might vary), where:
-
ubuntu is the default user (ubuntu for Ubuntu 18.04-based instances and opc for CentOS 7.x and Oracle Linux 7.x).
-
140.238.220.112 represents the bastion’s IP address.
$ ssh -i ~/.ssh/id_rsa -L 3000:localhost:3000 ubuntu@140.238.220.112 ssh -L 3000:localhost:3000 ubuntu@10.0.1.5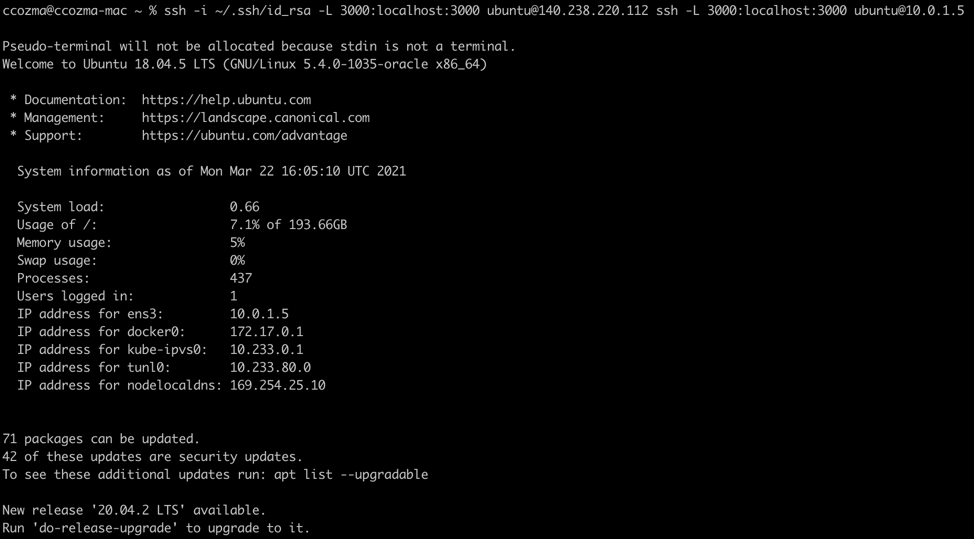
-
-
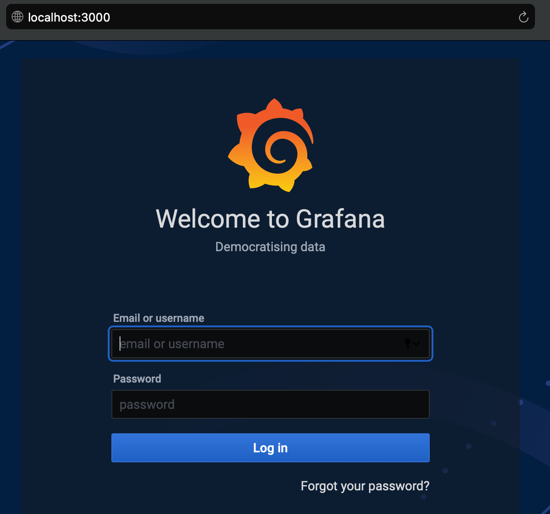
After the tunnel is open, enter http://localhost:3000 in your browser to access the Grafana dashboard.
Conclusion
Following up on our previous blog on how to deploy Sisense on OCI, in this post we described how to access the Sisense application, Kubernetes and Grafana dashboards. All the steps can be fully automated by using Terraform or Bash, or by using the OCI CLI or SDKs.
In addition, the required infrastructure can be automated using the Thunder Framework. Explore our Architecture Center to quickly deploy solutions on Oracle Cloud Infrastructure using Terraform, and reach out to the Oracle team to learn more.