This year, 2024, isn’t any election year — it’s possibly the most significant one in recent history. This year, elections are being held in nations that are home to almost half of the global population. Decoding and visualizing election data in unconventional ways is a challenge, but a Parliament chart visualization is one of the most effective ways to do this. To learn more about Parliament chart visualizations, see this video:
As an analyst, your goal is to present election results data in an engaging manner. For example, you can analyze United Kingdom election outcomes by political party and number of seats:
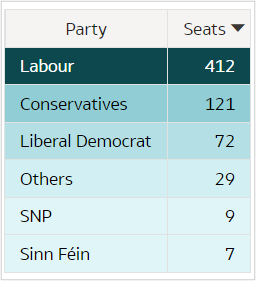
Fig. 1: UK election data, 2024
In this case, you may want to engage your audience with charts that aren’t available by default in Oracle Analytics. The Parliament chart visualization appears as more creative and engaging than basic charts. It resembles a half-donut chart, illustrating the distribution of seats among parties in a legislative body, such as a parliament. The dots form a parliament-like pattern to provide a clear and intuitive way of displaying the distribution of seats across political parties. The dot colors indicate the political affiliations of the respective parties.
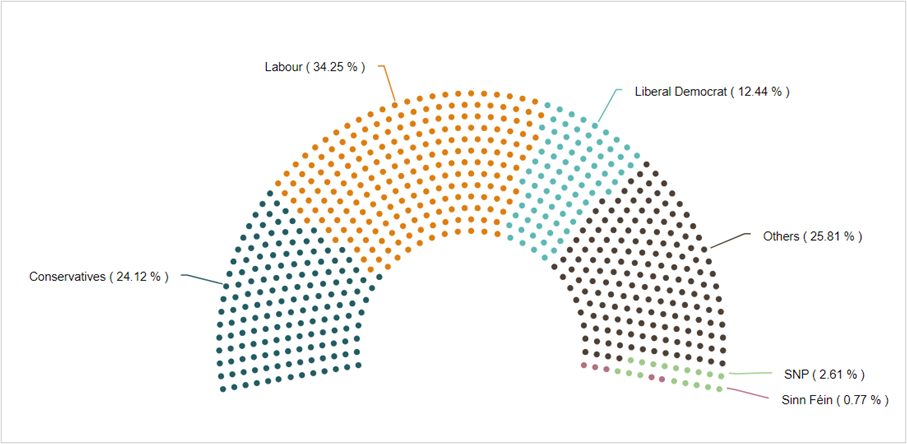
Fig.2: A Parliament chart
The Oracle Analytics SDK enables you to create compelling visualization extensions from the ground up. You can use JavaScript, HTML, CSS, and third-party JavaScript libraries to build these extensions. To learn more, see this blog post.
You can also use the custom color palette in Oracle Analytics Cloud (OAC) to assign official political colors to respective parties in Parliament chart visualizations. To learn more, see this blog post.
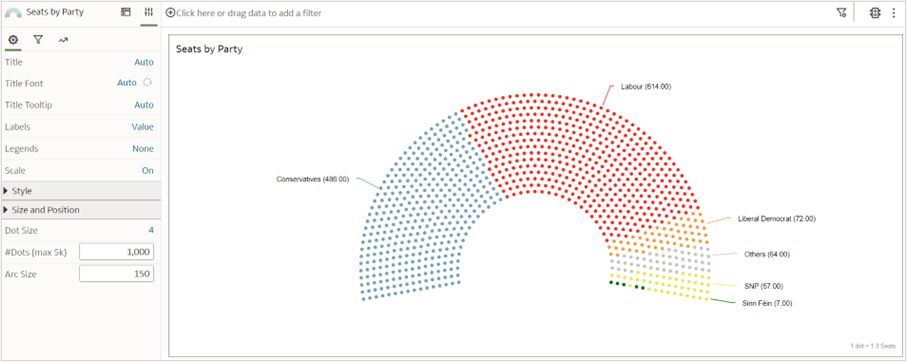
Fig.3: Parliament chart parameters
The Parliament chart visualization supports custom parameter properties including:
- Labels and Legends use values and percentages to display the selected measure count and % share respectively.
- Scale represents the ratio between the number of dots (#Dots) and the chosen measure. For example, for 1,000 seats, if only 100 dots are plotted, then each dot represents 10 seats.
- Dot Size customizes dot size on a scale of 1 to 5, where 1 is the smallest.
- #Dots displays the number of dots displayed on the chart, if the number of seats is equal to or less than 1,000. You can increase this value upto 5,000.
- Arc Size enables you to resize the chart.
Here are additional examples of Parliament chart visualizations:
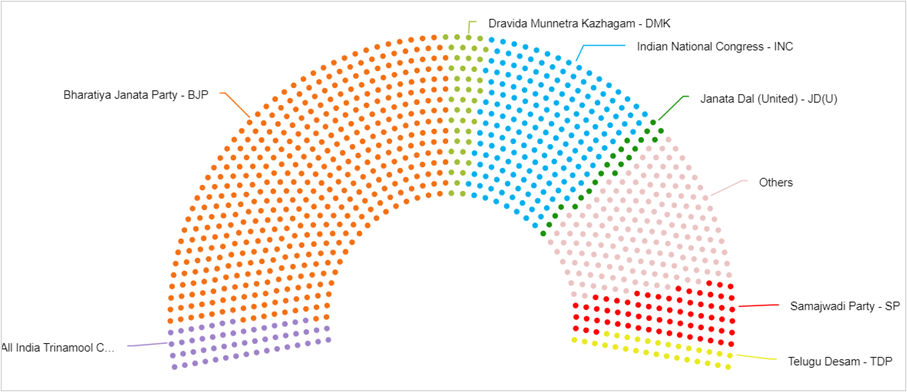
Fig. 4: 2024 India election result analysis
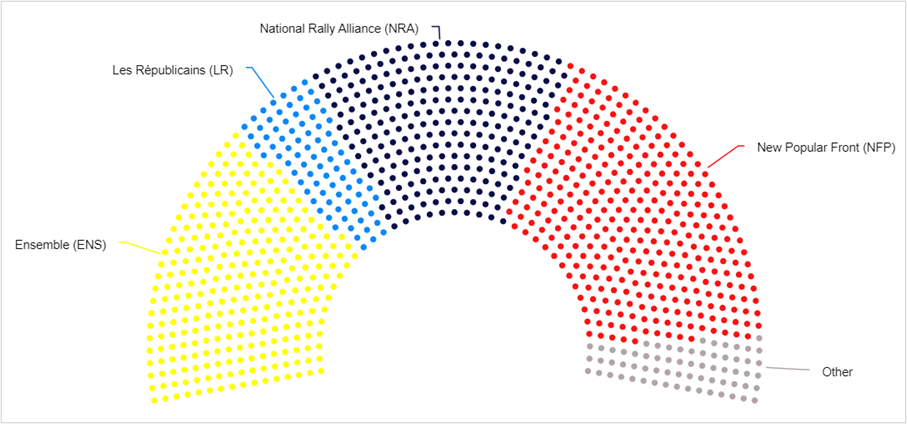
Fig. 5: 2024 France election result analysis
The Parliament chart visualization gives you the power to perform interactive election analysis, from voting intentions to results. It’s designed for analyzing election outcomes, but try it out for other datasets and use cases, too.
Note: This plug-in isn’t publicly available. To request this plugin, contact me on LinkedIn.