💡 “Benefits are not just perks — they are promises of security, care, and well-being that organizations extend to their workforce.”
Behind every thriving workforce lies an invisible thread of care — the benefits that support employees through every stage of their journey. From the excitement of a new hire to the milestones of marriage or parenthood, benefits quietly shape how people experience both work and life.
But how do you move beyond transactions to uncover true insights? Which benefits are most valued across the workforce? How do preferences shift with life milestones like starting a new role, family additions, or workforce exits? And most importantly, are your benefit programs creating the impact they were designed for? Traditional reporting often makes these questions hard to answer. That’s where the new Benefits Analytics comes in, empowering benefit managers and administrators to analyze adoption, engagement, and trends not only at the event level, but also across time.
Why Benefits Analytics Matter
🔎 “Do you really know if employees are making the most of the benefits you offer, or which programs are actually improving their well-being?”
Benefits are one of the clearest ways organizations show care for their people, yet their real impact often remains hidden beneath layers of enrollment and event data. Oracle HCM Fusion Data Intelligence (FDI) bridges that gap. By turning raw data into actionable insight, Oracle HCM FDI gives benefit managers and administrators the clarity to make smarter, proactive decisions. With it, you can explore questions such as:
- Are employees truly engaging with the programs offered?
- How do life events like hiring, marriage, or retirement influence benefits adoption?
- What long-term trends reveal shifting workforce needs or gaps in coverage?
Instead of relying on reactive tracking, Oracle HCM FDI equips you with forward looking intelligence to refine offerings, increase participation, and ensure that every investment in benefits delivers measurable value.
What’s in the Benefits Subject Area (at a glance)
The introduction of the Benefits subject area in Oracle HCM FDI 25R2 offers a powerful new lens for workforce well-being. At its core, the Benefits subject area blends two complementary perspectives, so you can examine both the moment and the movement:
- Event-based metrics capture changes as they occur — the immediate view you need to understand what triggered a choice or adjustment.
- Active snapshot metrics provide month-over-month views — a longitudinal lens to see adoption, seasonality, and momentum at month, quarter, or year level.
Note: Active snapshot data is retained for the last 60 months only. When the data warehouse is reset, any data older than 60 months will be truncated.
Together, these perspectives transform benefits from being seen as a static list of entitlements into a living, evolving dimension of the employee experience — one where you can zoom into a single decision and zoom out to the trendline it contributes to, all without switching tools or losing context.
💡 “In short: Events explain decisions; snapshots reveal direction.”

The Benefits subject area provides a clear, structured view of benefit relationships, enrollments, and life events — making it easier to connect day-to-day changes with long-term benefit trends.
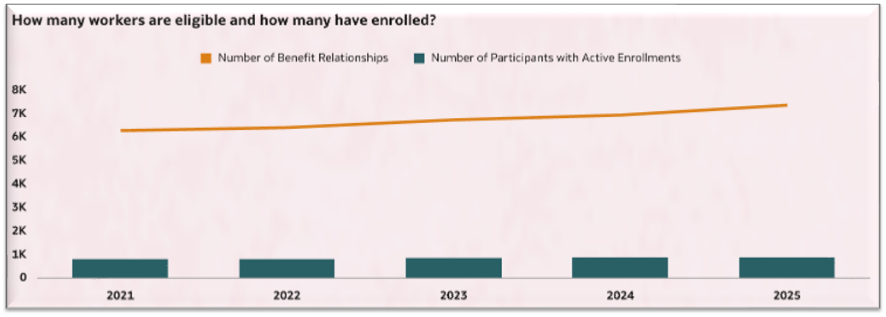
- Benefit Relationships – Start with the basics: Who’s covered and how. This helps you validate eligibility and see the ripple effects of coverage choices.
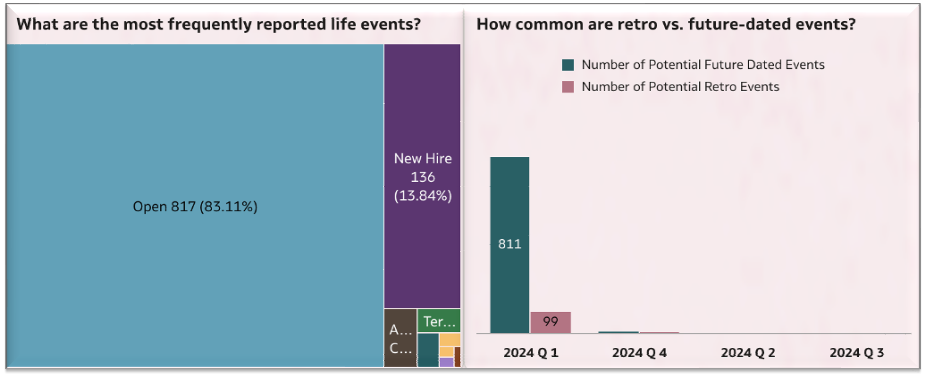
🔎 Out of the entire workforce, how many workers are eligible for the benefits offering? - Life Events (Potential & Evaluated) – Think of these as life chapters. Hiring, marriage, or welcoming a child — each milestone is captured as a driver of benefit choices.
🔎 Which life events were most triggered during this quarter? - Enrollments – Move into participation details: Who enrolled, in which program, and when. From single changes to rolling trends, the data answers both “What just happened?” and “How is it shaping over time?”
🔎 How many employees dropped medical coverage this year, and is it part of a bigger pattern? - Program and Plan Setup and Hierarchy – Not just raw data, but structure and intent. Enables a clear view of how offerings are designed and connected in a hierarchy – Program > Plan Type > Plan > Options
🔎 How do adoption patterns differ across programs, plans, and options in your setup? - Benefit Groups and Person Habits – Two angles to enrich benefits analysis. Benefit Groups segment the workforce for eligibility and adoption insights, while Person Habits (like student status) add nuance to participation patterns.
🔎 Which groups show the highest adoption across roles or regions, and how do personal factors like student status influence enrollment?
✨ Enhanced Assignment Context – The Benefits subject area combines familiar common dimensions — like business unit, department, or grade — to ground your benefits analysis in today’s structure. At the same time, you can pivot to see those same common dimensions in the context of when a benefit event actually occurred, so you can interpret benefits not just by what happened, but also by where in the organization it happened.
Visualize It: From Questions to Answers
💡 “When we start asking the right questions, the answers reveal patterns, behaviors, and moments that matter.”
Every benefits program tells a story — not just of plans and policies, but of people and their choices. That story begins with a simple but essential question: What percentage of workers are benefits-eligible, and how many of them actively enroll in plans? This distinction between eligibility and action sets the foundation for understanding participation.
But enrollment is never static. Choices evolve, and timing plays its part. Patterns emerge when we ask whether there are seasonal trends in how workers modify their benefit elections, uncovering the rhythms of adoption and adjustment across the year.
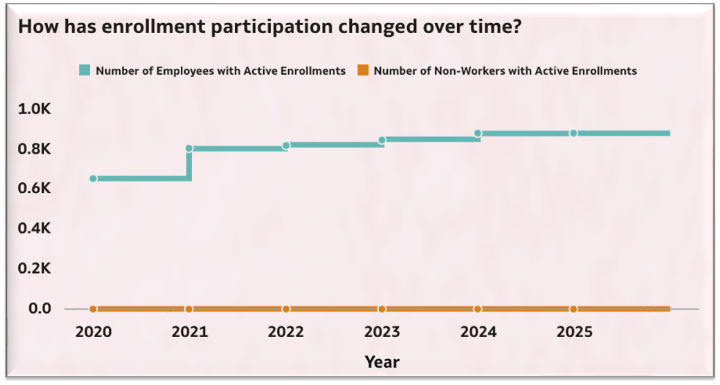
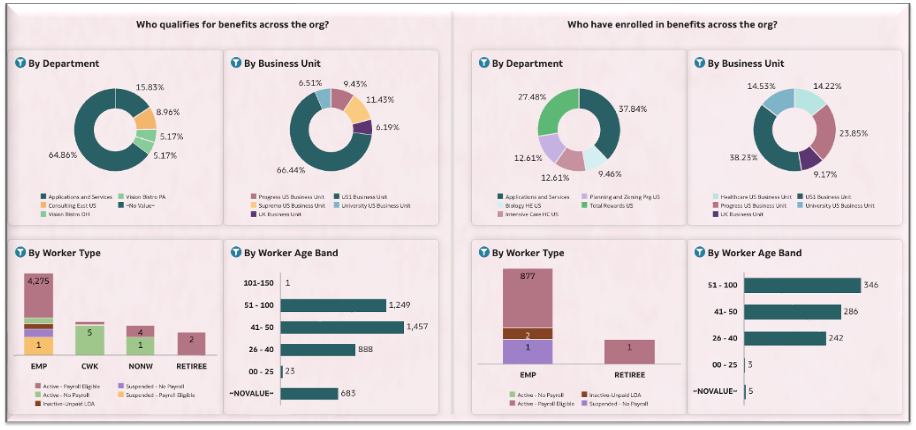
From timing, the lens shifts to preference: Which plans do employees and non-workers gravitate toward, and how does this vary across demographic segments? Here, insights reveal not just popularity, but also the diversity of needs shaped by role, age, or life stage.
Preferences often tie back to moments that matter. Life events such as marriage, childbirth, or retirement can spark changes, prompting us to explore which of these most strongly influence benefit enrollment.
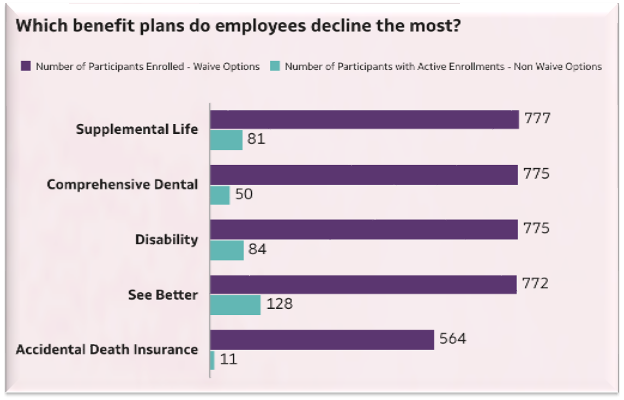
Not every decision is about adoption, though. Equally powerful stories exist in the patterns of workers opting out or declining certain benefits — choices that reflect priorities or trade-offs.
The Bigger Picture
A strong benefits strategy isn’t just administration, it’s about building trust and care. The new Benefits subject area in Oracle HCM FDI empowers benefit managers and administrators to uncover which programs resonate most, how preferences shift over time, and where policies need fine-tuning.
🌟 “Because benefits well managed are benefits well experienced.”
Getting started is simple: Enable the Benefits functional area in the Enable Features configuration panel. From there, you can explore participation, track engagement trends, and refine offerings with data-driven clarity.
For guidance, check out the Benefit Analytics in Oracle HCM Fusion Data Intelligence (FDI) – Sample DVA post in the Oracle Analytics Community.
Call to Action
Learn more about Oracle Fusion HCM Analytics.
Follow us on Twitter@OracleAnalytics, and connect with us on LinkedIn.