Introduction
Welcome to Part 4 of the Unlocking Custom Extensions in Oracle Analytics blog series! In Part 3, you explored the Grammar panel and the Data Model Handler, which help structure data for visualizations. Now, dive deeper into data modeling and mapping layers, which form the bridge between visualizations and data sources. Understanding these concepts is crucial for integrating data sources and displaying data accurately and efficiently.
This article breaks down the fundamentals of data models, edges, layers, and mappings, helping you structure your data effectively. This article sets the stage for Part 5, where you’ll explore integrating external data sources into custom extensions.
Let’s get started!
What’s Data Modeling?
Data modeling is the foundation of how data is structured and utilized within a visualization. It defines how data from a query is processed, formatted, and displayed, ensuring that visual elements correctly represent underlying datasets. Data can be structured in a flat (tabular) format or a multi-dimensional (cube) format, depending on how you want to analyze and visualize it. Multiple data models can coexist within a single visualization, all managed using the Data Model API.
Key Components of Data Modeling
The primary elements include:
- DataModel: Defines the structure of the data.
- DataLayout: Represents the actual returned data and is used to access it.
- Visualization Requirements: Defines drop targets for edges in the visualization and maps them to data model locations.
Once a query executes, changes to the DataModel impact the analysis XML, which determines how data is retrieved and rendered within the visualization.
Core Concepts in Data Modeling
- Types of data columns
- Measures (Metrics): Numeric values like Sales, Profit, etc.
- Attributes (Categorical): Descriptive fields like Customer Segment, Product Category, etc.
- Edges and layers
- An edge organizes data within a visualization by acting as an axis. Each edge consists of one or more layers, which are columns from the query.
- A layer is a column within an edge. Indexing starts from 0 (first layer is 0, second is 1, and so on).
- Common Edge types
- Row_Edge defines the row axis, and typically determines how many rows the structure will return. For tabular structure, only the row edge is used.
- Column_Edge defines the column axis, and how many columns are represented in a cube structure. The column edge isn’t used for tabular (table) structures.
- Data_Edge represents the intersection of the row and column edges. The data edge contains the ‘center’ data of a pivot table or a chart visualization.
Logical vs Physical Data Model
Logical Data Model
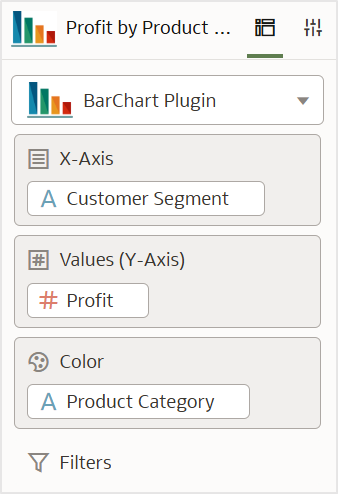
- Logical model seen by users in the UI (dragging and dropping fields in the Grammar panel), as shown in figure 1.
- Dictates how data is displayed in the visualization.
Physical Data Model
- Used by the back end uses to execute queries and retrieve data.
- When a field is used in a visualization, it’s mapped from the logical model to the physical model.
Mapping Between Logical and Physical Data Models
- Defines the logical edges required for the visualization.
- Maps logical edges to physical edges to ensure proper data representation.
Implementing Data Models in a Custom Extension
In Part 1, you created a bar chart custom extension. Figure 2 displays the file structure.
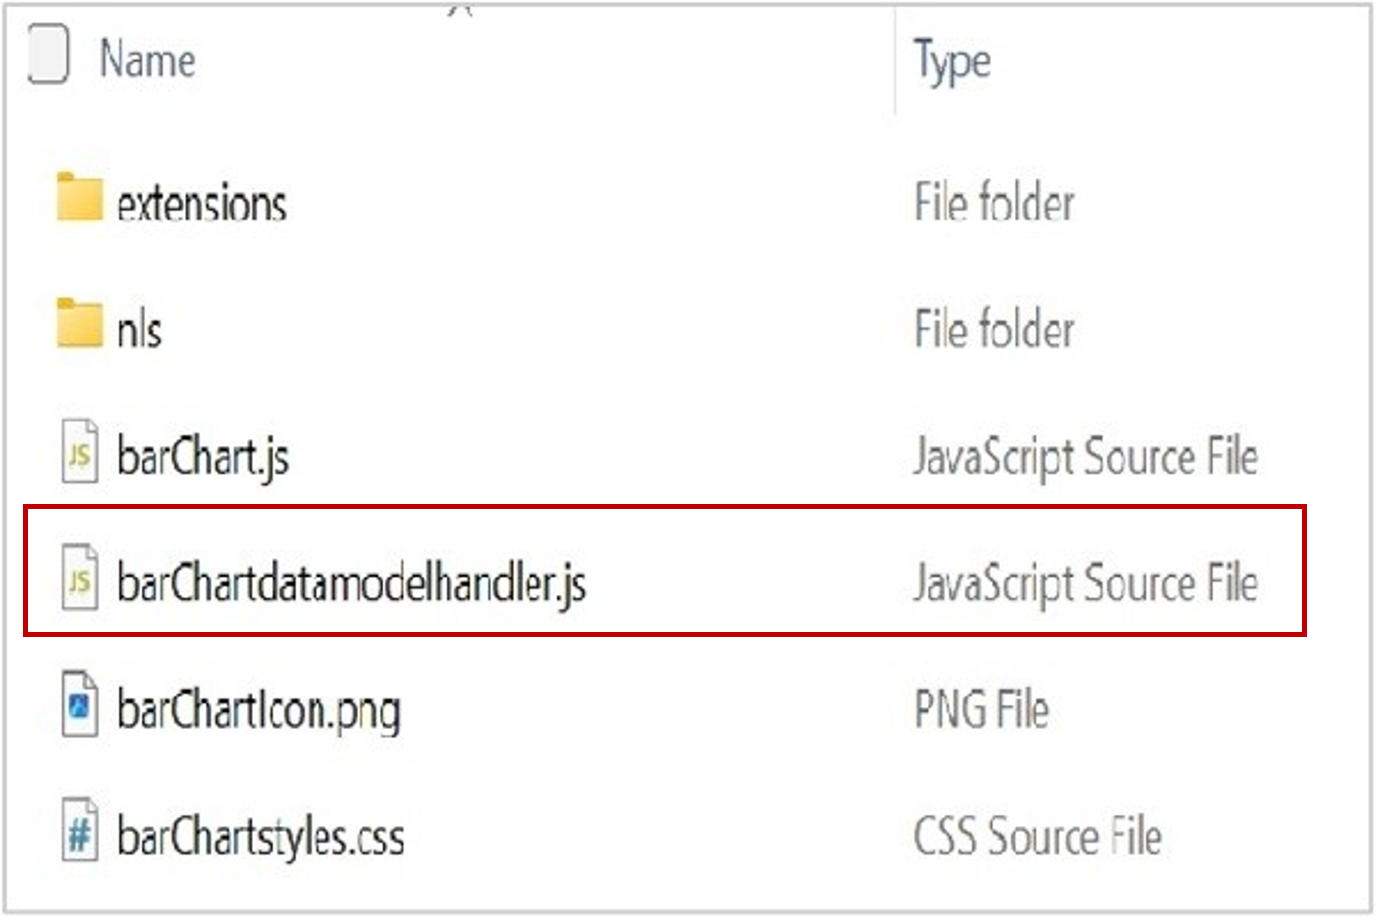
To understand data modeling in action, consider the barChartdatamodelhandler.js script, which defines how data is structured and mapped in a custom bar chart extension. The script ensures that data fields are correctly assigned to visualization components, enabling a seamless interaction between the back-end data model and the front-end visualization.
Key Components of barChartdatamodelhandler.js
The script includes dependencies that handle data modeling and mapping:
Module Dependencies
define(['obitech-framework/jsx',

        'obitech-reportservices/datamodelshapes',

        'obitech-viz/genericDataModelHandler',

        'obitech-report/vizdatamodelsmanager'],

        function(jsx,

                 datamodelshapes,

                 genericDataModelHandler,

                 vdm) {
- ‘obitech-reportservices/datamodelshapes’: Defines logical and physical data model structures.
- ‘obitech-viz/genericDataModelHandler’: Uses as the base class for data model handling.
- ‘obitech-report/vizdatamodelsmanager’: Provides a mapper for configuring data placement.
Defining Mapping Layers
The core functionality of the script is handled within the getLogicalMapper function, which maps logical fields (such as color, size, details) to physical placements (such as row, column).
    BarChartDataModelHandler.prototype.getLogicalMapper = function () {

      var oData = new datamodelshapes.PhysicalPlacement(datamodelshapes.Physical.DATA);

      var oRow = new datamodelshapes.PhysicalPlacement(datamodelshapes.Physical.ROW);

      var oCol = new datamodelshapes.PhysicalPlacement(datamodelshapes.Physical.COLUMN);

      var oMapper = new vdm.Mapper();

      oMapper.addCategoricalMapping(datamodelshapes.Logical.SIZE,   null);

      oMapper.addCategoricalMapping(datamodelshapes.Logical.COLOR,  oRow);

      oMapper.addCategoricalMapping(datamodelshapes.Logical.ROW, oRow);

      oMapper.addMeasureMapping(datamodelshapes.Logical.SIZE,   null);

      oMapper.addMeasureMapping(datamodelshapes.Logical.COLOR,  null);

      oMapper.addMeasureMapping(datamodelshapes.Logical.MEASURES, oData);

      oMapper.setDefaultPhysicalMeasureLabel(datamodelshapes.Physical.COLUMN, this.getMeasureLabelConfig().visibility);

      return oMapper;

   };
Breaking down the code
1. Defining Physical Placements
var oData = new datamodelshapes.PhysicalPlacement(datamodelshapes.Physical.DATA);
var oRow = new datamodelshapes.PhysicalPlacement(datamodelshapes.Physical.ROW);
var oCol = new datamodelshapes.PhysicalPlacement(datamodelshapes.Physical.COLUMN);
It specifies locations where data should be placed:
- oData represents the core data placement
- oRow represents the row placement
- oCol represents the column placement
2. Initializing the Mapper
var oMapper = new vdm.Mapper();
The mapper manages the relationship between logical and physical data structures.
3. Configuring Categorical Mapping
oMapper.addCategoricalMapping(datamodelshapes.Logical.SIZE, null);
oMapper.addCategoricalMapping(datamodelshapes.Logical.COLOR, oRow);
oMapper.addCategoricalMapping(datamodelshapes.Logical.ROW, oRow);
- Color and row map to the row axis
- Size isn’t mapped for categorical visualization
4. Configuring Measure Mapping
oMapper.addMeasureMapping(datamodelshapes.Logical.SIZE, null);
oMapper.addMeasureMapping(datamodelshapes.Logical.COLOR, null);
oMapper.addMeasureMapping(datamodelshapes.Logical.MEASURES, oData);
Measure fields are assigned to the data placement, ensuring numerical values are correctly plotted.
5. Setting Default Measure Labels
oMapper.setDefaultPhysicalMeasureLabel(datamodelshapes.Physical.COLUMN, this.getMeasureLabelConfig().visibility);
Ensures that measure labels appear on the column axis, improving readability in the visualization.
Summary
Understanding data modeling and mapping is essential for building effective custom extensions in Oracle Analytics. The barChartdatamodelhandler.js script customizes how data fields are structured and mapped within a custom bar chart visualization.
Key takeaways:
- Logical to physical mapping: The script bridges the gap between logical data fields and their physical placements.
- Categorical fields (row and color) are mapped to the row axis.
- Measure fields (measures) are mapped to the data axis.
- Dynamic data handling: The mapper function ensures that logical fields dynamically adjust to visualizatiion requirements.
By understanding these concepts, you can structure data models, optimize mappings, and create more intuitive and interactive visualizations. In Part 5, we’ll dive deeper into integrating external data sources, unlocking even greater potential for custom extensions in Oracle Analytics.
Continue exploring these concepts with peers in the Oracle Analytics Community — a free platform for questions, ideas, and collaboration.