From semiconductors to construction materials, recent supply chain upheavals – with material shortages, ports congestion, and the consequences of a global pandemic resulting in production disruptions and factory shutdowns—have made it difficult for consumers to get hold of everyday products. While customers scramble to find even baby formula, there lies a bigger concern for those in the supply chain world: Is this going to be our “new normal” for the long haul? Not only are companies fighting against a myriad of political and environmental challenges, but a growing inflation could just be the last straw. Disruption is not new, but there is disagreement among organizations as to how to cement the cracks across the entire chain while still remaining profitable. Rather than cement, it’s time to redefine supply chain instead.
End-to-end visibility of supply chain performance will be a key differentiator for this purpose, but data visibility is just the tip of the iceberg. Leaders need to set the right key performance indicators (KPIs), measure, and analyze the results so they can orchestrate their entire supply chain with ease. With the right KPIs in place, organizations can become agile enough to identify bottlenecks, eliminate manual errors, analyze risks, and predict outcomes to increase resilience during uncertain times. Knowing which vendor, product lines, and routes are at risk empowers you to be agile enough to change course at any given time with confidence.
Top Order Fulfilment KPIs to Unblock Bottlenecks
In 2015, Target’s entry into Canada came to a halt with mismatched inventory and barcode issues on Barbie toy cars that led to over $2 billion in losses. A classic case of poor order fulfillment and frustrated customers; the toy car fiasco was so overwhelming that it has kept Target out of the Canadian market ever since. Having a smooth order fulfillment system that communicates effectively with customers about shipping is an essential part of being able to compete in today’s fast-paced environments. Here are a few KPIs to support your order fulfilment goals:
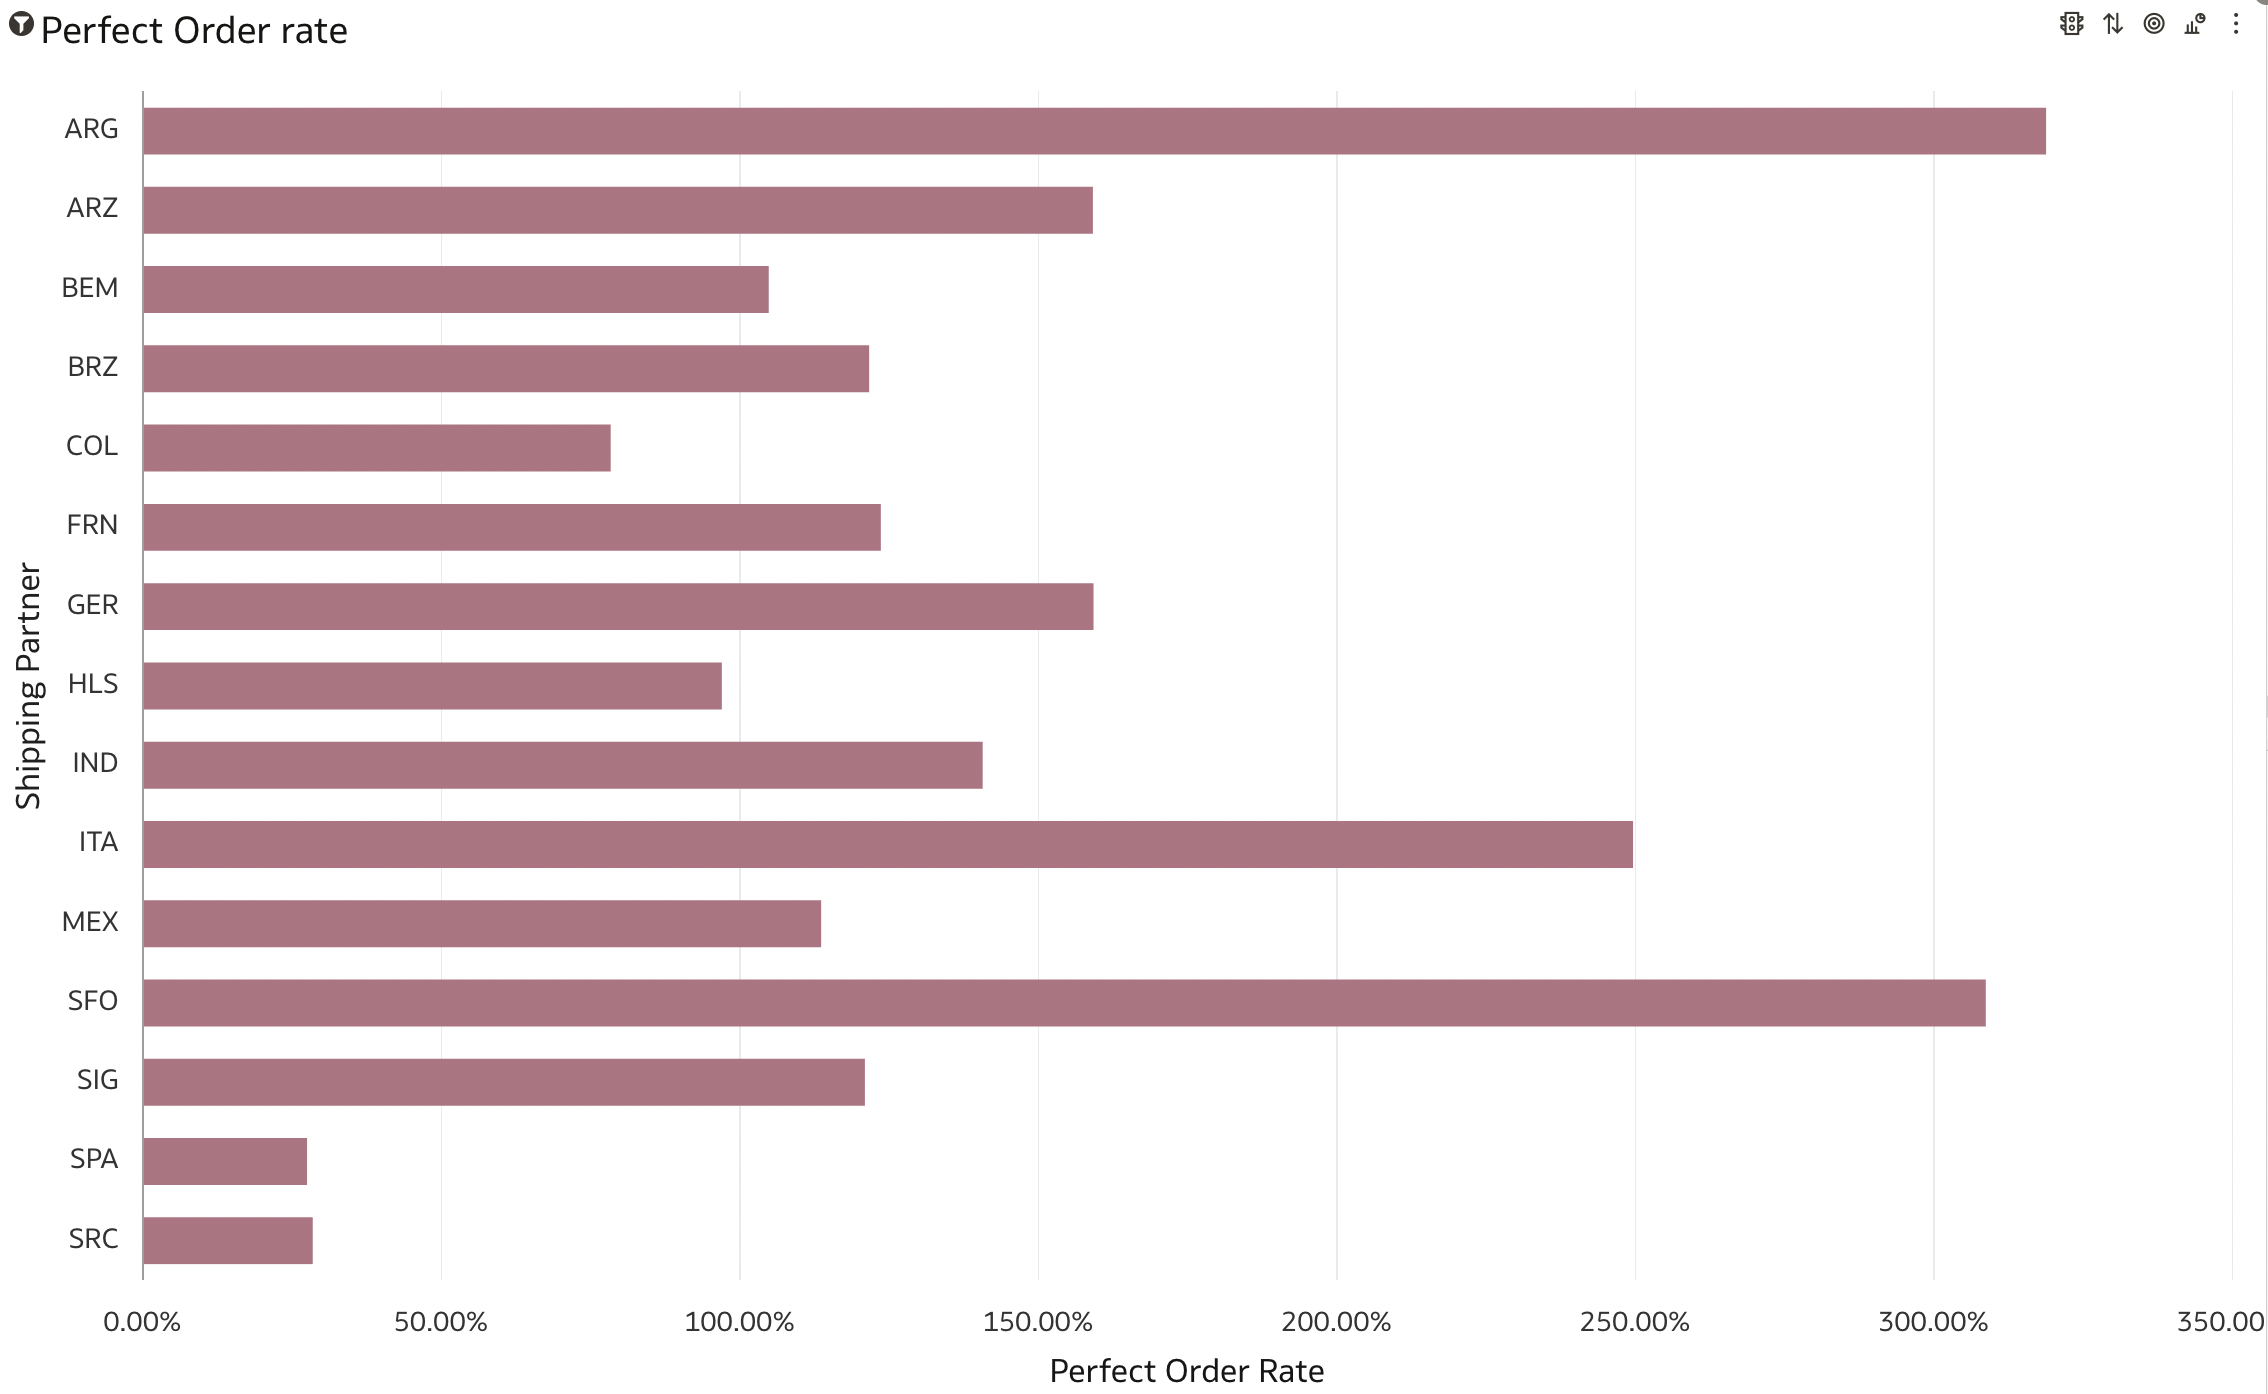
- Perfect Order Rate (POR): This indicates the rate at which goods have been shipped out without any damage, inaccuracies, or delivery issues. Reaching a 100% perfect order is a top goal many product companies strive for, since its symbiotic with customer experience. The POR KPI can be adversely affected by lack of inventory, mismanagement of goods in the warehouse, or incomplete orders being shipped out. If the POR is low, you should be able to quickly backtrack to various underlying metrics to find the root cause. For example, was the inventory low on the given day? Or were there any check issues in the “pick and pack” process which resulted in incomplete products being shipped? These are details that need to be at your fingertips to make necessary changes.
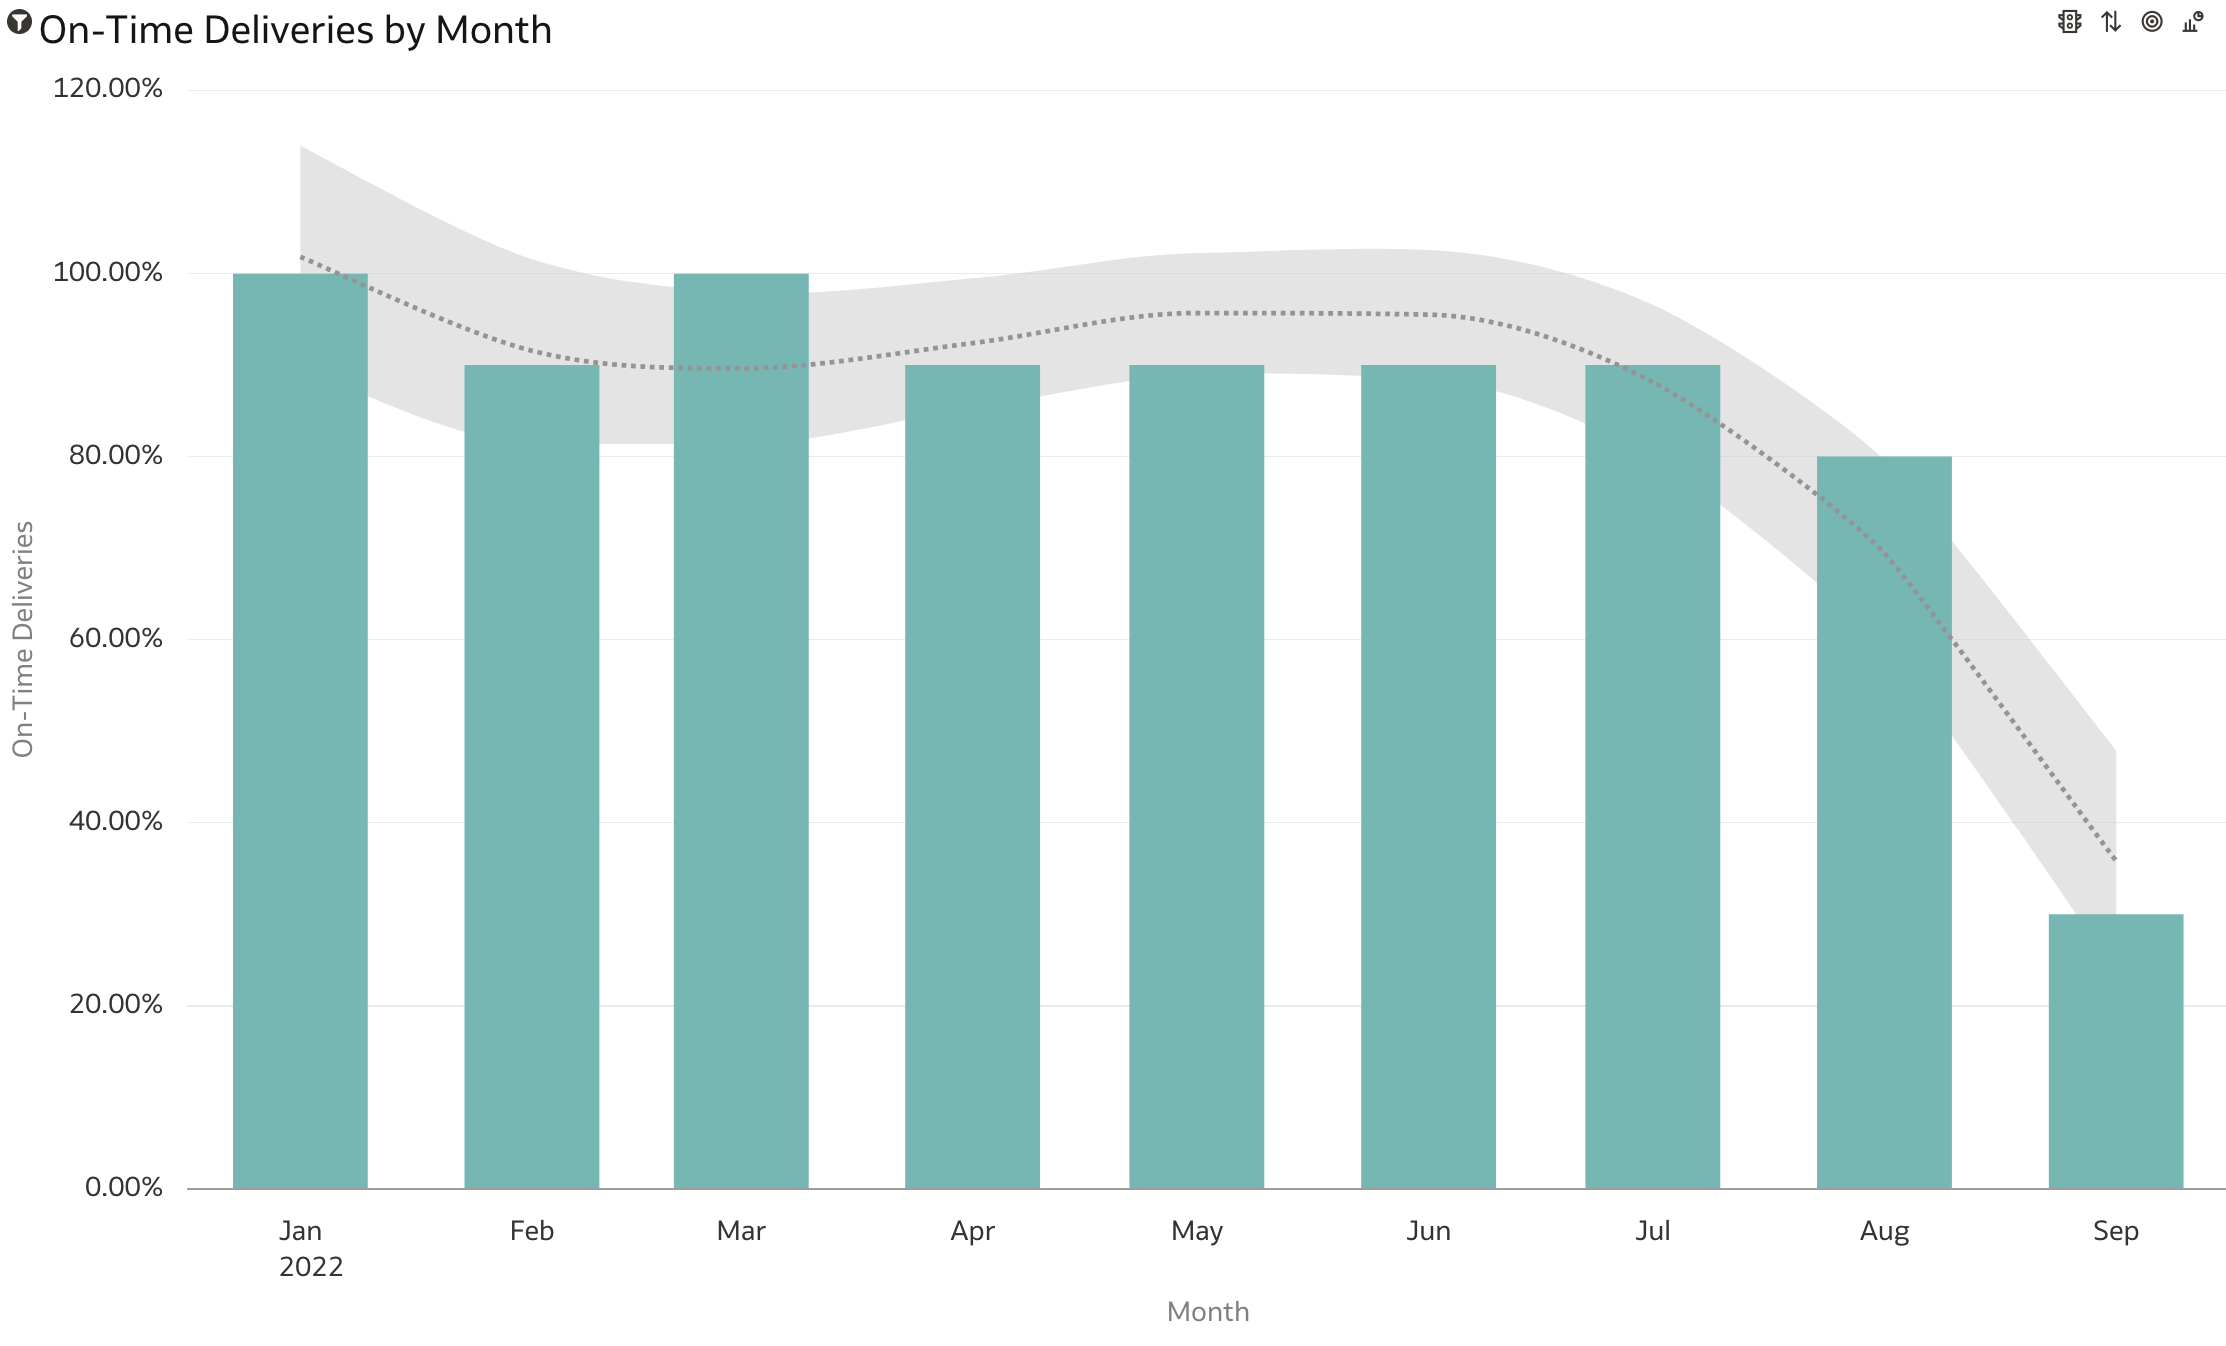
- On-Time Delivery (OTD): Delivering your goods on time not only means goods are out of your warehouse fast but also means increased collaboration with your customers and greater loyalty. Delays can occur due to inventory issues, manual errors, or damaged goods. The lower the OTD rate, the higher order cancellations will be. For example, if you notice OTD has dropped over a specific period, your next step would be to break down the reasons by analyzing various metrics such as inventory inaccuracies, supplier delays, late pickups, and return rates. This will help you derive insight-driven actions using unified analytics across all points of your supply chain.
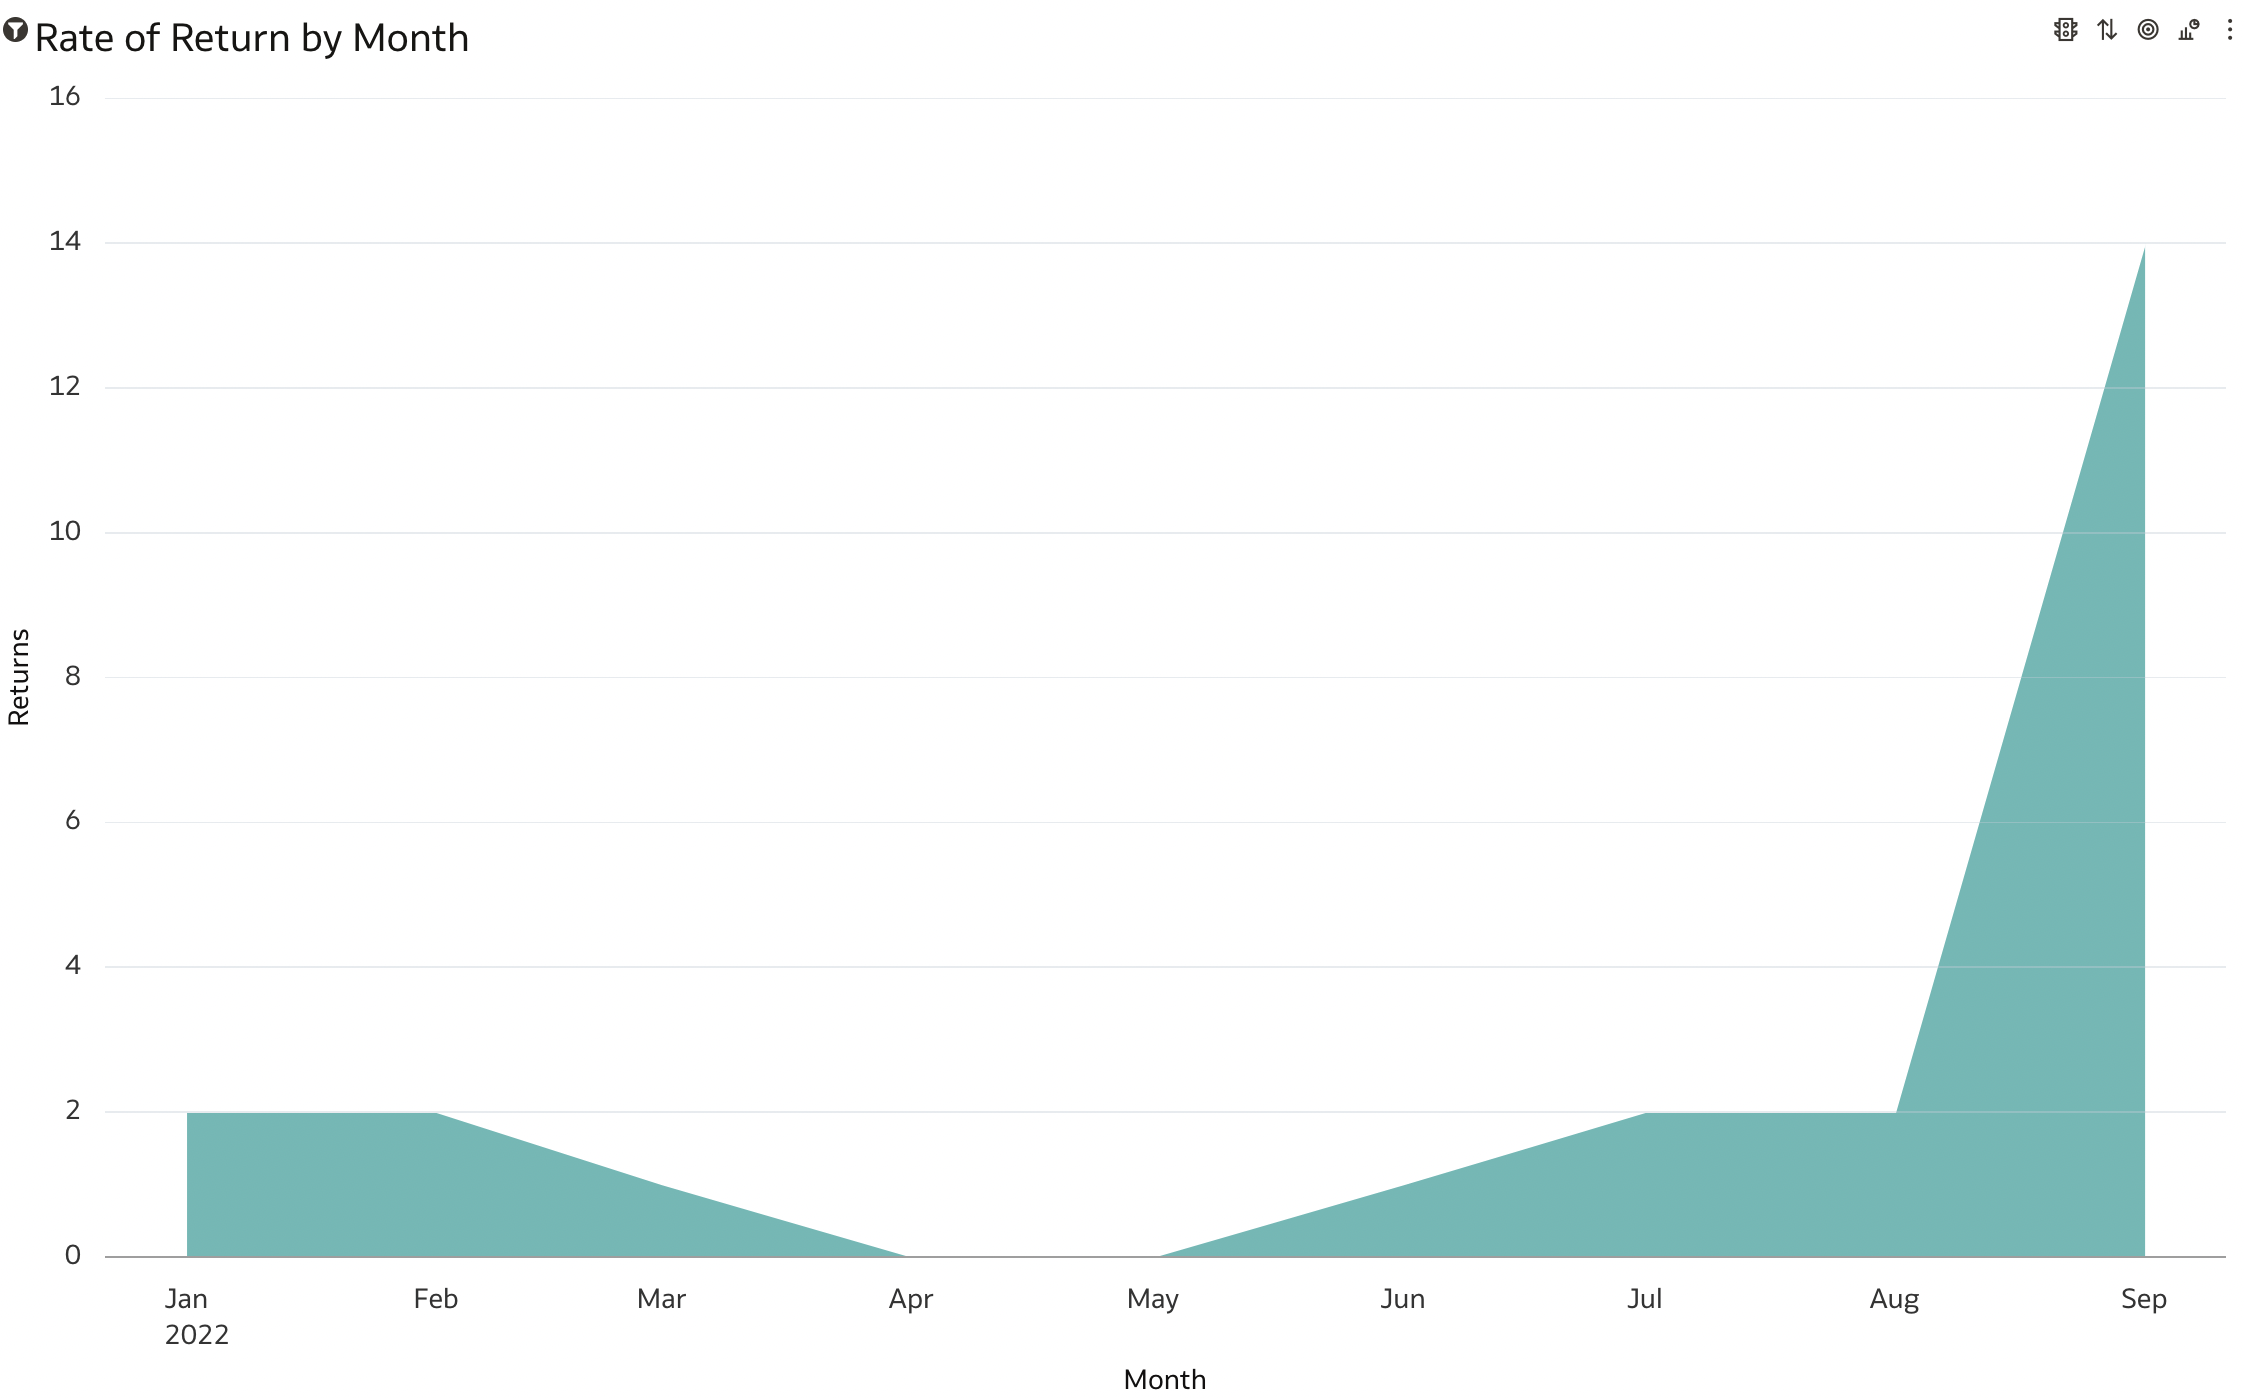
- Rate of Return (RoR): Customer returns tend to be higher for online shopping, and this costs organizations time, resources, and money. It can also negatively affect the shopping experience. With the changes we’ve all experienced in the last two years, consumers have shopped online more than ever but are also returning at a higher rate—with recent reports of return rates reaching 16.6% in 2021 compared to just 10.6% in 2020. Businesses need to better understand return reasons and categorize them into meaningful categories such as defective goods, inaccurate orders, or lost interest, and most importantly, correlate them with other KPIs, whether from supply chain, finance, sales & marketing, etc. Spikes in any of these categories suggests the issue at hand. For example, a potential cause for a higher RoR could be an increase in the product defects rate. If we also see a spike in supplier costs and support calls, and a decrease in net promoter score, then all of this may suggest supplier quality issues that require investigation.
Top Inventory KPIs to Predict Demand
Of the various types of Inventory KPIs, those used for measuring how fast you can get your product back on the shelves after a disruption are the most essential ones. Some of the leading retailers are currently struggling with excess inventory since inflation-concerned users are steering clear of active wear, hoodies, and house plants which were all the rage during the first two years of the pandemic. Dealing with excess inventory or lack of it is a top concern keeping business leaders up at night. Some of the top inventory KPIs to consider in alignment with consumer demands are:
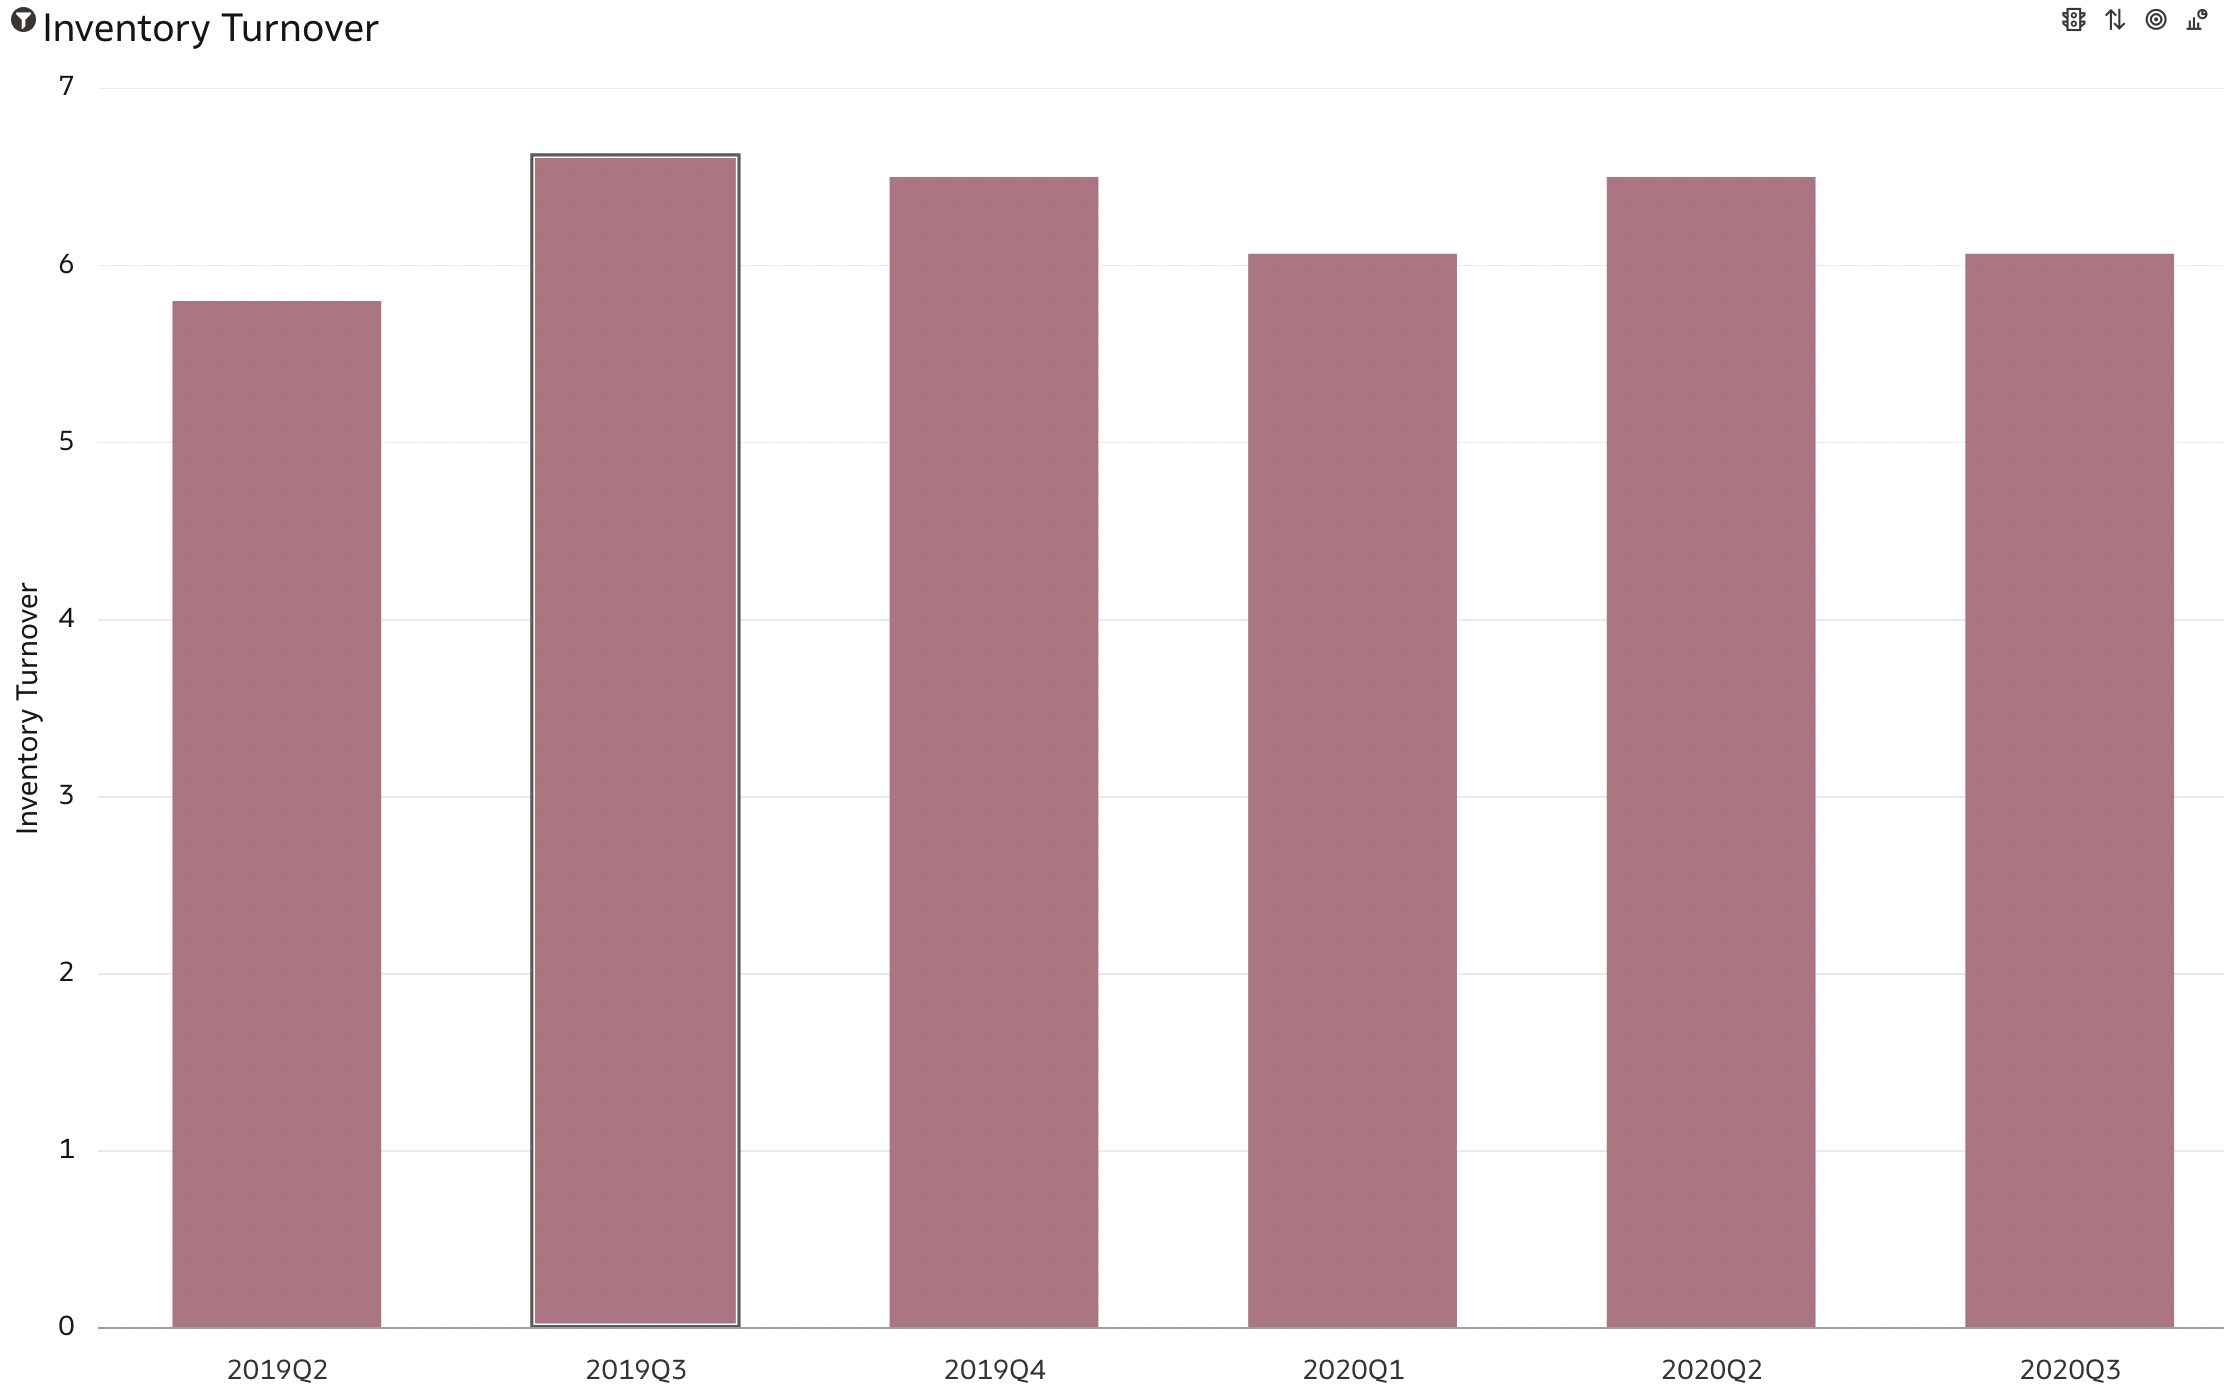
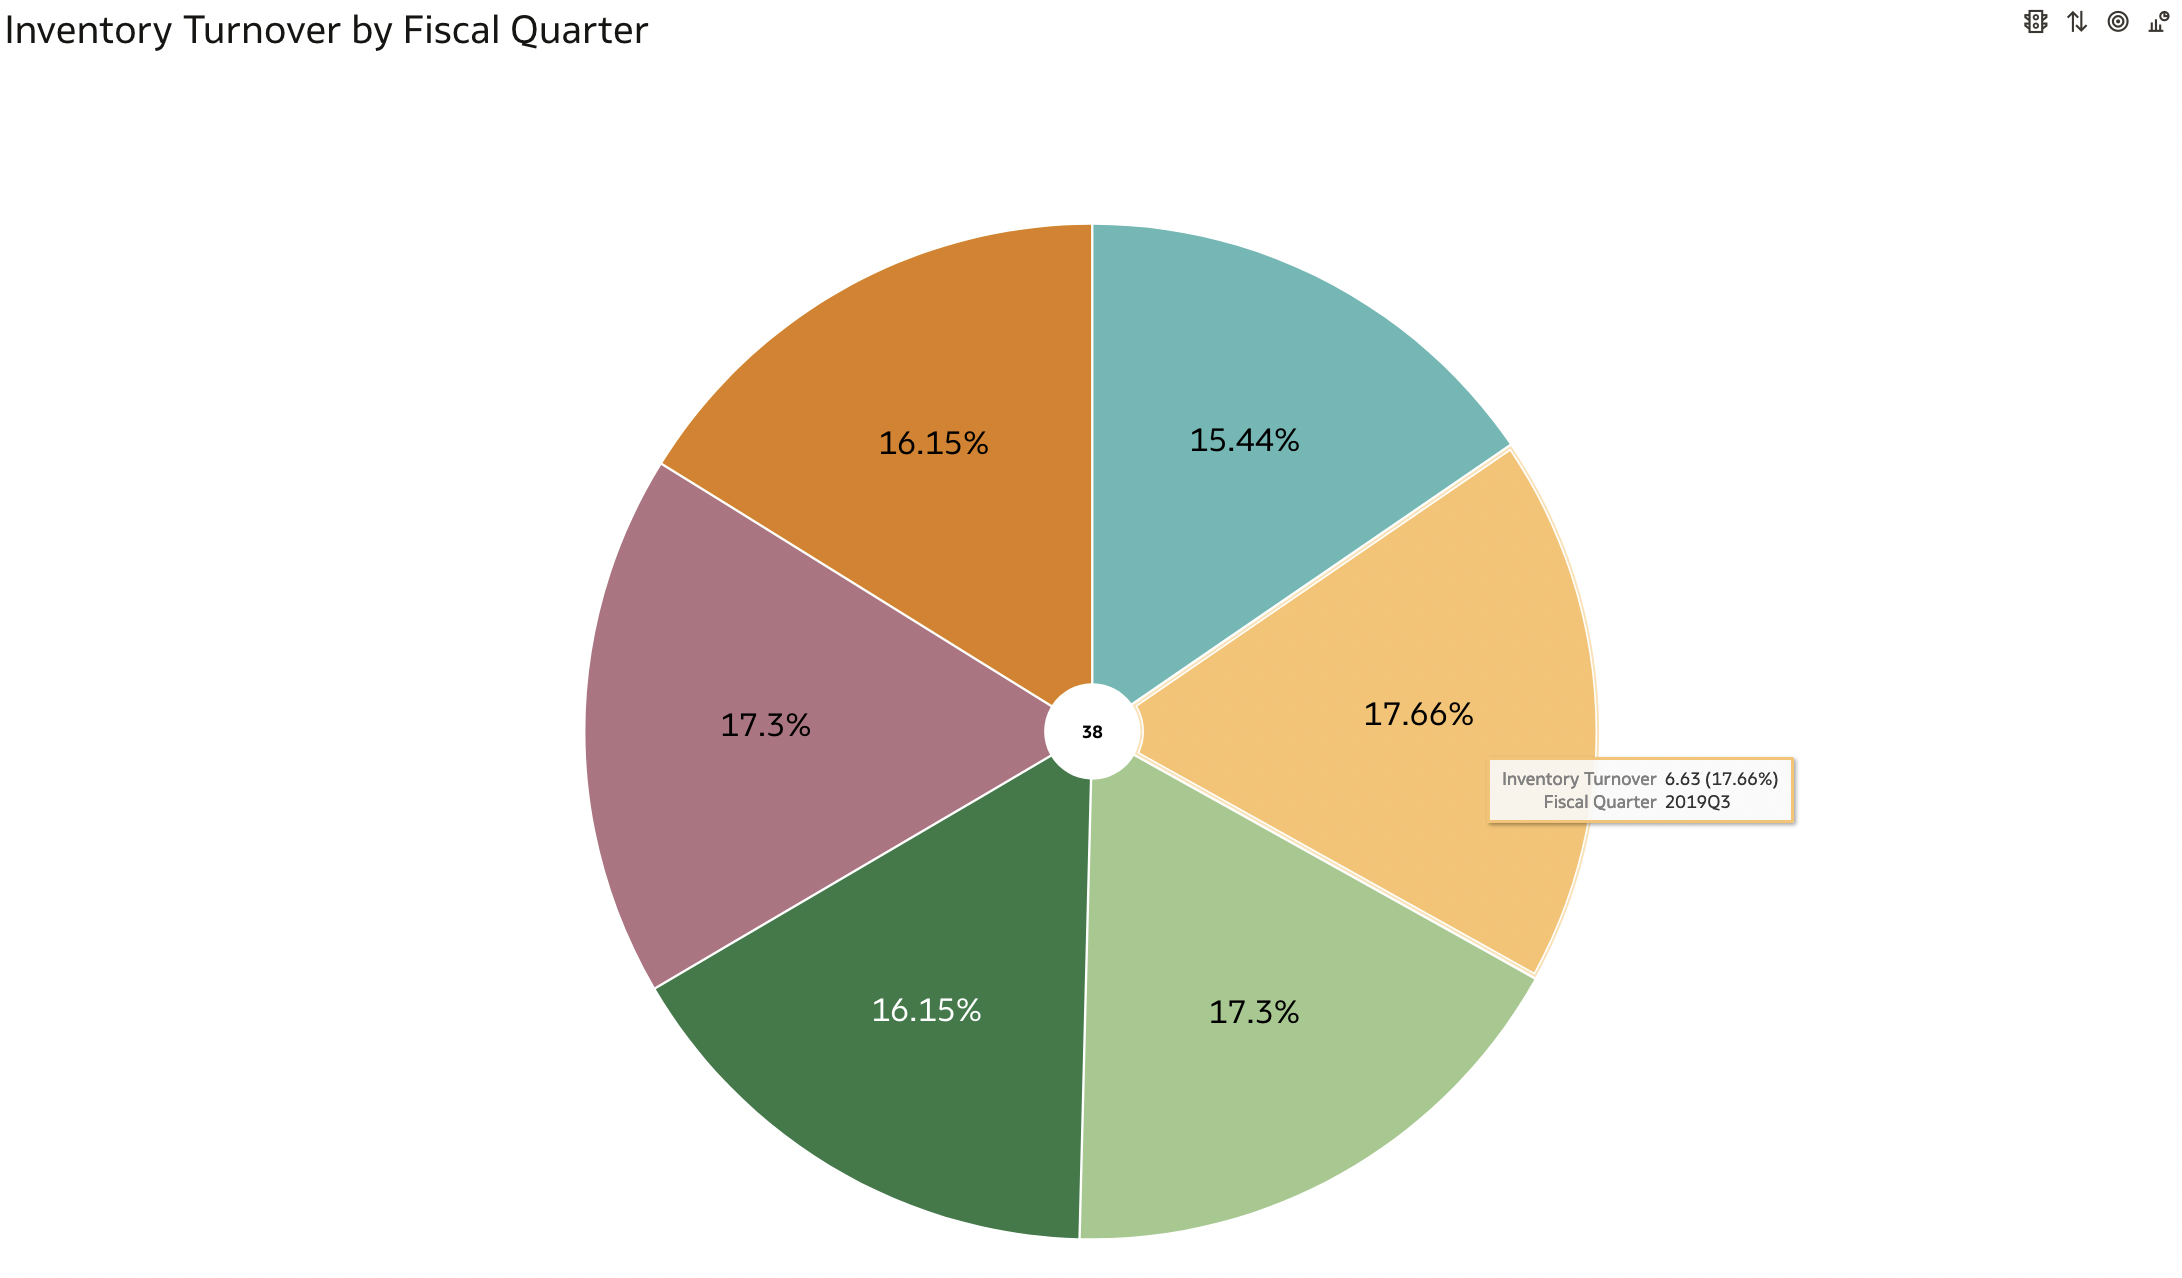
- Inventory turnover: This is a key indicator of a company’s business performance and tells you how quickly you sell your stock. If you’re selling faster than planned, that’s good; if not, then it might be time to look closer. Since companies have been stockpiling due to concerns with production, low turnover could be an issue with excess stock and weak sales. Alternatively, with high turnover and accelerating sales figures, stockout issues may occur if not planned properly. Having access to real-time inventory stock level data and trends can help businesses predict several stockout or overstock scenarios.
- Inventory on hand: This tells you how much money has been tied up in unsold goods at any point during the year—and knowing this figure allows you to make better decisions about how much money should be spent on new stock purchases next fiscal year (or quarter).
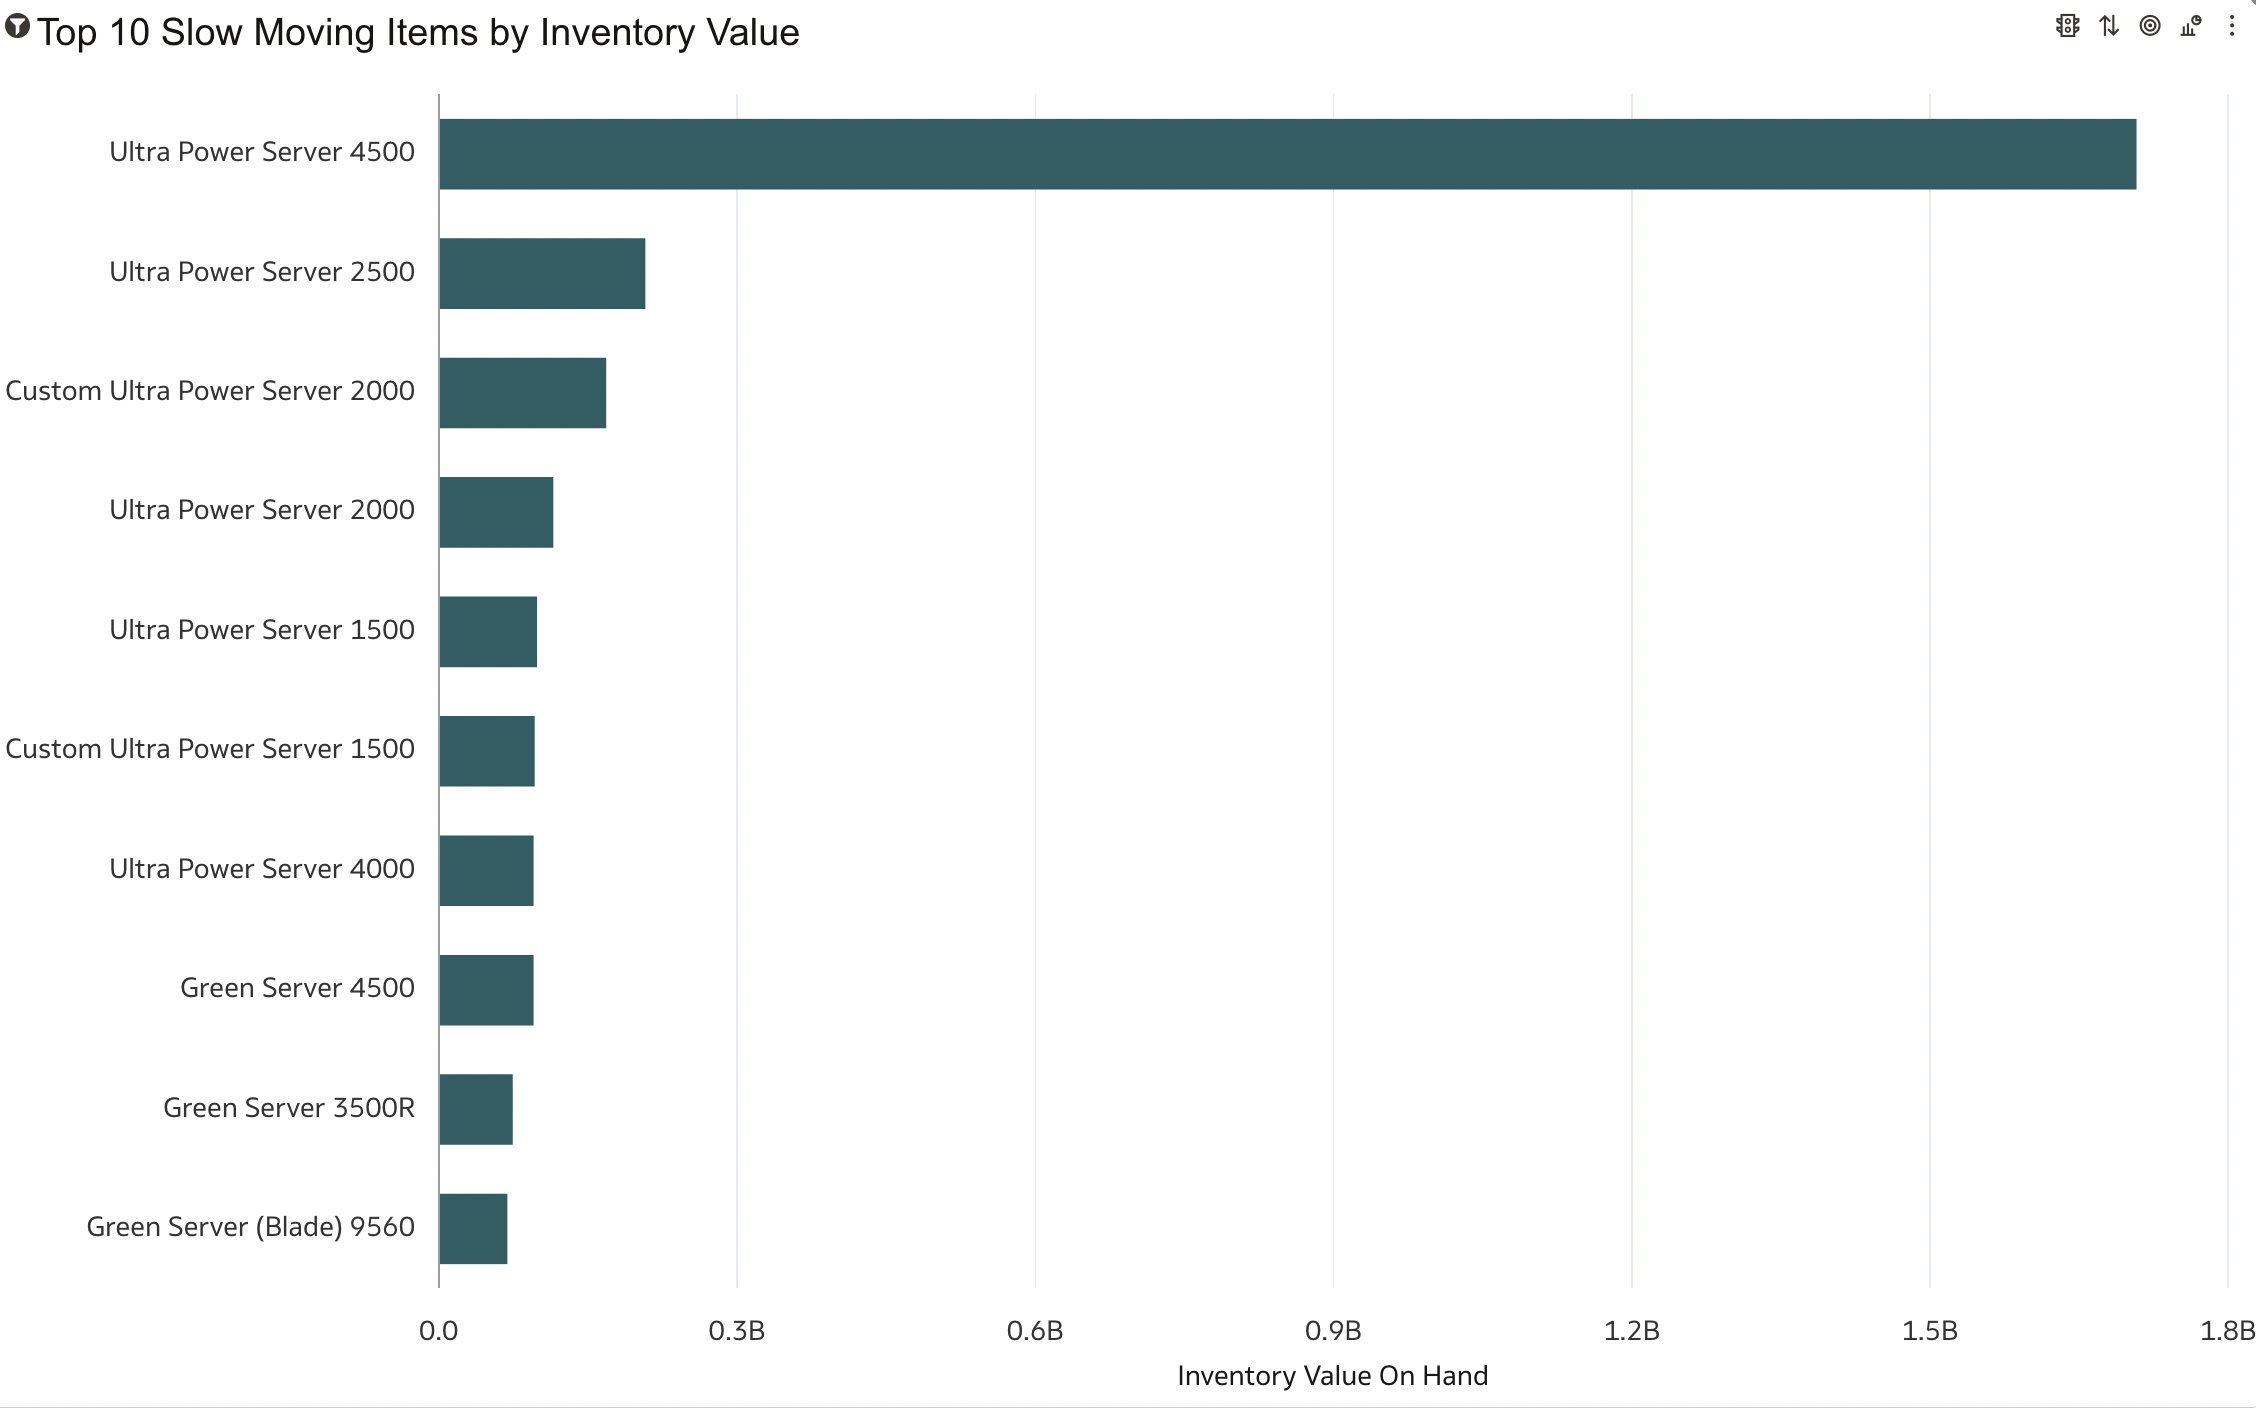
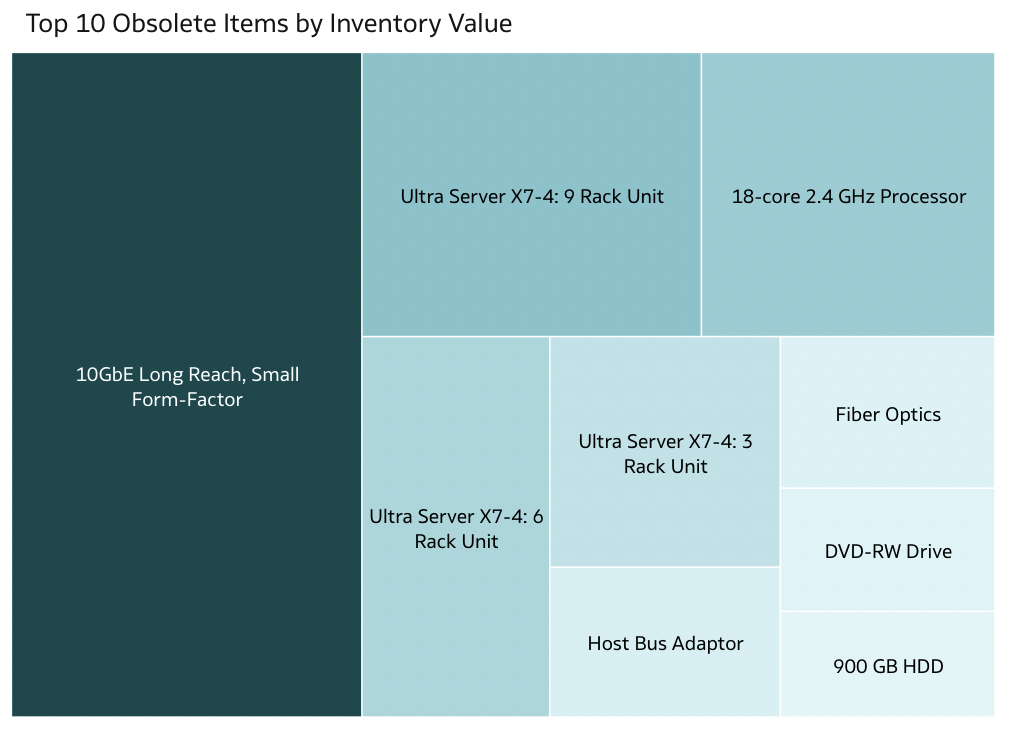
- Slow and obsolete inventory: As the name suggests, this is a crucial KPI to understand the status of inventory or lack thereof. Constant monitoring is imperative to avoid loss of sales, because you can’t sell what you don’t have. With full visibility of your slow moving or obsolete stock, you can decide internally how best to allocate products across certain locations based on demand, or you can select discounting options to move products off the shelf.
Top Procurement KPIs to Analyze Potential Risks
As analytics platforms evolve, embedding machine learning (ML) models, procurement teams can look at all available data – from past purchases, size of purchase orders, customer satisfaction ratings, even carbon emissions—and predictions about how likely a supplier might be to deliver on time or meet quality requirements. Here are the top three procurement KPIs:
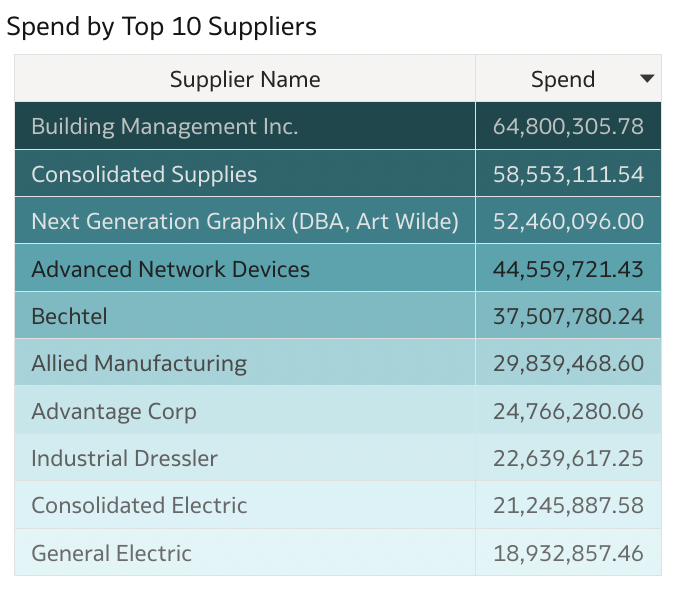
- Supplier Spend: Since a primary goal of Procurement is cost savings, Supplier spend gives you all the costs associated with suppliers that can provide goods for your customers at the lowest possible cost. A bird’s eye view of all your suppliers and the ability to drill down to see their costs can unearth opportunities for order consolidations and cost savings is imperative at a time of inflation.
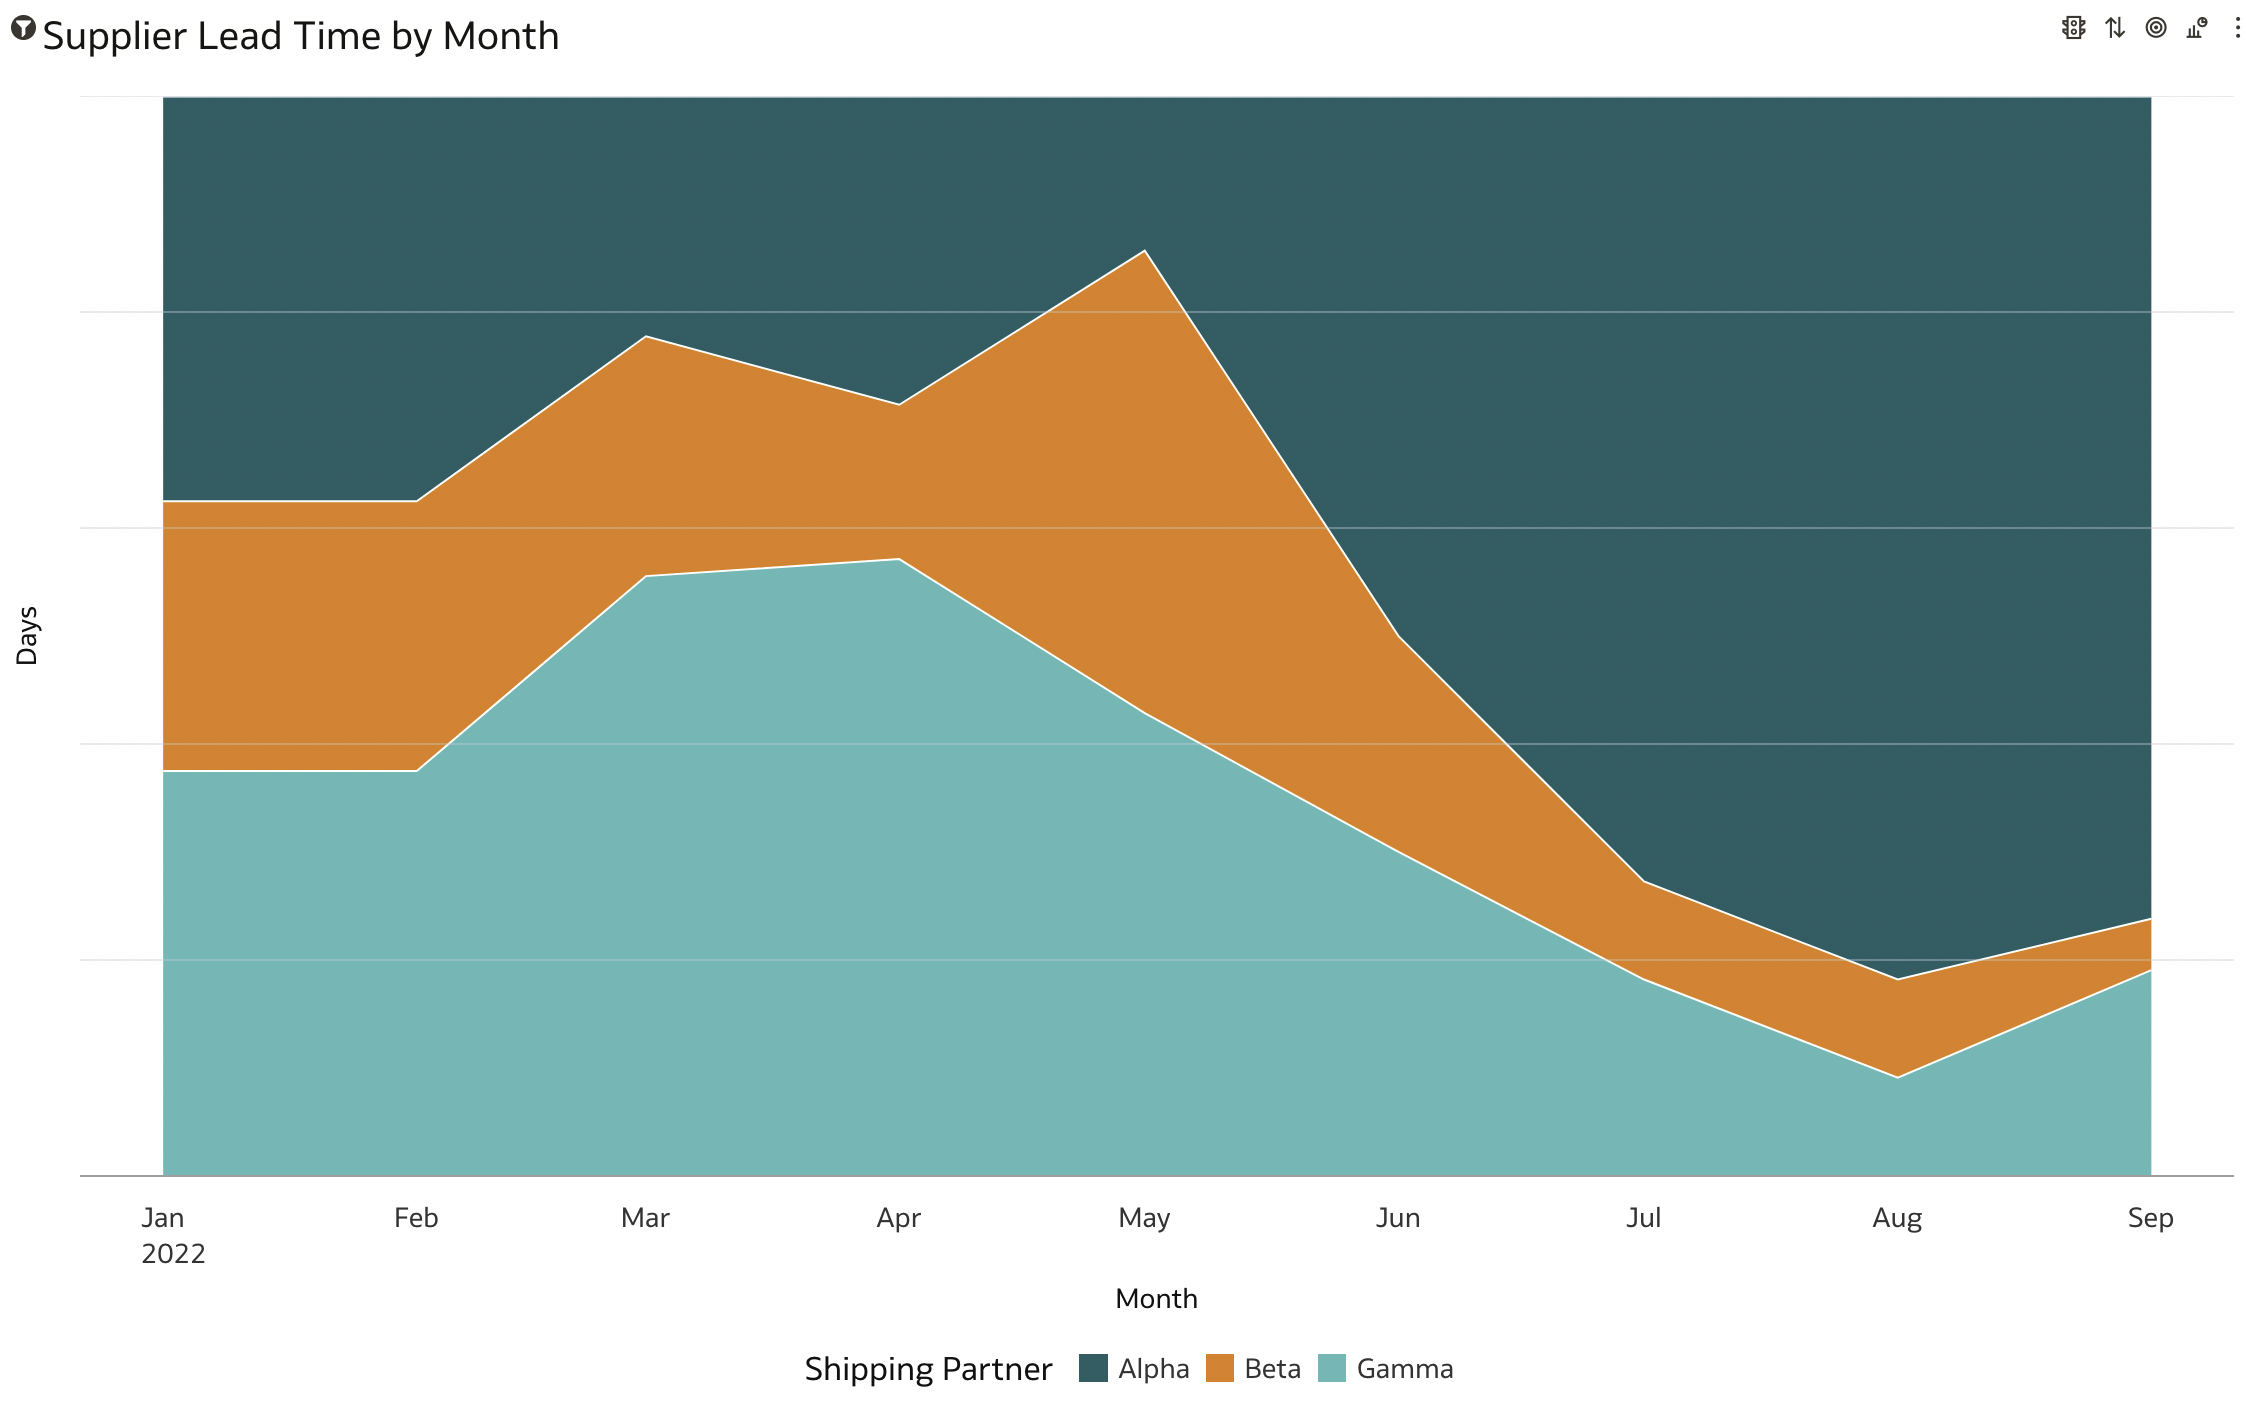
- Supplier Lead Time: This indicates the time between when an order was placed with a supplier and when were the goods delivered at your facility. Recent reports from the Institute for Supply Management (ISM) suggests that it takes an average of 100 days to receive final goods, the longest since 1987. Supplier lead time is critical for your vendor selection and by comparing supplier lead times, you get a clear picture on each supplier’s value and can strategize to diversify the supplier pool when you see deviances.
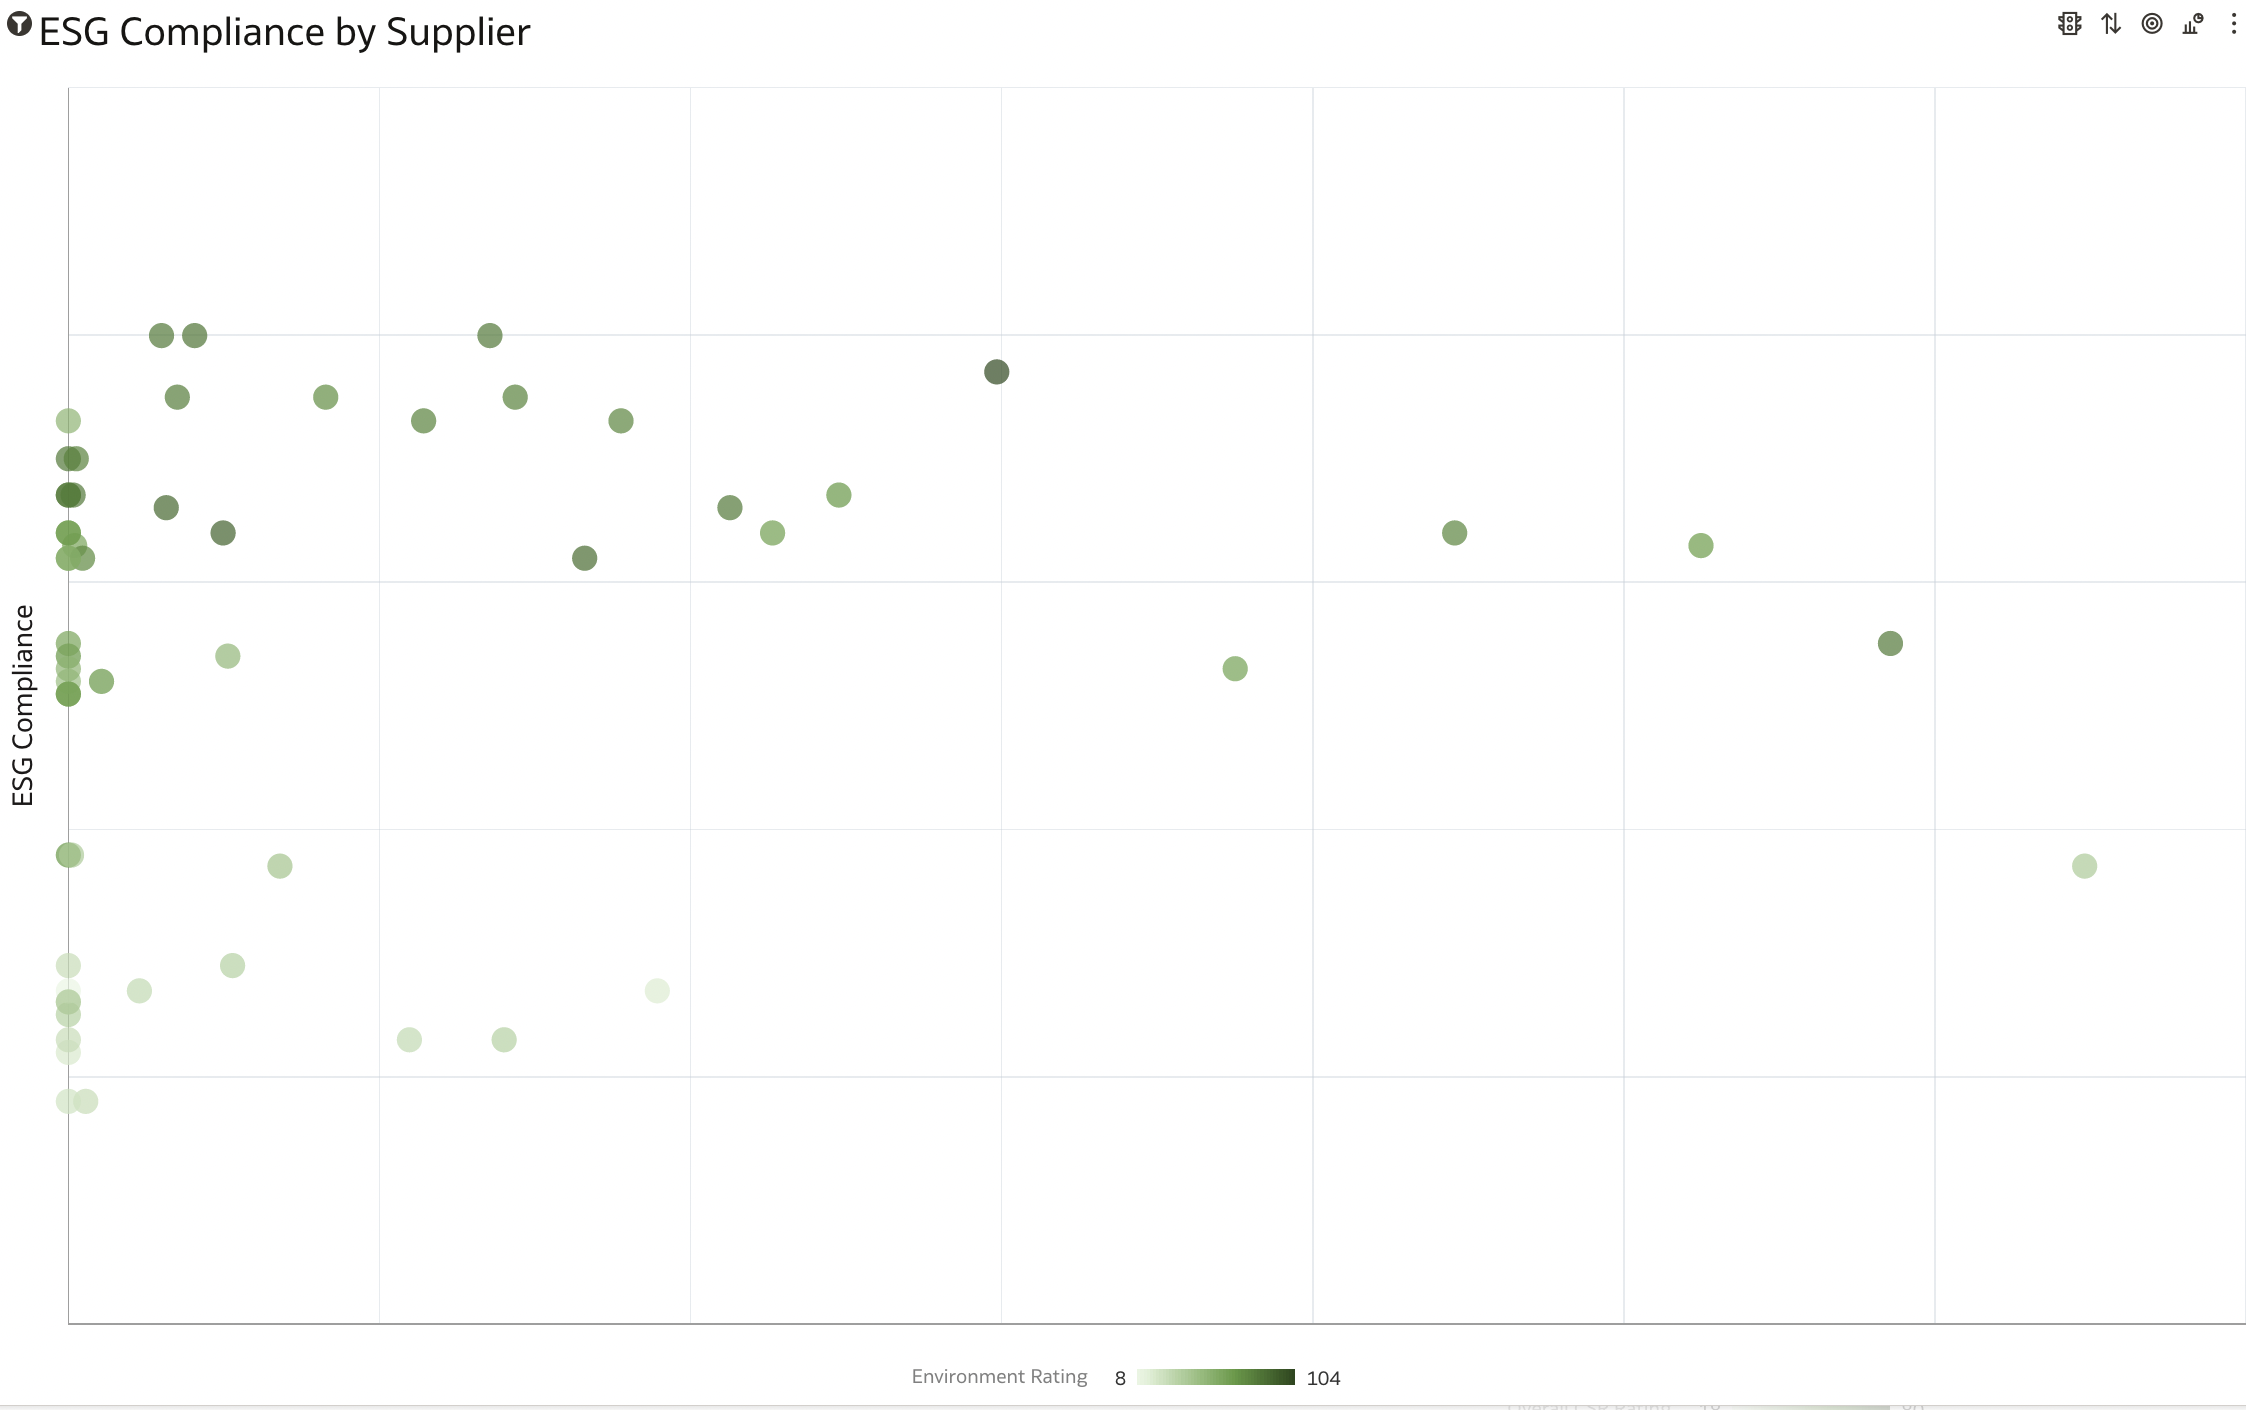
- Compliance Rate: This indicates the rate at which vendors conform to policies, procedures, and controls set between both parties. For example, ESG compliance is a critical metric used by companies to compare vendors based on their Environmental, Sustainability, and Governance policies and procedures. As supply chains become more complex, and as social concerns like labor conditions in manufacturing facilities become more prominent, ESG compliance is becoming critical for companies. As we move through a period where being profitable and socially responsible are both expected from businesses, ESG has grown in importance to meet these expectations. Businesses can assess overall supplier quality by analyzing combined ESG data that includes carbon emission rates, diversity metrics, and compliance with companies’ expected product standards.
Conclusion:
Supply chains are complex, and supply chain systems generate massive amounts of data. The key to orchestrating it is finding the right KPIs that will enable you to optimize your operations. Using a proper analytics platform that delivers supply chain and cross-departmental analytics, you can unearth simple solutions from unstructured and structured data, removing the guesswork from variability, and increasing predictability. Oracle Fusion Supply Chain Management (SCM) Analytics provides you with end-to-end supply chain analytics, unifying company-wide data across various departments with prebuilt KPIs that help you uncover trends and mitigate risks.
View our Free Product Tour here.