The Oracle Analytics Cloud (OAC) July 2025 update delivers Generative AI capabilities for consumers, while enhancing data modelling and visualization features for authors. Users can expect expanded AI functionality, stronger security for data connections, and new options for chart types and map visualizations.
Featured highlights:
AI-Powered Analytics
- AI Assistant available to workbook consumers
- Vector-Based Similarity Analysis for datasets
- Textual Narratives enhanced with LLM support
Data Connectivity, Modeling, and Preparation
- Private Access Channel (PAC) supported for Semantic Modeler
- Transparent update option for database connections
Exploring, Dashboarding, and Storytelling
- Create and share Custom Pages
- Custom formatting for Date, Time, or Timestamp data types
Performance, Compliance, and Administration
- New Administrator Console experience
AI-Powered Analytics
AI Assistant Available to Consumers
July brings OAC’s Generative AI capabilities directly to workbook consumers. Authors can now enable the Insights Panel on selected reports, enabling consumers to query their data using natural language, enhancing their data exploration with intelligent insights from the AI Assistant.
Vector-Based Similarity Analysis for Datasets
Oracle Analytics can now run similarity analysis on datasets by using vector technology. Similarity Analysis models are registered and run within Data Flows, enabling business users to identify the most similar records to the reference item. Once generated, results are easily visualized in workbooks through a variety of charts, like radar lines, network diagrams and pivot tables.

Textual Narratives enhanced with LLM support
The Language Narrative chart type has been enhanced with the July 2025 update. This adds greater specificity to the AI-generated text summaries of visual charts, allowing authors to control the tone of the text as well as the level of detail. Authors can choose between formal, casual, and business tones, directly fine-tuning the resulting insights to meet the needs of end consumers.
AI Explain on Workbook Calculations
Authors can now access advanced insights on their workbook calculations using the AI-powered Explain functionality. In just a few clicks, authors can initiate in-depth data analysis on their workbook calculations, covering basic facts, key drivers, and segments. The resulting charts can be easily integrated directly into workbooks through direct selection or the select all option.
Data Connectivity, Modeling, and Preparation
Private Access Channel Support in Semantic Modeler
The July 2025 update introduces Git integration for Semantic Modeler via Private Access Channels (PAC), enabling developers to securely connect their private network repositories. This enhancement provides a trusted method for incorporating Git-based workflows within Oracle Analytics Semantic Modeler. Configuration steps for setting up a Private Access Channel are available in the documentation.
Expanded Sort Option for Columns in Semantic Modeler
Semantic Modeler authors now have access to new sorting capabilities, with the addition of the reorder columns option. When managing logical and presentation columns, authors can apply custom sort configurations or sort alphabetically, improving consistency and ease of use.
Transparent Update of Database Connections
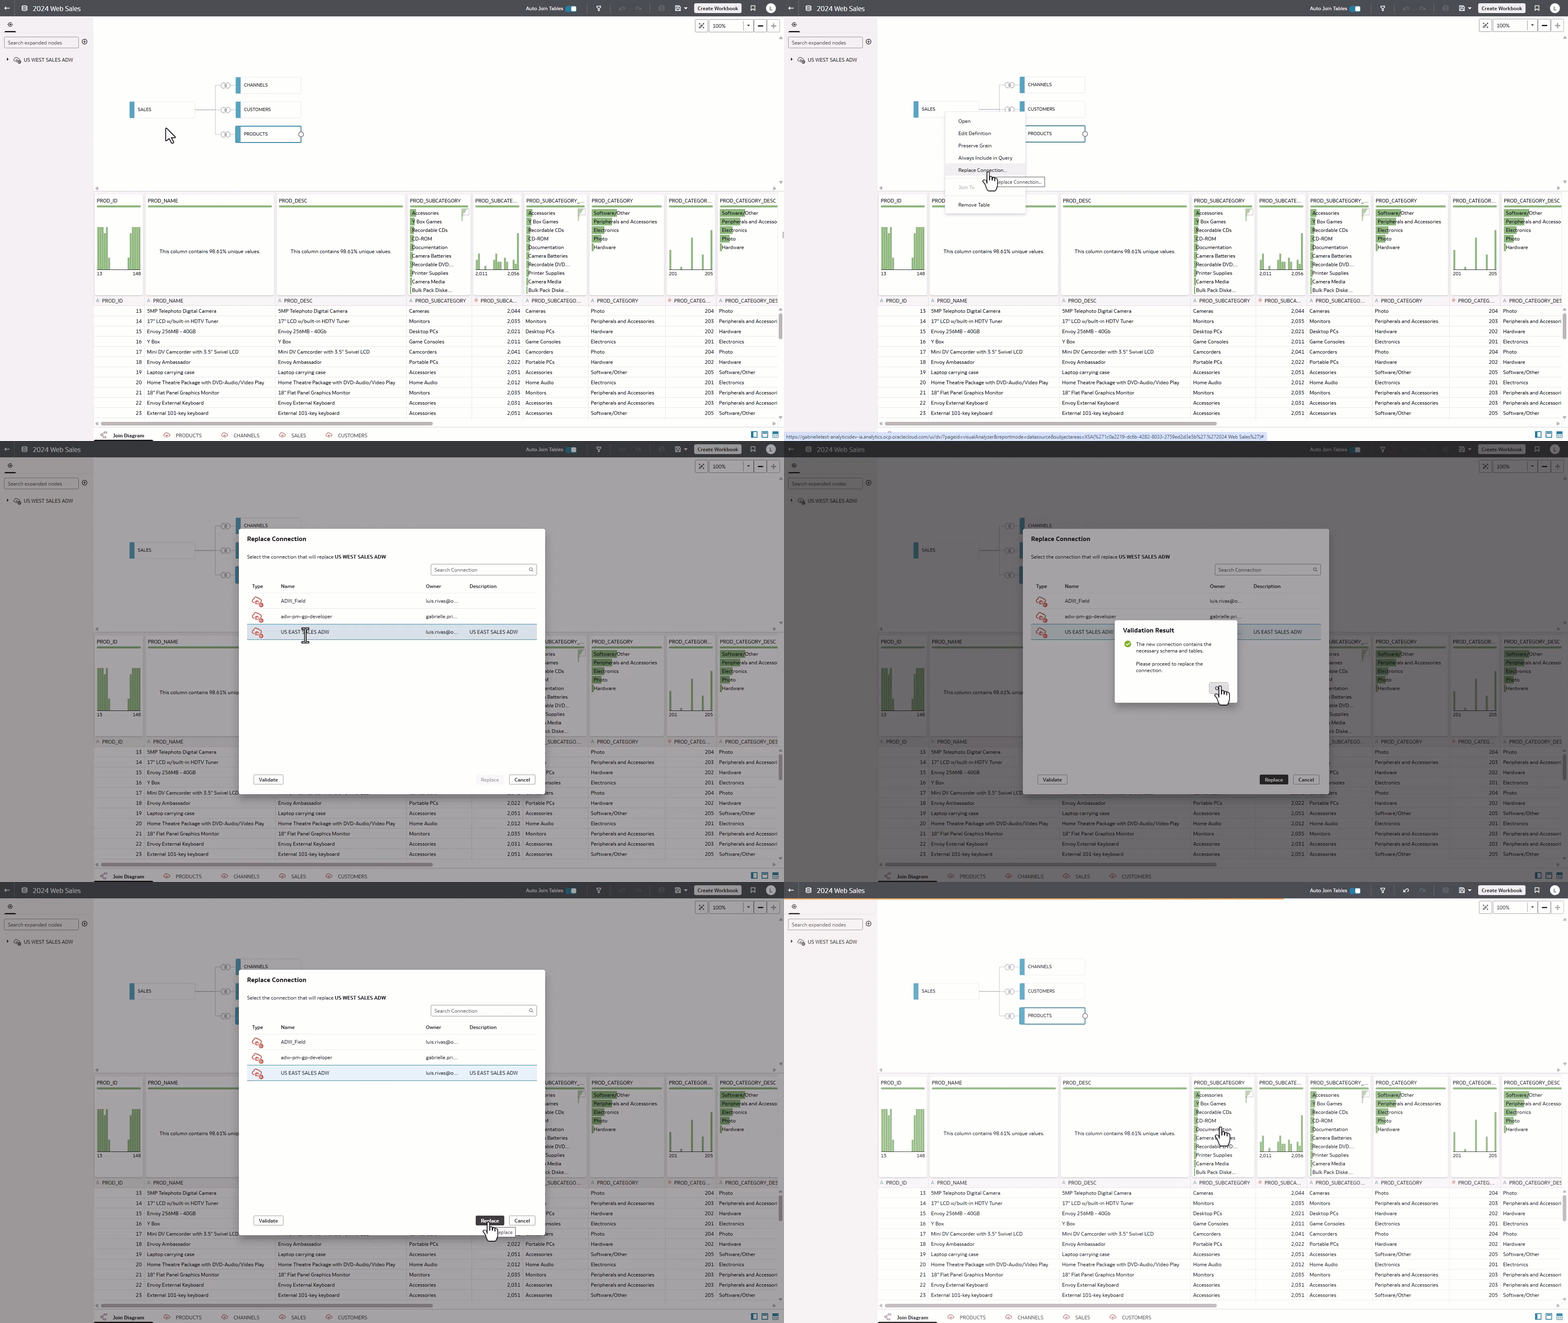
This new feature enables dataset authors to update the database connection for individual tables within a dataset, without needing to rebuild or reimport the entire dataset. A simple right-click and replace provides greater ease for dataset authors, especially those working with mirrored or regionally distributed data sources sharing the same structure.

Exploring, Dashboarding, and Storytelling
Create and Share Custom Pages
Users with fine grain permissions to create and manage pages can now create and share custom pages. The July 2025 update adds custom pages that can be tailored to specific use cases and audiences, allowing users to spotlight key reports, datasets, watchlists and custom groups.
“Pages in Oracle Analytics offer a customizable, centralized way to organize and present content around specific topics or use cases. Teams can surface the most relevant content in a format that is organized, curated, and easy to navigate, delivering focused experiences that drive clarity, collaboration, and impact. With flexible layouts and fine-grained permissions, it’s easy to create and share pages tailored to specific audiences.”
Ricardo Canales, Product Manager, Oracle Analytics
New Visualization Toolbar Experience
The July 2025 update introduces a refreshed toolbar experience for Workbook Authors. The new floating toolbar frees up space above charts, allowing for clearer title display and easier repositioning. Authors can now customize the toolbar’s appearance, alignment, and available actions in present mode, and visually adapt its color scheme to match the chart or dashboard for a more seamless look.
Custom Formatting for Date Parameter Values
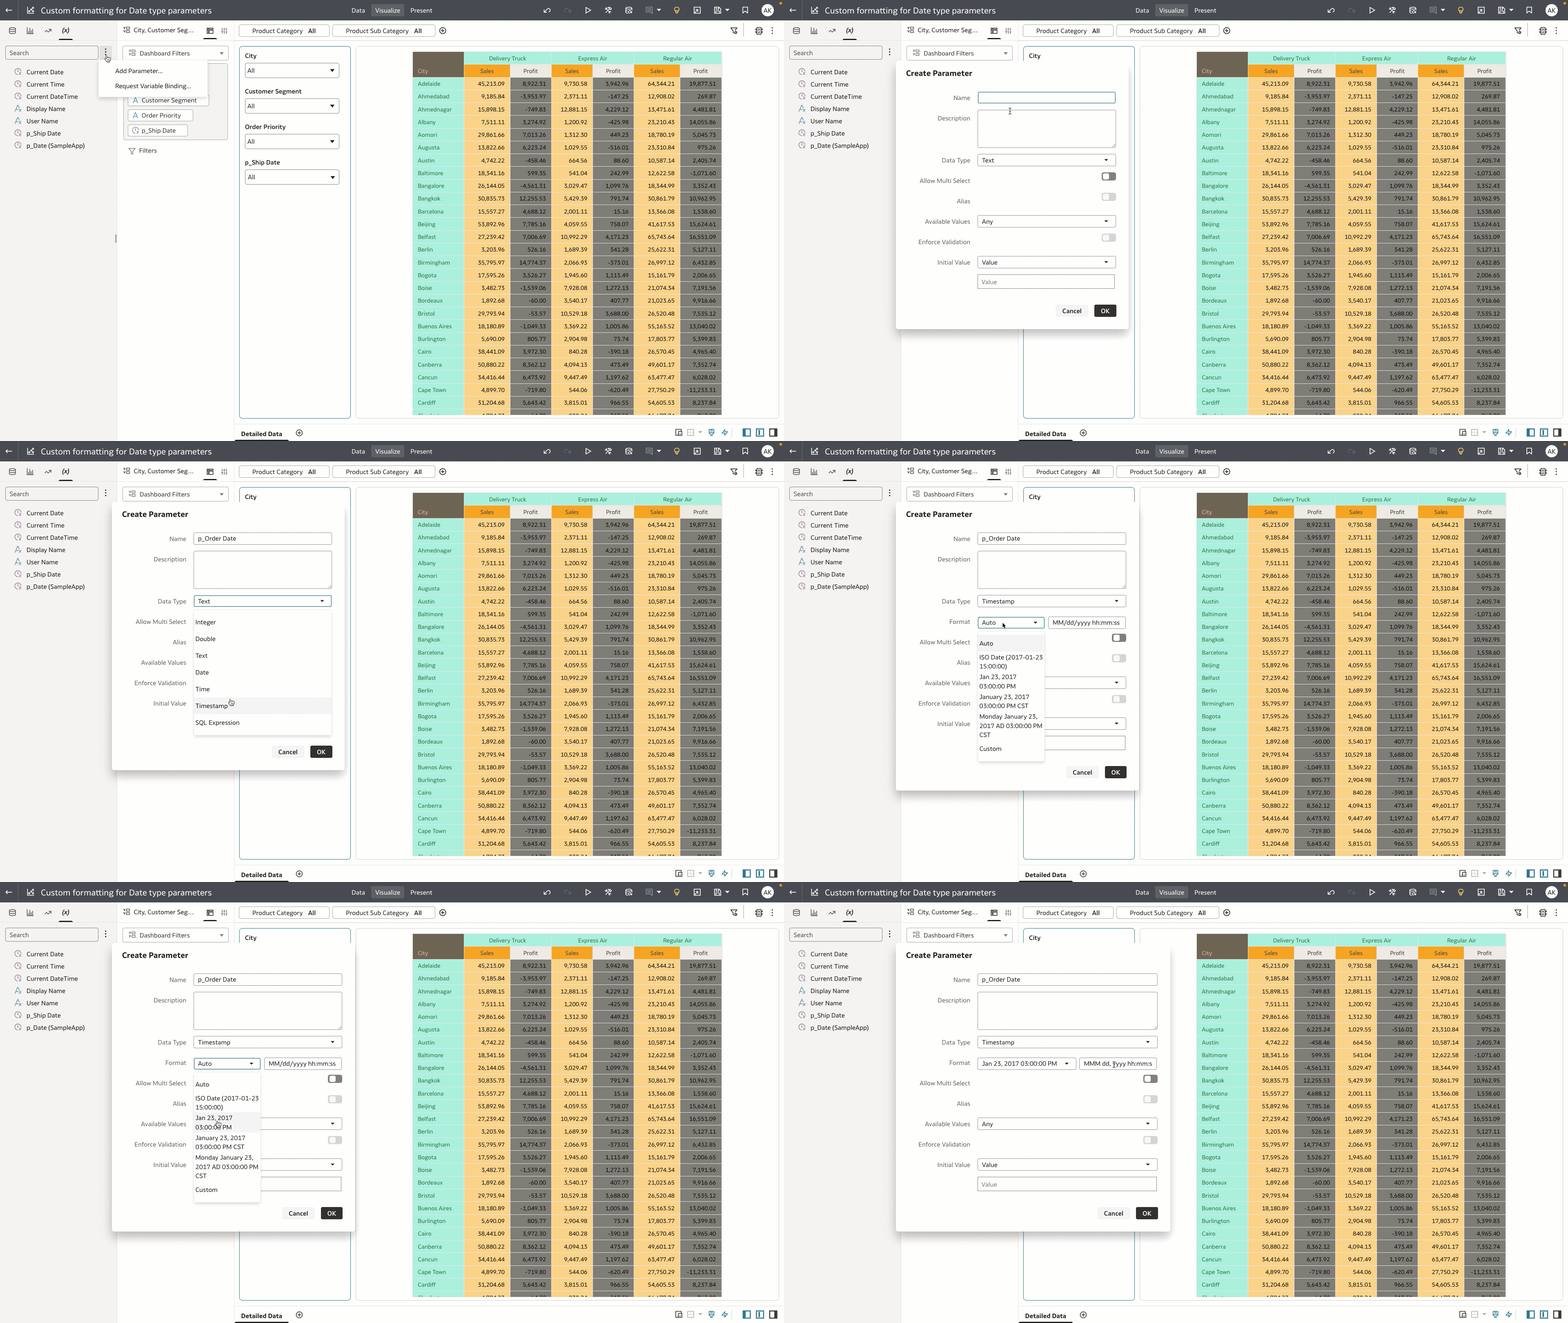
Authors are now able to customize the formatting of Date, Time, or Timestamp data types. OAC suggests a range of standard formatting options for each type, giving the author the option to amend these to fit their end users’ needs.

Formatting for Pivot Table Headers
Pivot Table formatting is upgraded in July 2025, with Workbook Authors able to swiftly edit the format of Header cells separately to the value cells. Headers, sub headers, and totals can be amended in a few clicks, creating pivot tables that are comprehensive and attractive with minimal effort.
Dynamic Lines for Maps
Oracle Analytics extends the dynamic lines feature introduced in the July 2025 update by supporting curved and bi-directional lines, directional arrows, and node linking through attribute columns with geographical place names or geometry data types. With these enhancements, users can dynamically visualize spatial movements and connections across map layers, bringing forward new spatial narratives and relationship patterns in how locations interact over distance and direction.
More Options for Mobile Display
The Oracle Analytics mobile experience can now be further tuned to each Workbook created, via the modes ‘mobile stack’, ‘mobile workbook’, and ‘desktop mode’. These modes alter the extent to which Oracle Analytics will adapt the workbook layout for the mobile experience, and can be altered in app by individual users according to their preferences. ‘Mobile stack’ stacks all visualizations in a single vertical scroll; ‘mobile workbook’ maintains the workbook canvas and applies responsive breakpoints; and ‘desktop mode’ replicates the full desktop layout for richer interaction.
Performance, Compliance, and Administration
Enhanced Administrator Console Experience
Administrators can look forward to a new Console experience with the July 2025 update. The new design will align with the Redwood experience and create a consistent feel across all aspects of OAC.
Key Takeaways
The OAC July 2025 update delivers several key updates for generative AI, AI-powered augmented analytics, semantic model management, and workbook formatting. The features released in this update will support consumers and authors alike in generating in-depth insights on their data, with ease. Changes to the visualization experience will make it even easier for OAC authors to create a customized, targeted experience for a variety of analytics consumers, continuing to deliver business users the information they need to integrate data into their decision making.
For more information:

