

Use Explain in Oracle Analytics Cloud to compare Oracle Cloud Infrastructure cost with expected patterns and investigate the services and regions contributing to unusual spend.
Part 3 of a three-part series
Oracle Cloud Infrastructure (OCI) cost and usage data can show an unexpected change before its cause is clear. Oracle Analytics Cloud (OAC) Explain helps you explore a selected measure, such as Total Cost, against the attributes in the available dataset. It surfaces notable segments, drivers, and anomalies that can focus an investigation.
Explain generates hypotheses; it doesn’t prove root cause. Use it to identify the service, region, tag, or time period that merits closer inspection, then validate the result with operational evidence.
Prepare the data for a reliable investigation
Start with a curated OAC dataset that contains OCI cost and usage records, a representative history of normal activity, and useful dimensions such as service, region, compartment, tag, and billing period. Confirm that data refreshes have completed before interpreting a recent change. If recent data is incomplete or delayed, investigate the data pipeline first.
Open a dashboard visual that shows a meaningful change and keep the question focused. Instead of asking why the Total Cost changed, ask whether a particular service grew in one region during the selected period. Use field names such as SERVICENAME and REGION exactly as they appear in the analytical model.
Use Explain to focus the investigation
Dashboards enable users to identify changes in the data. OAC Explain helps users investigate the underlying causes. A user can select a target measure such as Total Cost and then invoke Explain. OAC analyzes that measure in relation to other attributes available in the dataset and produces descriptive insights, significant segments, drivers, and anomalies. The Anomalies view highlights attribute combinations that differ from the expected pattern.
Historical data is essential in this use case because it enables the Explain feature to establish a more reliable baseline and identify anomalies more accurately. Therefore, collect as much relevant historical data as possible. The anomalies highlighted in this example are specific to our dataset; the patterns and anomalies detected in your environment may differ.
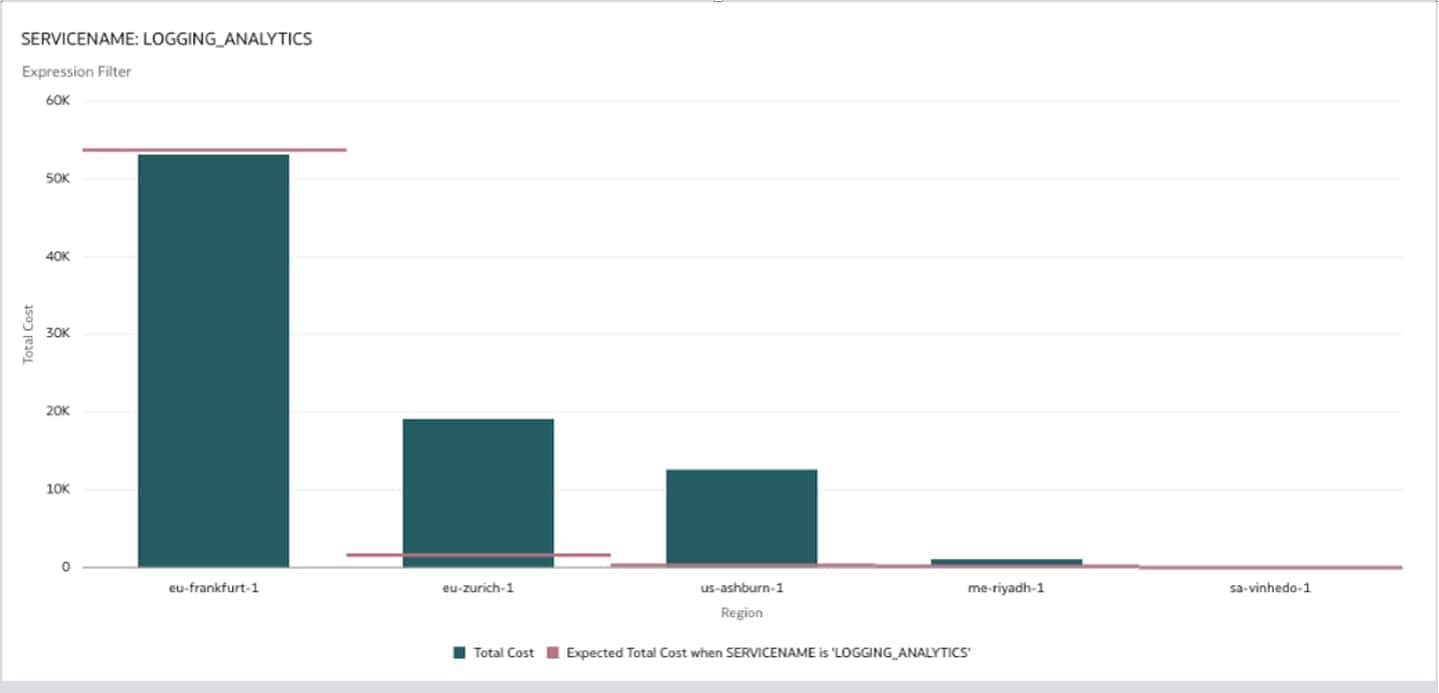
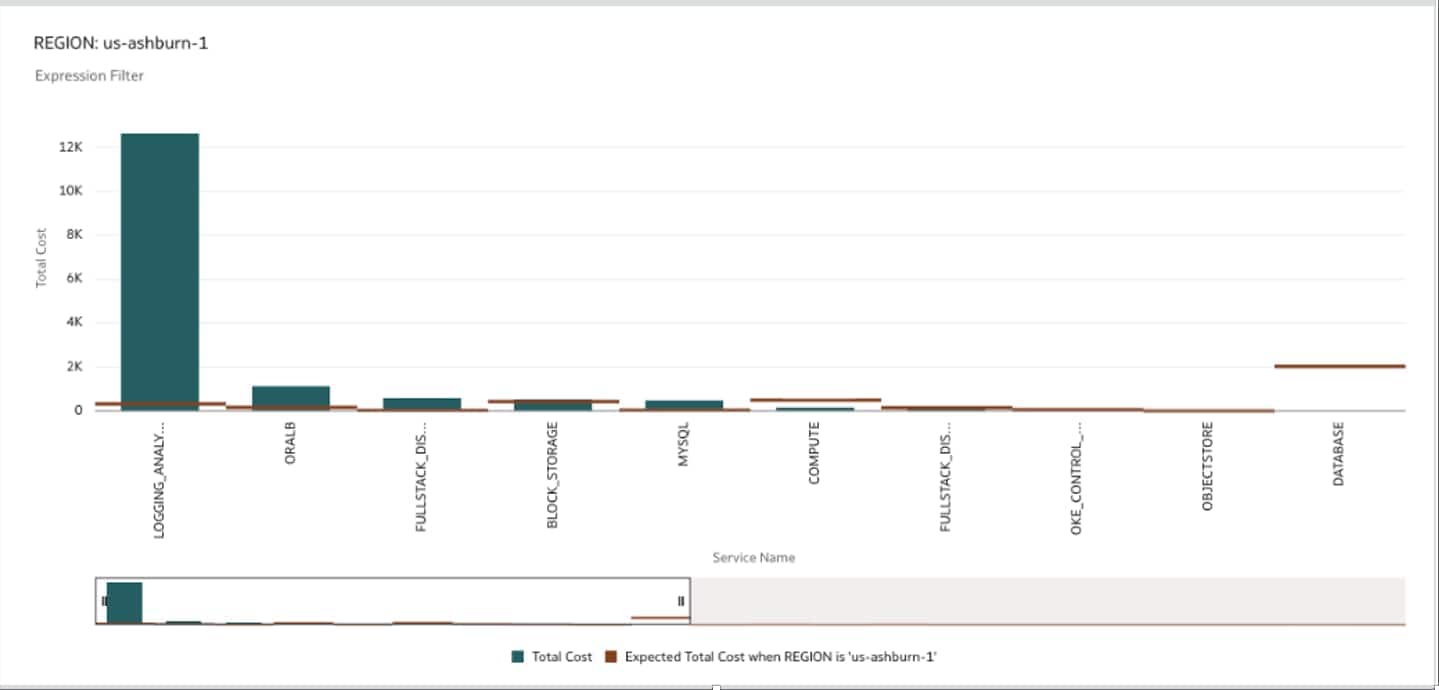
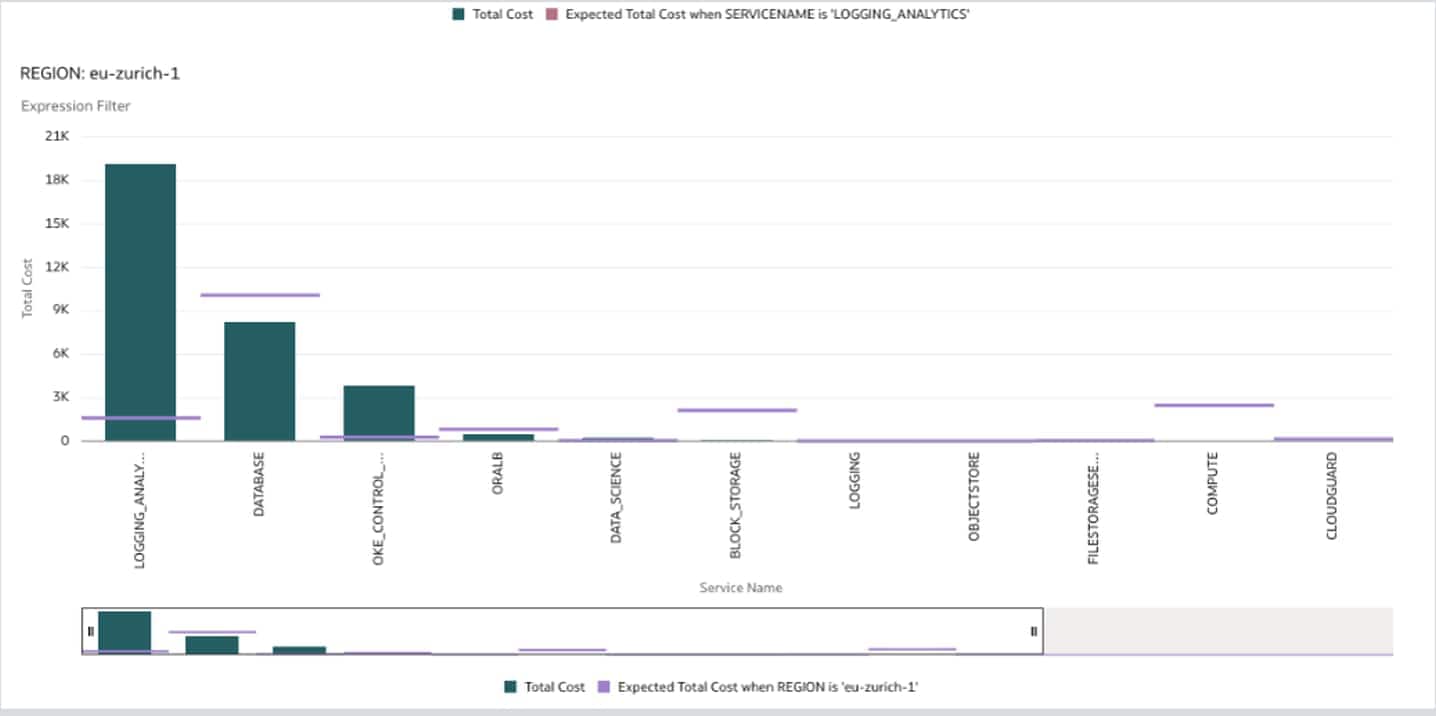
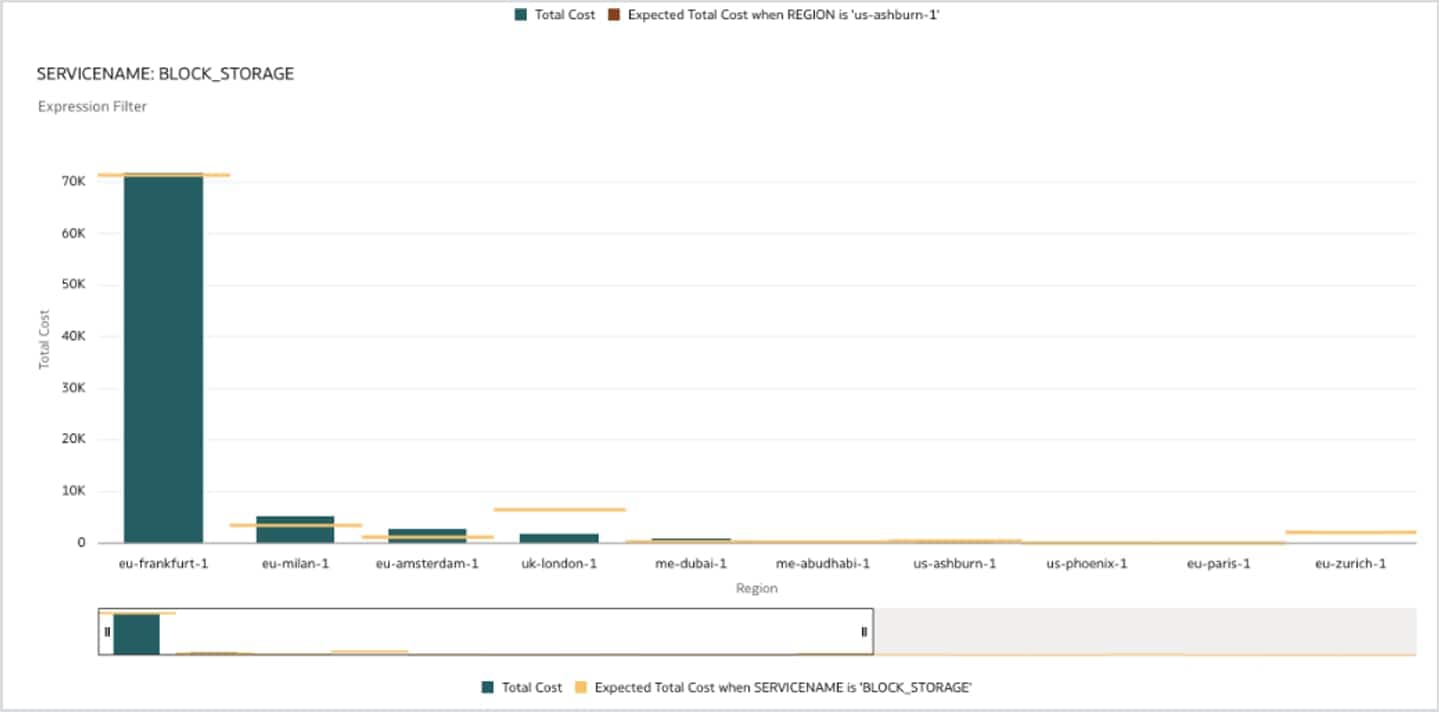
In the example, Explain generates views for conditions such as SERVICENAME = LOGGING_ANALYTICS, REGION = us-ashburn-1, REGION = eu-zurich-1, and SERVICENAME = BLOCK_STORAGE. Bars show observed Total Cost, while the reference lines represent the expected value calculated for the selected condition.
This changes the investigation from a generic statement such as “cost increased” to much more targeted questions:
- Is Logging Analytics unusually concentrated in one region?
- Is the service mix in a region different from the historical pattern?
- Is Block Storage consumption higher than expected in a particular location?
- Is the result a genuine operational event, a tagging problem, or a data-loading issue?
Treat Explain as a hypothesis generator rather than an automatic root-cause engine. Its output still needs to be interpreted alongside deployment activity, resource inventories, application events, and pipeline audit data.
More information
- What Is Explain?
- OCI Cost and Usage Reports Overview
- Connect Oracle Analytics Cloud to Oracle Autonomous AI Lakehouse
- OCI Cost Anomaly Detection Overview
- Custom Sample ETL Code
Call to action
Ready to turn your OCI consumption data into actionable insights?
Start by building a data pipeline to extract OCI cost reports and load them into Oracle Autonomous AI Lakehouse.
Then connect the data to Oracle Analytics Cloud to visualize your OCI cost consumption in a more governed, interactive FinOps platform.
If you have questions, want to compare approaches, or would like to share what you create, start a conversation in the Oracle Analytics Community.