Use Case: An organizational chart is crucial for visualizing the hierarchy within an organization. It clarifies roles, reporting lines, and team structures, improving communication and decision-making. Organizational charts help identify staffing gaps, streamline workflows, and support strategic planning for growth or restructuring. By leveraging Oracle Fusion Data Intelligence (FDI) along with Oracle Analytics extensions, organizations can automate and enhance the process of generating these charts.
This article covers how to create an organizational chart using the Org Chart extension in Oracle Analytics, integrated with data prepared through FDI. It explains how to transform flat hierarchy data into a parent-child structure using datasets and data flows, enabling efficient visualization of organizational structures.
Follow these steps to create an organizational chart using the Org Chart extension in Oracle Analytics:
- Download the Org Chart extension: Visit Oracle’s official website to download the Org Chart extension.
- Create Datasets: Prepare the necessary datasets that contain the flat hierarchy information for the organizational structure.
- Use Data Flows: Utilize data flows to transform the flat hierarchy data into a parent-child relationship.
- Create Data Visualizations: Use the dataset to generate visualizations through the Org Chart plugin in Oracle Analytics.
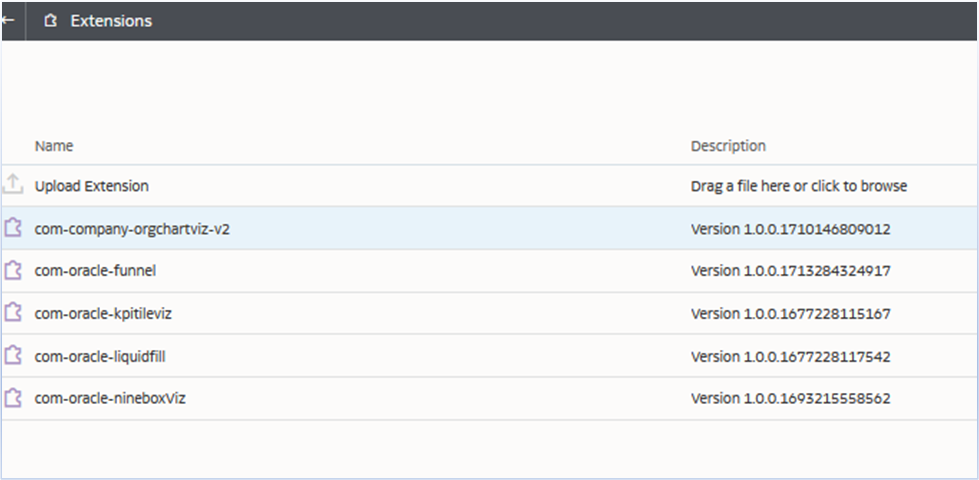
Download the Org Chart extension:
- Go to the Oracle Analytics Extensions page.
- Locate and download the Org Chart extension .zip file.
- Upload the extension in Oracle Analytics Cloud (OAC):
- Log into the OAC Console.
- Navigate to Visualizations and click Sharing, then Extensions.
- Click Upload Extension and select the downloaded Org Chart.zip file.
- Refresh the page to activate the plugin.
Create Dataset 1 Using HCM – Workforce Core
Dataset 1: Fetch information on Top Managers and Managers, along with basic employee details.
Select the following attributes:
Top Manager:
“HCM – Workforce Core”.”Top Manager”.”Top Manager Person Name”
Basic Information:
“HCM – Workforce Core”.”Basic Information”.”Person Number”
“HCM – Workforce Core”.”Basic Information”.”Person Full Name”
Manager Information:
“HCM – Workforce Core”.”Manager Information”.”Manager Person Number”
“HCM – Workforce Core”.”Manager Information”.”Manager Name”
This dataset establishes the foundation for visualizing the organizational hierarchy.
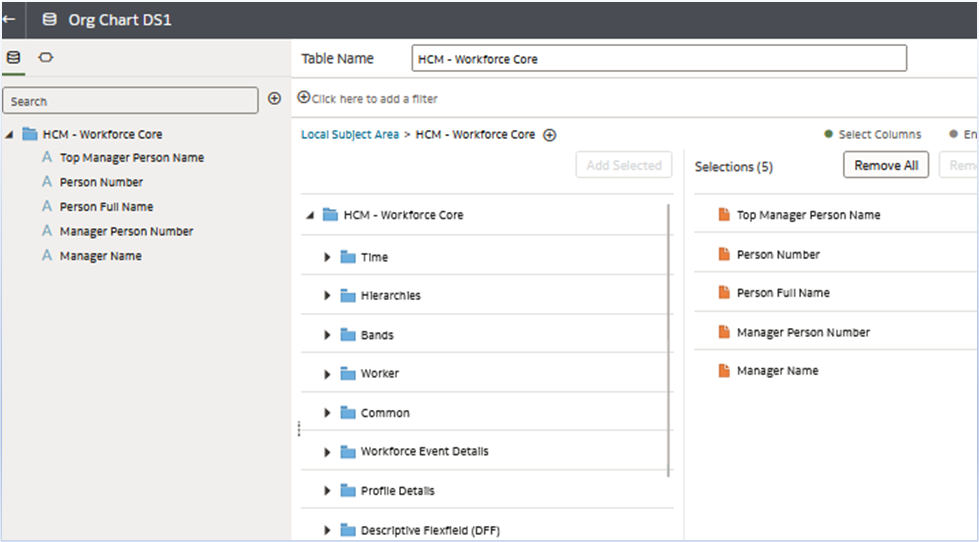
Save this as Org Chart DS1.
Create Dataset 2: Top Manager Information
Dataset 2: This dataset fetches details about Top Managers.
Use the following LSQL:
SELECT
“HCM – Workforce Core”.”Top Manager”.”Top Manager Person Name”,
“HCM – Workforce Core”.”Top Manager”.”Top Manager Person Number”,
“HCM – Workforce Core”.”Top Manager”.”Top Manager Person Name”,
” AS “MNO”,
” AS “MNAME”
FROM “HCM – Workforce Core”
Save this dataset as: Org Chart DS2.
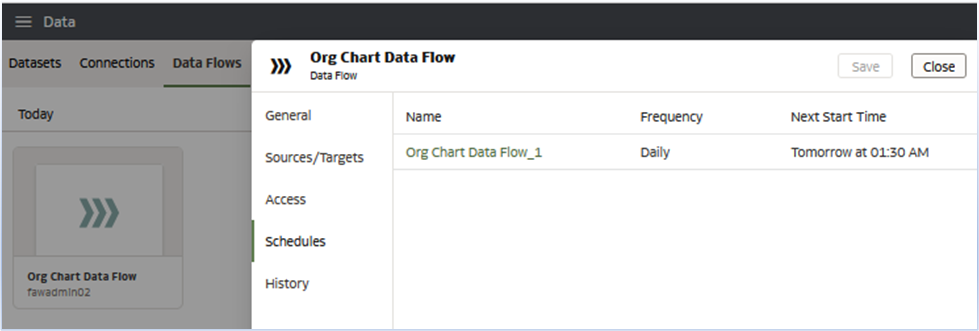
Create a Data Flow:
Create a data flow to apply Union All to the data sets.
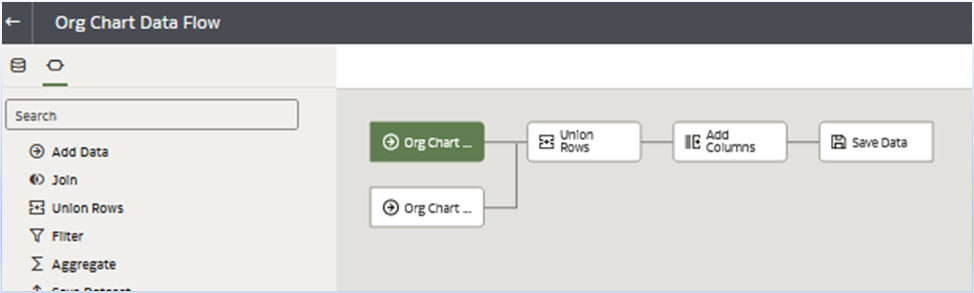
Click Save Data and save into the dataset.
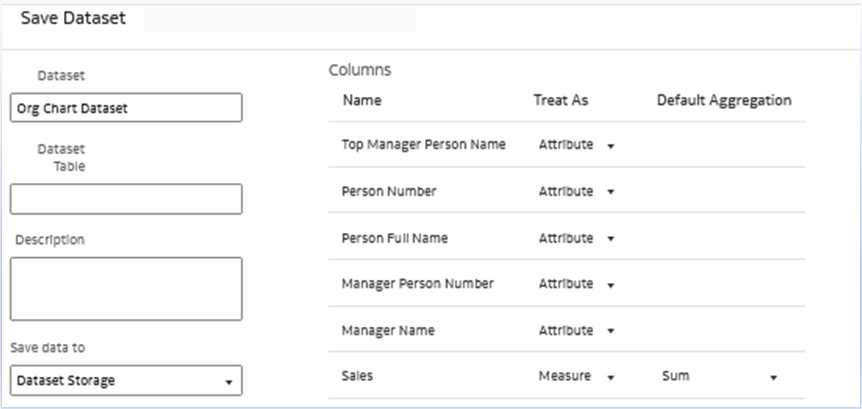
Note: A dummy measure column is used.
Create a schedule for the data flow to automate data refresh, setting the frequency as needed to keep the Org Chart current.

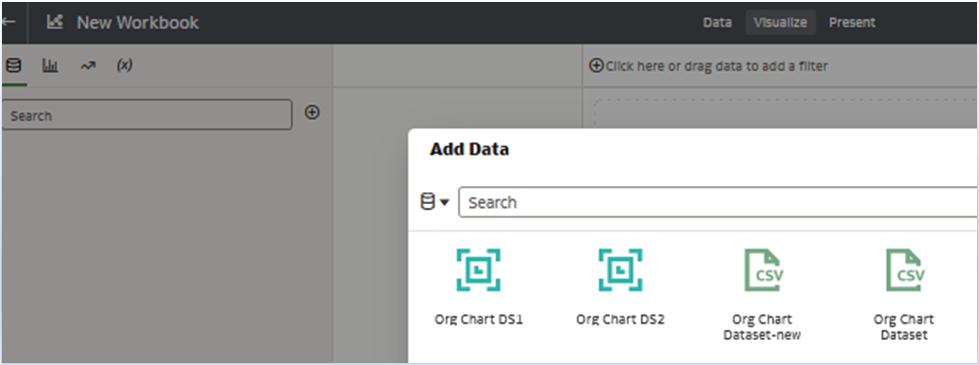
Create a workbook and select the Org Chart dataset created in the previous steps.
Select these attributes:
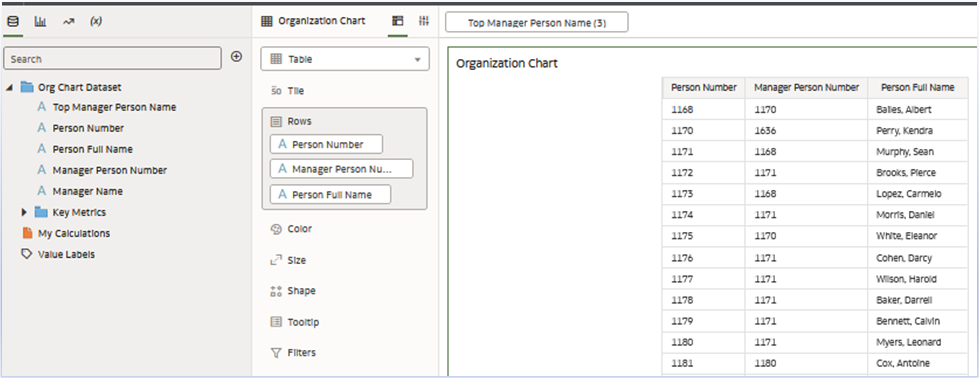
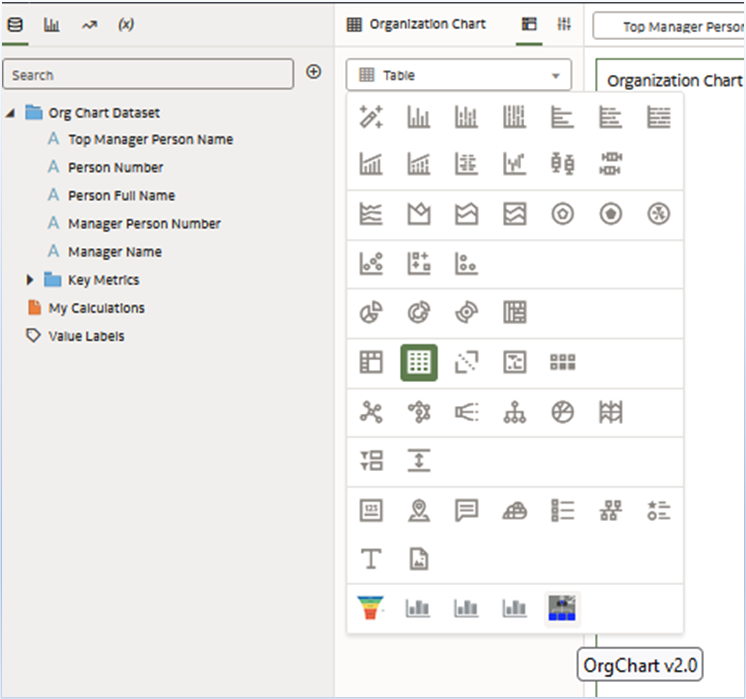
Change the visualization type to Org Chart (the extension from the first step).
Drag Person Full Name under Category (Details).
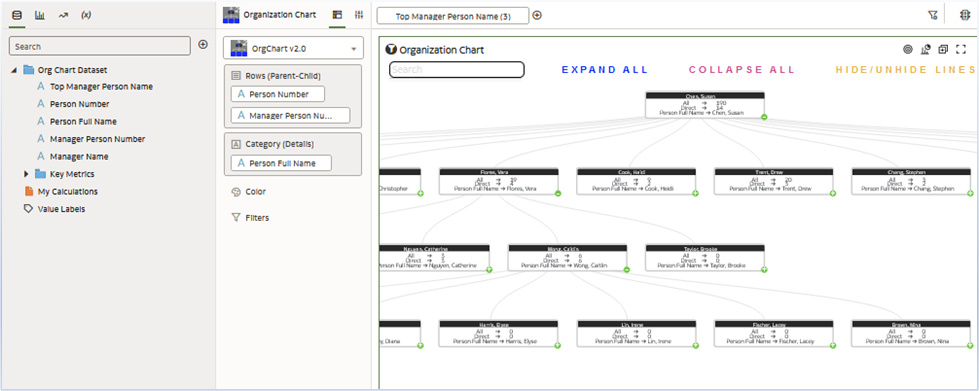
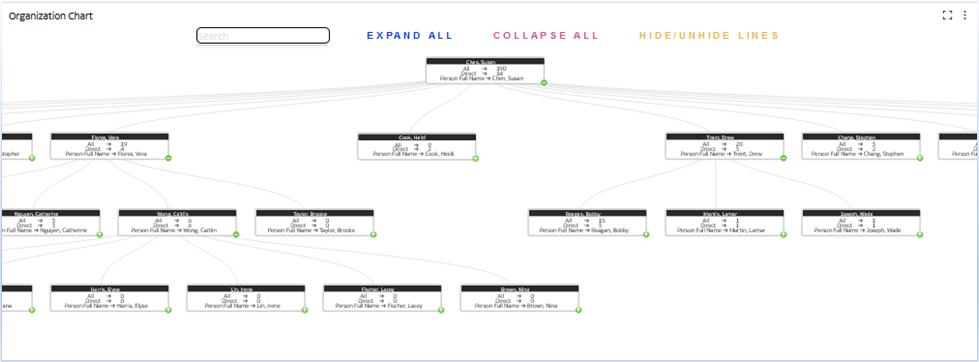
The Organizational Chart is now ready, with the capability to expand and collapse nodes as needed for dynamic viewing.
Call to Action
Leveraging the Org Chart extension in FDI, alongside Oracle Anatlyic extensions, provides a streamlined and efficitne method for representing complex organizational structures. Try the Org Chart extension in Fusion Data Intelligence for visualizing hierarchical data to provide a streamlined and efficient method for representing complex organizational structures.