Similarity Analysis Overview Summary
Similarity analysis is technical a process that determines how similar two or more items are to each other. These items can be anything—documents, products, user profiles, data points, etc.—depending on the domain. In other words, it is about comparing records in a dataset to find how much they are alike.
Many common use cases exist in various business contexts, like recommending products similar to what a user viewed, identifying patients that have similar symptom as others, and understanding if a service request was already logged for a similar issue.
Business users can extract a lot of value if they are enabled with a technology to directly compute similarity analysis. Oracle Analytics offers a powerful feature that allows business users to achieve exactly this. Find records in a dataset that are similar to a specific record or a set of specific records. This capability is enabled by vector search technology, which uses a VECTOR data type in Oracle Database 23ai. This allows for semantic searches on unstructured and structured data, moving beyond traditional attribute-value based searches. See video links and official release documentation to implement Similarity Analysis today on your Oracle Analytics deployment.
The Role of Vector Search
At its core, similarity analysis relies on vector embeddings. These are numerical representations of data points, where the “meaning” of the data is captured by its position in a multidimensional space. The closer two data points are in this space, the more similar their underlying content is. By using vector search, Oracle Analytics can quickly identify and rank records based on their proximity to a source record.
Concepts and Use Cases
- Prerequisites: To perform a similarity analysis, you need a dataset residing in a supported Oracle Database or Autonomous Data Warehouse (version 23ai or later) and a registered vector embedding model within your Oracle Analytics instance.
- The Data Flow: Similarity analysis is performed using a data flow. This is a step-by-step process where you select your dataset, apply the “Similarity Analysis” node, configure parameters, and save the output.
- Parameters: In the “Similarity Analysis” node, you configure essential parameters such as the source value for comparison, whether you want to find the closest or furthest values, and the number of results to return.
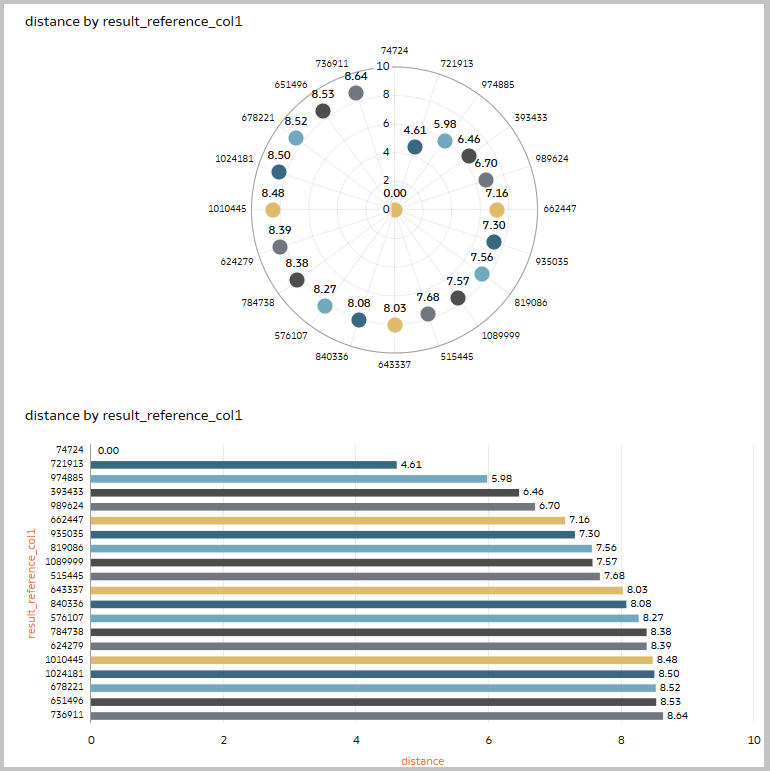
- Interpreting the Results: The output of the data flow is a new dataset that includes columns detailing the original data, the source record, and a “distance” column that quantifies how similar each record is to the source. This new dataset can then be used to create visualizations for deeper analysis.
Day-to-Day Applications
Similarity analysis can be applied to a wide range of business problems, including:
- Customer Profiling: Find customers with a similar purchasing history or demographic profile to a high-value customer to target for marketing campaigns.
- Fraud Detection: Identify insurance claims or financial transactions that have a similar pattern to a known fraudulent activity.
- Healthcare: Find patients with a similar health profile (symptoms, lab results, medical history) to a specific patient to assist with diagnosis or treatment plans.
- E-commerce: Power recommendation systems by identifying products with similar attributes or descriptions to items a user has purchased or viewed.
Oracle Analytics empowers business users to leverage this advanced AI-driven capability without requiring data science expertise, making it easier to uncover valuable insights and make data-driven decisions. See the official release documenation for full details.
Proceed to the next section for detailed implementation steps and videos on running similarity analysis on your Orace Analytics instance today.
Review the Oracle AI Vector Search User’s Guide for additional details.
Technical Implementation of Similarity Analysis on Oracle Analytics
Follow the steps and videos below to implement Oracle similarity analysis.
Prerequisites
Users must be on a 23AI version of ADW. Before proceeding you must install your desired vector embedding models. View the official Perform Similarity Analysis in Oracle Analytics documenation for full details.
Before you start, create a connection to your 23AI ADW database. See Create a Connection to Oracle Autonomous Data Warehouse.
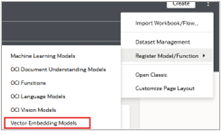
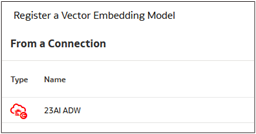
- Start on the Oracle Analytics Cloud (OAC) Home page, click register model/function, and select the connection to your 23AI database.
- Select your model, provide a custom name if applicable and select your desired vector distance to be used for your model. By default, all models use COSINE distance.
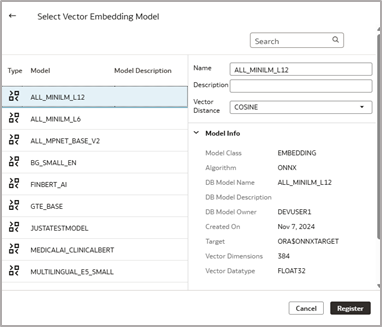
3. Click register.
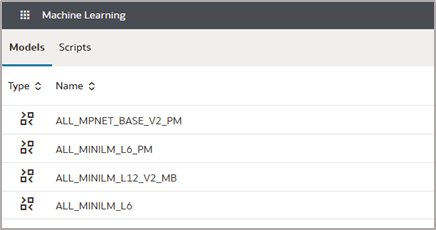
4. From the OAC Home page, click the left menu option, select machine learning, and confirm that your model appears.
Create a Similarity Analysis Dataflow in OAC
- From the OAC Home page, select create dataflow.
- Select the dataset. Your source data must reside on the same 23AI database your vector embedding model is registered on.
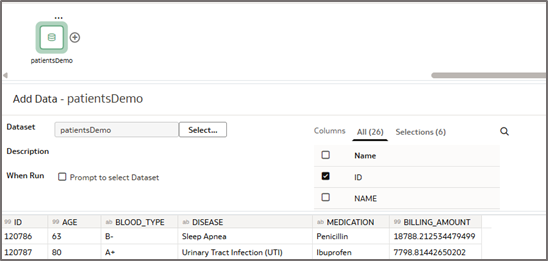
- Choose only the columns necessary to achieve your desired similarity analysis. In our example, we are using ID, age, Blood Type, Disease, Medication and Billing Amount. Only these values will be used to determine vector distance between our ‘ID’ (patients).
Note: Your input data can be a combination of attribute and dimensions and must contain one column that is a unique identifier.
4. Add the Similarity Analysis node to your dataflow and select your desired model.
5. From the output section ‘check’ profile_expression for users looking to include the concatenated string of their model in the output dataset.

6. From the parameters section, select your source value. Your source value should be a unique identifier in your dataset. In our example, we are looking for the similarity between our patients.
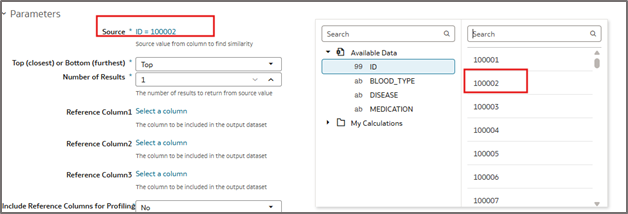
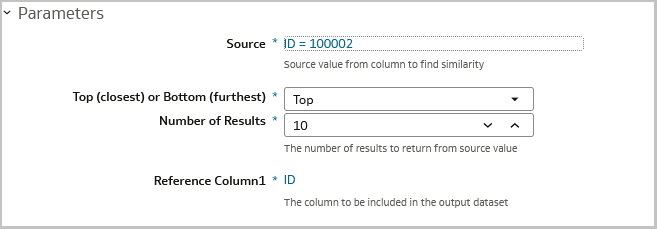
7. Choose if you’re seeking the top or bottom results (closest or furthest from your source selection). Choose the number of results you wish the model to return (Max 10,000).
8. Select a column value for reference column1. This has to be an attribute column used to uniquely identify the records in your output dataset. That unique ID will then be useful to join back this output dataset with the original data containing all the columns.
9. If applicable, you can choose values for reference columns 2 and 3 to be included in your output to to provide an additional unique ID in your model output dataset. These columns can be be used to easily join back to your original dataset.

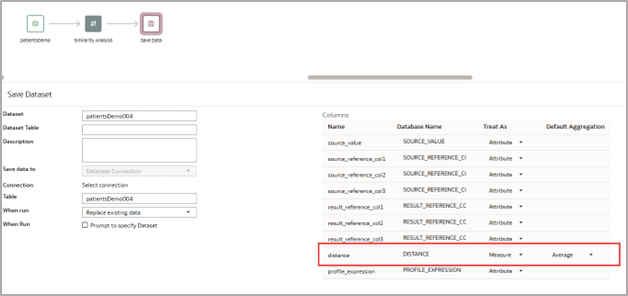
10. Add the save data node to your dataflow, provide a dataset name, save the dataflow, and run. Change the default aggregation for distance to ‘average’.
Visualize Your Results in OAC
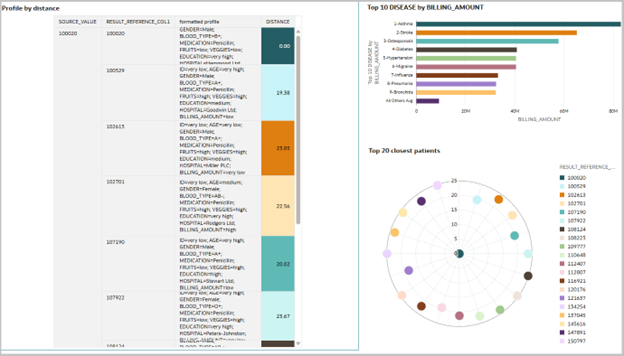
- Create a workbook using your output dataset and begin visualizing the results of your similarity analysis dataflow.
Call to Action
Now that you’ve read this article, try it yourself and let us know your results in the Oracle Analytics Community, where you can also ask questions and post ideas. It’s free and easy to join!
If you have questions or need more details, you can always check the Help Center for Oracle Analytics.