
Embedding Oracle Analytics Cloud Visualizations, Auto Insights and the Analytics AI Assistance into a Web Experience.
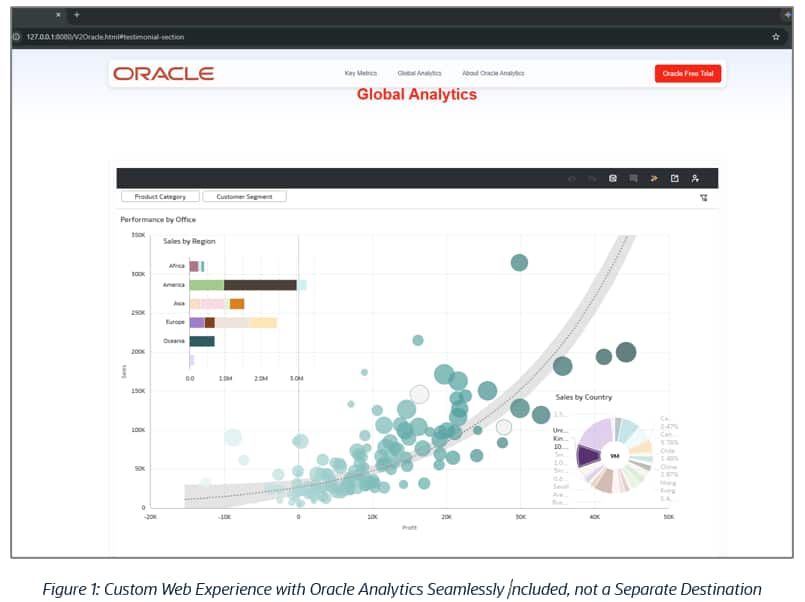
Oracle Analytics Cloud (OAC) can be embedded within an application, APEX or a web page, all while retaining the interactive analytics experience and extending it with the Oracle Analytics AI Assistant. The result is a practical pattern for bringing governed analytics and conversational exploration closer to the point of decision.
From a dashboard destination to an embedded experience:
This article displays a custom Oracle-branded web page which includes an embedded analytics view. Instead of asking users to open a separate analytics application, by utilizing embedded analytics, the web page places the visualizations directly into the web page or application with the surrounding site experience. Navigation, branding, explanatory content and analytics can thus coexist in one interface.
This matters because embedding changes the role of analytics. A dashboard is no longer only something users visit; it becomes a component that product teams can place where a business process already happens. This reduces context switching and makes data more accessible to audiences who may never think of themselves as traditional BI users.
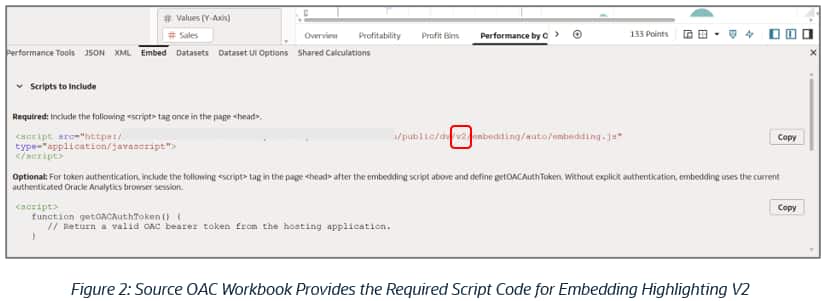
The embedding pattern: a small amount of page code, a full analytics experience:
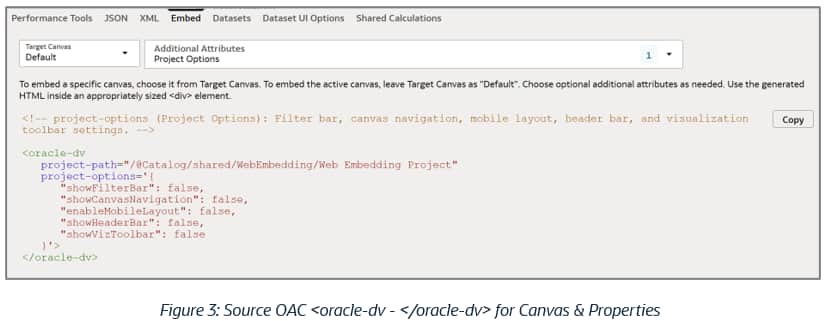
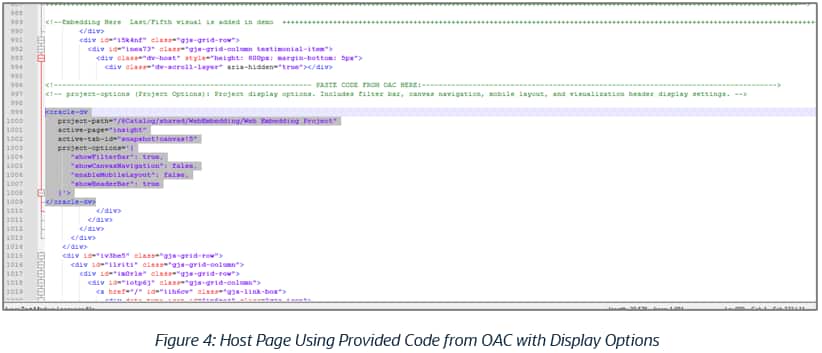
The embedding implementation uses the OAC embedding JavaScript, all natively provided within the OAC developer options. The page loads the standalone embedding library, initiates the required Orace data visualization component, denoted within <oracle-dv> code, and then identifies the workbook content to display.
Key Configuration points:
- Project Path: The embedded component points to the OAC workbook within the catalog. Shown below with the workbook “Web Embedding Project”.
- Project Options: These options control elements such as the filter bar, canvas navigation, mobile layout, visualization header and header color. Within the workbook “Web Embedding Project,” the visualization header is enabled so users can access the richer analytic controls, such as Auto Insights, Oracle Analytics Assistant, and OAC AI Agent.
Embedding more than a chart: Bring the OA Assistant with it.
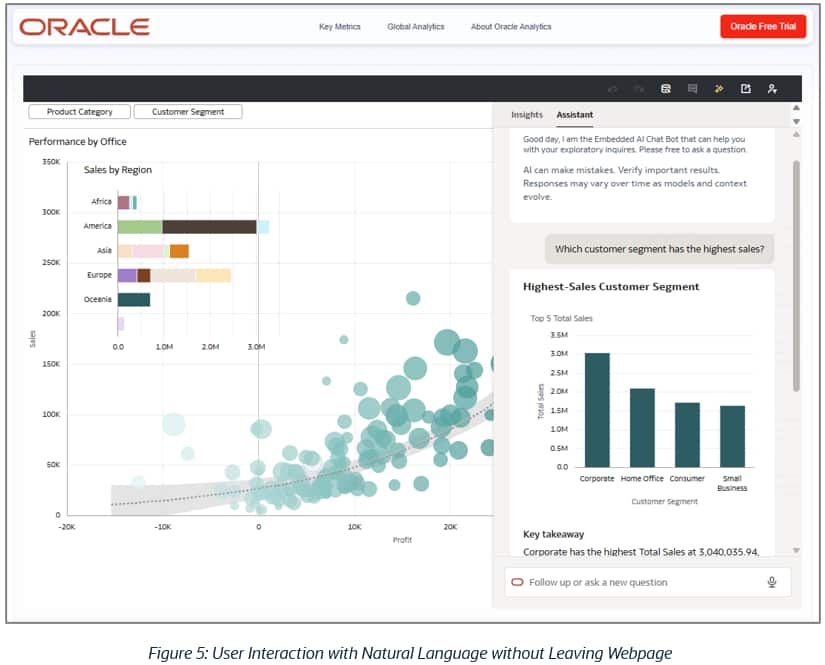
With the visualization header available, the user can open the assistant panel alongside the visualization. This turns the embedded analytics into a conversational experience that the user can interact with. Users can ask a business question in natural language while remaining in the context of the host application.
The example question is straightforward: “Which customer segment has the highest sales?” The assistant responds within the same embedded experience, paring a generated visualization with a written explanation. From that question, Corporate has been identified as the leading customer segment, and the response explains the ordering of the segments rather than returning only a single value.
Why conversational analytics is especially valuable when embedded.
Conversational analytics is useful on its own but embedding it changes where it can be applied. A sales application can let managers ask why performance has changed without opening another tool. A service portal can surface a governed operational view and allow a supervisor to ask follow-up questions. An executive site can combine narrative content, KPIs and conversational exploration on the same page.
That combination can also make analytics approachable for a broader audience. Users don’t need to know which field to drag onto a canvas or which visualization to construct first. They can begin with a visualization or workbook critical for their role, and then ask a question, inspect the answer, and refine the analysis through follow-up prompts.
The conversation can continue.
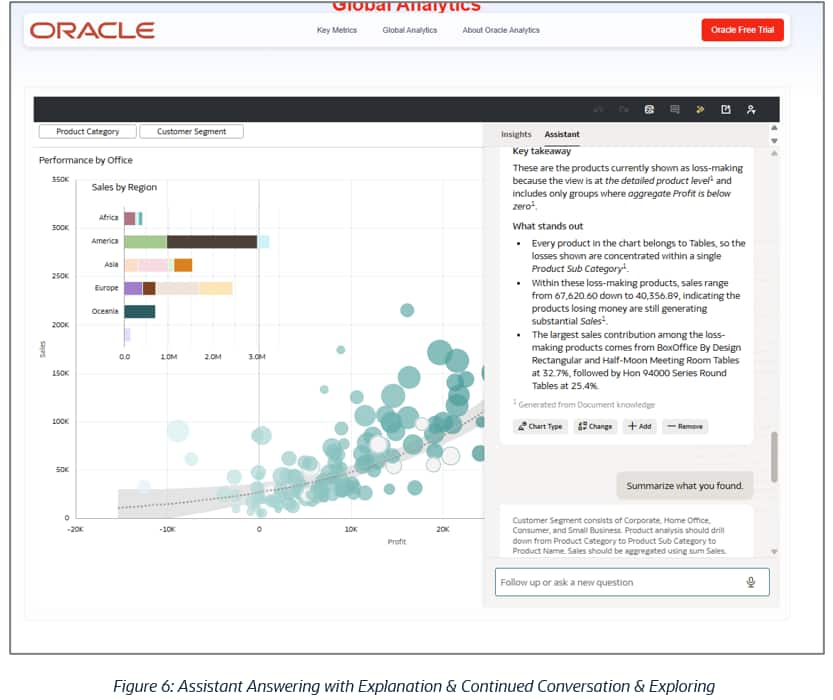
The Assistant isn’t limited to a single prompt. After receiving an initial answer, the user can ask for additional analysis, including a request to rank groups by total sales. The Assistant continues generating content in the panel while the original visualization remains visible. The side-by-side pattern keeps the underlying analytic context anchored while the conversation grows, becoming more specific.
A useful architecture for analytics-driven applications
The host application keeps the responsibility for the user experience and business workflow, while using OAC for governed visual analysis and AI assisted exploration. The embedding layer connects the two.
The Takeaway: Embedding OAC isn’t simply about placing a dashboard inside an iframe-like space. The approach shown in this article exposes a richer analytics component inside the application, including interaction, presentation controls, and access to the AI features built into OAC.
Where to take this next?
For teams building data-rich applications, this capability opens several possibilities.
- Embed analytics at the point where a decision can be made.
- Tailor the visible controls to the audience.
- Land users on a specific workbook canvas.
- Make natural-language analysis available without forcing a change of application content.
The technical footprint in the host page or application can remain focused while OAC supplies the analytic depth.
The result is a more integrated users experience: branded like the application, grounded in governed analytics, and flexible enough for users to move from viewing a visualization, to asking the next question within the same place.
Documentation
- Oracle Analytics Cloud Online Product Documentation
- Oracle Analytics Cloud Embedding Documentation
- About the JavaScript Embedding Framework V2 vs V1
- Prepare the HTML Page for Embedded Oracle Analytics Content
Call to Action
Try embedding OAC within an application or website and share your results in the Oracle Analytics Community. You can also use the community to ask questions and provide feedback. For additional details, refer to the Oracle Analytics documentation and Help Center Resources. If interested in seeing this, reach out to Oracle and request a demo of the embedding capabilities.